Back to Home
Page of CD3WD Project or Back to list of CD3WD Publications
 |  |  | World Energy Assessment - Energy and the Challenge of Sustainability (UNDESA - UNDP - WEA - WEC, 2000, 517 p.) |  |  | PART III: ARE SUSTAINABLE FUTURES POSSIBLE? | | | Chapter 9. Energy Scenarios | |  | (introduction...) | | | What are scenarios and how are they used for energy assessments? | | | (introduction...) | | | Alternative development paths and how they are reflected in scenarios | | | Energy scenarios for sustainable development | | | Brief review of the literature on energy scenarios | | | Three energy scenarios for the 21st century | | | (introduction...) | | | Economic development and equity | | | Improvement of energy intensities | | | Primary energy requirements and supply | | | Technological dynamics and structural change | | | The structure of final energy requirements | | | Temporal and spatial scales of scenarios | | | The legacy of past generations | | | The role of policies | | | Implications of sustainable energy scenarios | | | (introduction...) | | | RD&D trends and requirements and technological diffusion | | | Capital requirements and financing | | | Technological diffusion | | | International energy trade and security | | | Environmental issues at the local and regional scales | | | Climate change: Land use and other global issues | | | Conclusion | | | Chapter 10. Rural Energy in Developing Countries | | | (introduction...) | | | Rungs on the energy ladder | | | Fuels in rural areas: climbing the energy ladder | | | (introduction...) | | | Improved cooking stoves | | | Kerosene and liquefied petroleum gas | | | Biogas for cooking | | | Producer gas for cooking | | | Rural electrification | | | (introduction...) | | | The centralised approach | | | The decentralised approach | | | Leapfrogging to new rungs on the energy ladder | | | The time horizon for technological options | | | Accelerating rural energy development | | | (introduction...) | | | Integrated rural development | | | Involving rural people (particularly women) in decision-making | | | Strategies for expanding access to modern energy services | | | Strategies for making modern energy services affordable | | | Conclusion | | | Annex. Case studies of crop-residue-derived modern energy carriers in China |
|
World Energy Assessment - Energy and the Challenge of Sustainability (UNDESA - UNDP - WEA - WEC, 2000, 517 p.)
PART III: ARE SUSTAINABLE FUTURES POSSIBLE?
Chapter 9. Energy Scenarios
Nebojsa Nakicenovic (Austria)
LEAD AUTHORS: Tom Kram (Netherlands), Alexj Makarov (Russian
Federation), Bent S�rensen, (Denmark), Keiichi Yokobori (Japan), and Zhou Fengqi
(China)
CONTRIBUTING AUTHORS: Yasumasa Fujii (Japan), Jeffrey Stewart
(United States), and John Weyant (United States)
|
ABSTRACT
Energy scenarios provide a framework for exploring future
energy perspectives, including various combinations of technology options and
their implications. Many scenarios in the literature illustrate how energy
system developments will affect the global issues analysed in part 1 (chapters
1-4). Some describe energy futures that are compatible with sustainable
development goals, such as improved energy efficiencies and the adoption of
advanced energy supply technologies. Sustainable development scenarios are also
characterised by low environmental impacts (local, regional, global) and
equitable allocation of resources and wealth.
The three cases of alternative global developments presented
in this chapter suggest how the future could unfold in terms of economic growth,
population trends, and energy use. The challenge is formidable. For example, by
2100, 6-8 billion additional people - significantly more than the world
population today - will need access to affordable, reliable, flexible, and
convenient energy services. All three cases achieve this, through different
energy system developments, but with varying degrees of sustainability.
A middle-course reference case (B) includes one scenario and
is based on the direction in which the world is headed. Assuming continued
moderate economic growth and modest technological improvement, this scenario
leads to adverse environmental impacts, ranging from regional acidification to
climate change. Thus - although it is a substantial improvement over the current
situation - this scenario falls short of achieving a transition towards
sustainable development. The other two cases and their variants lead to higher
levels of economic development with vigorous improvement of energy technologies.
They both - especially the ecologically driven case (C) - also result in a
transition towards sustainable development.
Case A includes three scenarios with high economic growth
throughout the world. One of them, A3, achieves some sustainable development
goals through rapid economic growth in conjunction with a shift towards more
environmentally benign energy technologies, including a significant role for
clean fossil, renewables, and nuclear energy. The other two lead to a higher
dependence on carbon-intensive fossil fuels, resulting in high energy-related
emissions - and so are unsustainable.
Case C includes two ecologically driven scenarios with high
growth in developing countries (towards being rich and ‘green’). One
of them, C1, assumes a global phaseout of nuclear energy by 2100. The other, C2,
does not. Both assume that carbon and energy taxes will be introduced to promote
renewables and end-use efficiency improvements - rather than to reduce other
taxes in industrialised regions.
The considerable differences in expected total energy
consumption among the scenarios reflect varying approaches to addressing the
need for energy services in the future and demonstrate that policy matters.
Increases in research, development, and deployment efforts for new energy
technologies are a prerequisite for the achievement of the three scenarios that
have characteristics of sustainable development. Significant technological
advances will be required, as well as incremental improvements in conventional
energy technologies. In general, scenarios A3, C1, and C2 require significant
policy and behavioural changes in the next few decades to achieve more
sustainable development paths. Taken together, these changes, which are
described in more detail in part 4 (chapters 11 and 12), represent a clear
departure from a business-as-usual approach.
Another crucial prerequisite for achieving sustainability in
the scenarios is near-universal access to adequate and affordable energy
services and more equitable allocation of resources. Finally, environmental
protection - from indoor pollution to climate change - is an essential
characteristic of sustainable development in the scenarios. The resolution of
these future challenges offers a window of opportunity between now and 2020.
Because of the long lifetimes of power plants, refineries, and other
energy-related infrastructure investments, there will not be sufficient turnover
of such facilities to reveal large differences among the alternative scenarios
presented here before 2020. But the seeds of the post-2020 world will have been
sown by then. Although choices about the world’s future energy systems are
now relatively wide open, they will narrow by 2020, and development
opportunities, such as achieving sustainability, might not be achievable later
if forgone today. |
Sustainable development has become a synonym for desirable
transitions into the new millennium. This is often reflected in energy scenarios
that consider conditions for achieving sustainable development. Because energy
systems change slowly, energy scenarios have long time horizons - often
extending more than 100 years into the future. These long time periods are
needed to formulate transitions to sustainable development paths. And because
energy is also an important prerequisite for sustainability, there is a large
body of literature on energy scenarios that describe sustainable development
paths.
This chapter assesses that literature and summarises the main
driving forces of future energy developments and their implications. The
objective of the chapter is to link - through global scenarios - the energy
options presented in part 2 (chapters 5-8) with the salient energy issues
presented in part 1 (chapters 1-4), thereby illustrating the conditions for
sustainable futures. Three global scenarios (A3, C1, and C2) are considered that
to varying degrees lead towards sustainability. All of them require polices and
measures in the near future to accomplish the envisaged transition, and none is
compatible with current trends. They are compared with a third reference
scenario (B) that also outlines positive future developments but lacks many of
the characteristics of sustainability. This scenario is more consistent with
current developments and trends. These three scenarios have been developed
jointly by the International Institute for Applied Systems Analysis (IIASA) and
the World Energy Council (WEC) and are presented here to represent a wider
literature on reference and sustainable development scenarios (IIASA-WEC, 1995;
Morita and Lee, 1998; Nakicenovic, Gr�bler, and McDonald, 1998; Nakicenovic,
Victor, and Morita,
1998).
What are scenarios and how are they used for energy assessments?
Scenarios are images of alternative futures. Scenarios are
neither predictions nor forecasts. Each scenario can be interpreted as one
particular image of how the future could unfold. Scenarios are useful tools for
investigating alternative future developments and their implications, for
learning about the behaviour of complex systems, and for policy-making.
Energy systems are complex, their behaviour may be uncertain and
is not always well understood, and information on them is often incomplete.
Frequently scenarios are the best tool for understanding alternative energy
developments and their implications. In scientific energy assessments, scenarios
are usually based on an internally consistent, reproducible set of assumptions
or theories about the key relationships and driving forces of change, which are
derived from our understanding of both history and the current situation. Often
such energy scenarios are formulated with the help of formal models. More than
400 quantitative energy scenarios are documented in the database developed by
Morita and Lee (1998).
Formal models cannot, however, capture all aspects of energy
systems. Some aspects of energy perspectives can only be appreciated through
intuition and are best communicated by images and stories. Thus scenarios are
sometimes less quantitative and more descriptive, and in a few cases do not
involve any formal analysis and are expressed in qualitative terms. Energy
scenarios can also involve components of both; they sometimes have a narrative
part, often called a “storyline”, and a number of corresponding
quantitative scenarios for each storyline. Some scenarios are primarily
narrative and qualitative, even if actual numbers are used for illustrative
purposes. This is often the case with energy scenarios that prescribe the
achievement of sustainability and thus make particularly strong assumptions
about the future.
|
Each scenario
can be interpreted as
one particular
image
of how the future
could unfold. |
Scenarios are not value free, and can often be divided into two
broad groups: descriptive and normative. Descriptive scenarios are evolutionary
and open-ended, and explore paths into the future without any preconceived
endpoint. Normative (or prescriptive) scenarios are explicitly values-based and
teleological, and explore the routes to desired or undesired endpoints (utopias
or dystopias). The distinction between the two groups is not always clear
(Nakicenovic and others, 2000). For instance, two of the three scenarios from
the International Institute for Applied Systems Analysis and World Energy
Council (IIASA-WEC) that are considered here describe how many conditions of
sustainability could be achieved by the end of the 21st century but also contain
many normative elements that illustrate polices and measures that would be
required to change current
trends.
Alternative development paths and how they are reflected in scenarios
The starting point for any analysis of energy development is a
prospective look into the future. Because it is impossible to predict future
energy developments, an important purpose of alternative energy scenarios is to
analyse possible global and regional developments for periods of a century or
more so that their implications for sustainable development can be assessed. For
now, these long-term energy scenarios are the best way to integrate demographic,
economic, societal, and technological knowledge with our understanding of
ecological systems and environmental implications. As an integration tool,
scenarios also allow a role for intuition, analysis, and synthesis. By
developing scenarios, researchers can analyse future determinants of energy
requirements and compare them to supply availabilities, financing, environmental
constraints, and other salient factors and driving forces. Long-term scenarios
can provide a framework for a ‘retrospective view from the future’ and
for assessing near-term measures to achieve sustainable and other desirable
development paths.
The traditional method of formulating scenarios first involves
developing a ‘business-as-usual’ baseline that essentially assumes
that things will not change in the future; then ‘policy’ cases
starting from the baseline are developed. But it is becoming increasingly
evident that it is next to impossible to formulate future developments that do
not include any change in comparison with today; namely, futures that capture
the business-as-usual course of events. In fact, even though energy futures are
unpredictable, one thing that appears almost certain is that the future will be
different from today. In addition, it is virtually impossible to imagine future
developments that can avoid changes. Within a century, for example, two
technological discontinuities could occur, along with a major shift in societal
values and perhaps a change in the balance of geopolitical power. Thus there is
a growing literature on alternative scenarios that map a wide range of future
possibilities. The hope is that, by mapping alternative development scenarios,
it will be possible to identify a wider range of differing courses of action.
These alternative scenarios are tools for capturing different relationships and
the evolution of factors that determine future energy trajectories and spatial
patterns.
It is important to realise that such approaches depend on
assessments of the driving forces of energy futures and the relationships among
them, ranging from population developments to technological change. Usually a
very small subset of alternative scenarios can be identified that will lead to
sustainability. The driving forces in these scenarios must be consistent with
the concept of sustainability. For example, such scenarios should not have
dangerously high environmental impacts or inequitable resource allocation.
Such approaches also allow for the unfolding of different
futures. Differing scenarios, while sharing similar outcomes, might have varying
mixes of the same characteristics. For example, different economic development
paths might lead to similar global energy requirements by the middle of the 21st
century. A world with high population and relatively low levels of development
might have almost the same total energy needs as a world with low population and
high levels of affluence. But the latter clearly would offer more possible
choices for achieving
sustainability.
Energy scenarios for sustainable development
To assess what kinds of development will ultimately be
sustainable, one must have a global perspective and a very long time horizon
covering periods of at least a century. Chapters 1-4 amply illustrate that
access to affordable energy services is a crucial prerequisite for sustainable
development. At the same time, energy use is also a main cause of environmental
degradation at all scales and thus can impede achieving sustainability. (Often a
higher degree of equity in the world is also included in the concept of
sustainable development.)
Sustainable development is an elusive concept. It is often
easier to define those development paths that are not sustainable than those
that are. In many ways, this is the advantage of the concept. It has sufficient
clarity to identify which development paths do not lead to a sustainable future,
and it offers flexibility while being prescriptive. Sustainable energy scenarios
are often designed to offer policy guidance on managing, for example, an orderly
transition from today’s energy system, which relies largely on fossil
fuels, towards an energy system more compatible with sustainable development in
all its dimensions (Goldemberg and others, 1988).1
|
Sustainable futures
usually are not considered
to be
achievable with current
policies and prevailing
development trends. |
All sustainable futures are in some sense positive and have some
normative elements. In all of them the world develops equitably with relatively
low environmental impacts. Sustainable energy scenarios sometimes include strong
assumptions about desirable futures; because they prescribe how such futures can
be achieved, they are normative. In such normative approaches, sustainable
futures usually are not considered to be achievable with current policies and
prevailing development trends, but rather often depend on a fundamental change
or a major paradigm
shift.
Brief review of the literature on energy scenarios
The construction of scenarios to investigate alternative future
developments under a set of assumed conditions dates far back in history.
Scenarios were and continue to be one of the main tools for dealing with the
complexity and uncertainty of future challenges.
The first scenarios were probably used to plan military
operations. Scenarios now are being increasingly used in business enterprises
and for many other commercial purposes. Perhaps most famous in the literature is
the use of scenarios by the Shell Group in the wake of the so-called oil crisis
to plan its corporate response strategies (Schwartz, 1991). Today scenarios are
quite widespread and are found in all kinds of enterprises around the world.
Many are quantitative; this is often the case for enterprises in the energy
sector. Some of them also include considerations of sustainability. Recently the
World Business Council for Sustainable Development presented a set of scenarios
that was developed in collaboration with 35 major corporations (WBCSD, 1998).
During the past 30 years a number of global studies have used
scenarios as a tool to assess future paths of energy system development. One of
the first global studies to employ scenarios for this purpose was conducted by
IIASA during the late 1970s (H�fele, 1981). Another influential series of
scenarios that included the assessment of sustainable development was formulated
by the World Energy Council (WEC, 1993). The Intergovernmental Panel on Climate
Change (IPCC) has used scenarios since its inception to assess greenhouse gas
emissions and climate change. In 1992 it developed a set of very influential
scenarios that gave a detailed treatment of energy sector developments. The set
includes six scenarios called IS92, three of which describe futures that include
characteristics of sustainable development (Pepper and others, 1992; Leggett,
Pepper, and Swart, 1992).
A growing number of global studies consider futures with radical
policy and behavioural changes to achieve sustainable development (Goldemberg
and others, 1988). One of the first global scenarios to focus on achieving
sustainable development was formulated by Greenpeace (Lazarus and others, 1993).
Another among the first global energy scenarios with characteristics of
sustainable development describes a transition to renewable energy futures
(Johansson and others, 1993). In its second assessment report, the IPCC also
considered a range of global energy scenarios, based on some elements of the
IS92 set, with varying degrees of sustainability (Ishitani and others, 1996).
In more recent studies, sustainable development scenarios are
usually included among other alternative futures. This class of sustainable
scenarios can be characterised by low environmental impacts at all scales and
more equitable allocation of resources and wealth relative to current
situations. Recently the Global Scenario Group presented a set of three
scenarios that received considerable attention (Raskin and others, 1998). These
scenarios were based on elaborate narratives describing alternative futures,
including some that are decisively sustainable. The set of scenarios developed
by the WBCSD also includes narratives and describes alternative development
paths, some of which include strong emphasis on sustainable development (WBCSD,
1998).
There is also a large literature of global energy scenarios that
serve as a reference for showing that, under business-as-usual conditions, many
of the developments crucial for the achievement of sustainability would not be
realised. For example, the World Energy Outlook, regularly published by
the International Energy Agency (IEA, 1998), is very influential. Many of these
global energy scenarios are limited to developments during the next 20-30 years
and do not go far enough into the future to assess all crucial aspects of
sustainable development, such as climate change. But they often are very
relevant to issues such as the conditions for meeting the carbon emissions
targets specified in the Kyoto Protocol under the United Nations Framework
Convention on Climate Change (UNFCCC, 1992).
The literature on sustainable energy scenarios is large, and
this brief review cannot give a comprehensive account. The IPCC has developed a
database that includes a number of global energy scenarios that can be
characterised as describing sustainable development (Morita and Lee, 1998). This
database, which includes more than 400 global and regional scenarios,
illustrates that the literature is quite rich; thus not all scenarios can be
described in this chapter. (In the following sections dealing with such scenario
driving forces as economic development, some of the comparisons use scenarios
from the database.)
The IPCC, in its recent Special Report on Emissions
Scenarios, considers 40 scenarios that include a large number of sustainable
futures (Nakicenovic and others, 2000). This set of scenarios is unique in a
number of respects - it was developed using six different models, it covers a
wide range of alternative futures based on the scenarios in the literature, it
includes narrative descriptions of alternative futures, and it has been reviewed
extensively.
Here some of the conditions for achieving a transition towards
sustainable development will be illustrated with the three scenarios developed
by IIASA and WEC. These will then be contrasted to a reference case that
captures many positive future developments but cannot be characterised as
leading to sustainability. These scenarios cover a wide range of possible future
developments and are representative of the scenario literature. Where
appropriate, other scenarios will be drawn upon to illustrate the conditions and
implications of sustainable
development.
Three energy scenarios for the 21st century
IIASA and WEC undertook a five-year joint study published as
Global Energy Perspectives (Nakicenovic, Gr�bler, and McDonald, 1998).
The objectives of the study were to integrate near-term strategies through 2020
with long-term opportunities to 2100; analyse alternative future developments;
ensure consistency and reproducibility with a unified methodological framework
using formal models and databases; incorporate a dynamic treatment of
technological change; and harmonise regional aspirations with global
possibilities. The study centres on three cases of future social, economic, and
technological development for 11 world regions.
The three cases unfold into six scenarios of energy system
alternatives. Together they span a wider range of alternative future
developments and driving forces. The three cases are designated as A, B, and C.
Case A includes three variant scenarios and reflects a high-growth future of
vigorous economic development and rapid technological improvements. One of its
variants (A3) includes many characteristics of sustainable and equitable
development. Case B represents a middle course, with intermediate economic
growth and more modest technological improvements. Case C is ecologically driven
(with two variants: C1, with new renewables and a phaseout of nuclear energy by
2100; and C2, with renewables and new nuclear); it incorporates challenging
environmental and energy taxes to simultaneously protect the environment and
transfer wealth from North to South to enhance economic equity. This approach
leads to lower energy use but high overall growth, especially in the South. Case
C illustrates most vividly the conditions for achieving a high degree of
sustainability and equity in the world. Table 9.1 gives an overview of the three
cases and their six scenarios of energy development. Full documentation is
available in the published study report (Nakicenovic, Gr�bler, and McDonald,
1998) and at the study Website
(https://www.iiasa.ac.at/cgi-bin/ecs/book_dyn/bookcnt.py).
These scenarios received a wide review that included about 100
leading energy experts. They incorporate both a top-down approach based on an
integrated set of energy, economic, and environmental models to initially
develop the set of scenarios, and a bottom-up evaluation of the regional
perspectives provided by the 11 review groups. This set of scenarios will be
used to illustrate to what extent the concepts of sustainable development are
captured across the scenarios. They have been chosen because they cover a wide
range of alternative future developments and are quite representative of the
recent scenario literature. Again, where appropriate, reference will be given to
other scenarios from the literature.
Three of the six scenarios will be used to illustrate
alternative conditions for achieving transitions of energy systems towards
sustainability. Table 9.2 provides a number of indicators that may be used to
characterise the achievement of sustainable development in energy scenarios and
shows how the three scenarios selected for this assessment fare in comparison
with each other. The middle-course scenario (B) was chosen to serve as a
reference baseline because it was designed to represent a future characterised
by incremental and gradual changes. In fact, this scenario would represent a
major improvement in the global energy system and its use, but it does fall
short of fulfilling many indicators of the sustainability suggested in table
9.2. The other two scenarios shown in table 9.2 (A3 and C1) describe futures
that include characteristics of sustainability. The third scenario (C2), which
can also be characterised along the same lines, includes continuous reliance on
nuclear energy, in contrast to the other ecologically driven scenario, which has
a global nuclear phaseout by 2100 (C1). Neither the A3 nor the C1 scenario,
however, is compatible with current trends and developments, so both would
require new policy initiatives and measures directed towards achieving
sustainable development. Even so, neither of the scenarios ranks very high on
all 13 indicators of sustainability considered in table 9.2. At the same time,
table 9.2 indicates that, among the spectrum of energy futures considered here,
C1 represents the energy future that is the most compatible with sustainable
development.
TABLE 9.1. SUMMARY OF THREE ENERGY DEVELOPMENT CASES IN
2050 AND 2100 COMPARED WITH 1990
|
|
Case A
High growth |
Case B
Middle growth |
Case C
Ecologically driven |
|
Population (billions) |
1990 |
5.3 |
5.3 |
5.3 |
|
2050 |
10.1 |
10.1 |
10.1 |
|
2100 |
11.7 |
11.7 |
11.7 |
|
Gross world product (trillions of 1990 dollars) |
1990 |
20 |
20 |
20 |
|
2050 |
100 |
75 |
75 |
|
2100 |
300 |
200 |
220 |
|
Gross world product (annual percentage change) |
1990-2050 |
High |
Medium |
Medium |
|
1990-2100 |
2.7 |
2.2 |
2.2 |
|
|
2.5 |
2.1 |
2.2 |
|
Primary energy intensity (megajoules per 1990 dollar of gross
world product) |
1990 |
19.0 |
19.0 |
19.0 |
|
2050 |
10.4 |
11.2 |
8.0 |
|
2100 |
6.1 |
7.3 |
4.0 |
|
Primary energy intensity improvement rate (annual percentage
change) |
1990-2050 |
Medium |
Low |
High |
|
1990-2100 |
-0.9 |
-0.8 |
-1.4 |
|
|
-1.0 |
-0.8 |
-1.4 |
|
Primary energy consumption (exajoules) |
1990 |
379 |
379 |
379 |
|
2050 |
1,041 |
837 |
601 |
|
2100 |
1,859 |
1,464 |
880 |
|
Cumulative primary energy consumption, 1990-2100 (thousands
of exajoules) |
Coal |
8.9 - 30.7 |
17.5 |
7.1 - 7.2 |
|
Oil |
27.6 - 15.7 |
15.3 |
10.9 |
|
Natural gas |
18.4 - 28.7 |
15.8 |
12.2 - 12.9 |
|
Nuclear energy |
6.2 - 11.2 |
10.5 |
2.1 - 6.2 |
|
Hydropower |
3.7 - 4.2 |
3.6 |
3.6 - 4.0 |
|
Biomass |
7.4 -14.3 |
8.3 |
9.1 -10.1 |
|
Solar energy |
1.8 - 7.7 |
1.9 |
6.3 - 7.4 |
|
Other |
3.0 - 4.7 |
4.3 |
1.4 - 2.2 |
|
Global total |
94.0 - 94.9 |
77.2 |
56.9 |
|
Energy technology cost reductions (through learning)
|
Fossil |
High |
Medium |
Low |
|
Non-fossil |
High |
Medium |
High |
|
Energy technology diffusion rates |
Fossil |
High |
Medium |
Medium |
|
Non-fossil |
High |
Medium |
High |
|
Environmental taxes (excluding carbon dioxide taxes)
|
|
No |
No |
Yes |
|
Sulphur dioxide emissions (millions of tonnes of sulphur)
|
1990 |
58.6 |
58.6 |
58.6 |
|
2050 |
44.8 - 64.2 |
54.9 |
22.1 |
|
2100 |
9.3 - 55.4 |
58.3 |
7.1 |
|
Carbon dioxide emission constraints and taxes |
|
No |
No |
Yes |
|
Net carbon dioxide emissions (gigatonnes of carbon) |
1990 |
6 |
6 |
6 |
|
2050 |
9 - 15 |
10 |
5 |
|
2100 |
6 - 20 |
11 |
2 |
|
Cumulative carbon dioxide emissions (gigatonnes of
carbon) |
1990-2100 |
910 - 1,450 |
1,000 |
540 |
|
Carbon dioxide concentrations (parts per million by
volume) |
1990 |
358 |
358 |
358 |
|
2050 |
460 - 510 |
470 |
430 |
|
2100 |
530 - 730 |
590 |
430 |
|
Carbon intensity (grams of carbon per 1990 dollar of gross
world product) |
1990 |
280 |
280 |
280 |
|
2050 |
90 - 140 |
130 |
70 |
|
2100 |
20 - 60 |
60 |
10 |
|
Investments in energy supply sector (trillions of 1990
dollars) |
1990-2020 |
15.7 |
12.4 |
9.4 |
|
2020-50 |
24.7 |
22.3 |
14.1 |
|
2050-2100 |
93.7 |
82.3 |
43.3 |
|
Number of scenarios |
|
3 |
1 |
2 |
The three cases unfold into six scenarios of
energy system alternatives: three case A scenarios (A1, ample oil and gas; A2,
return to coal; and A3, non-fossil future), a single case B scenario (middle
course), and two case C scenarios (C1, new renewables; and C2, renewables and
new nuclear). Some of the scenario characteristics, such as cumulative energy
consumption, cumulative carbon dioxide emissions, and decarbonisation, are shown
as ranges for the three case A and two C scenarios.
Source: Nakicenovic, Gr�bler, and McDonald,
1998.
Scenario A3 envisions a future with impressive technological
improvements and subsequent high degrees of economic development, a structural
shift first towards natural gas and then towards renewable and nuclear energy
options, and very high levels of energy efficiency. Environmental impacts are
therefore quite low in this future. Equity is achieved through rapid
development, with today’s developing regions achieving a high level of
affluence by the end of the 21st century. The development gap narrows,
increasing equity in the world. This scenario also includes characteristics of
sustainability. This is achieved primarily through vigorous development (without
active redistribution of income). Rapid technological and economic development
allows access to an ever-expanding resource base with decreasing energy and
material intensities, and a radical decline in adverse environmental impacts.
However, it requires a paradigm shift and a host of new policies.
The ecologically driven case C scenario presents a rich and
‘green’ future and represents a fundamentally different development
path. It includes both substantial technological progress and unprecedented
international cooperation centred explicitly on environmental protection and
international equity - it includes a high degree of environmental protection at
all scales, from indoor air pollution to climate, with active redistribution of
wealth and very high levels of energy efficiency and conservation. It fulfils
most of the other criteria associated with sustainable development (see table
9.2), such as increasing equity, both in an economic and ecological sense, among
regions and countries. Thus it can be considered to lead to sustainable
development. For example, it incorporates a challenging, broad portfolio of
environmental control technologies and policies, such as emissions standards and
caps, incentives to encourage energy producers and consumers to use energy more
efficiently and carefully, ‘green’ taxes (levied on energy and
carbon), international environmental and economic agreements, and technology
transfer.
TABLE 9.2. CHARACTERISTICS OF SUSTAINABILITY IN THREE
ENERGY DEVELOPMENT SCENARIOS IN 2050 AND 2100 COMPARED WITH 1990
|
Indicator of sustainability |
1990 |
Scenario A3 |
Scenario B |
Scenario C1 |
|
Eradicating poverty |
Low |
Very high |
Medium |
Very high |
|
Reducing relative income gaps |
Low |
High |
Medium |
Very high |
|
Providing universal access to energy |
Low |
Very high |
High |
Very high |
|
Increasing affordability of energy |
Low |
High |
Medium |
Very high |
|
Reducing adverse health impacts |
Medium |
Very high |
High |
Very high |
|
Reducing air pollution |
Medium |
Very high |
High |
Very high |
|
Limiting long-lived radionuclides |
Medium |
Very low |
Very low |
High |
|
Limiting toxic materialsa |
Medium |
High |
Low |
High |
|
Limiting GHG emissions |
Low |
High |
Low |
Very high |
|
Raising indigenous energy use |
Medium |
High |
Low |
Very high |
|
Improving supply efficiency |
Medium |
Very high |
High |
Very high |
|
Increasing end-use efficiency |
Low |
High |
Medium |
Very high |
|
Accelerating technology diffusion |
Low |
Very high |
Medium |
Medium |
a. For this row only, the qualitative indicators are
not based on quantitative features of the scenarios, but were specified by the
authors on the basis of additional assumptions.
The case C scenario also reflects substantial resource transfers
from industrialised to developing countries to spur growth and eradicate
poverty. These transfers include stringent international environmental taxes and
incentives, which recycle funds from industrialised countries (members of the
Organisation for Economic Co-operation and Development, or OECD) to developing
countries. Specifically, it is assumed that energy and carbon taxes are applied
universally, albeit at different rates and timing, and that the tax revenues are
used to promote development. In the scenario, this means that the proceeds from
these taxes in OECD countries are recycled as resource transfers to developing
countries and are earmarked for the development of energy infrastructure, clean
technologies, efficiency, and conservation. Because this scenario requires a
fundamental paradigm shift from current socioeconomic, technological, and
environmental development trends, new policies would be required to achieve the
future it describes. Thus the transition towards more sustainable development
paths in both cases C and A3 would require a host of new policies to promote the
diffusion of advanced technologies, reliable and affordable access to energy for
all, free trade, vigorous economic growth, and reduced emissions at all scales.
These findings are consistent with chapter 12, where it is stated that new
policies would be required to achieve more sustainable development.
The three cases have a number of common features. All provide
for substantial social and economic development, particularly in the developing
world, and all give much wider access to reliable, affordable energy throughout
the world. During the 21st century, as affluence increases throughout the world,
the current distinction between developing and industrialised regions will
become less and less appropriate in the scenarios considered here. All the
scenarios provide for improved energy efficiencies and environmental
compatibility, and hence for associated growth in both the quantity and quality
of energy services.
|
BOX 9.1. DEMOGRAPHIC TRANSITION AND POPULATION GROWTH
Population is one of the driving forces of future energy
requirements. Today there are three main sources of global population
projections: the United Nations (UN, 1998), World Bank (Bos and Vu, 1994), and
IIASA (Lutz, Sanderson, and Scherbov, 1997).
Most central population projections lead to a doubling of global
population by 2100, to about 10 billion, compared with 5.3 billion in 1990. In
recent years the central population projections for 2100 have declined somewhat
but are still in line with a doubling by 2100. For example, the latest UN (1998)
medium-low and medium-high projections indicate a range of between 7.2 and 14.6
billion people by 2100, with the medium scenario at 10.4 billion. The IIASA
central estimate for 2100 is also 10.4 billion, with 95 percent probability that
world population would exceed 6 billion and be lower than 17 billion (Lutz,
Sanderson, and Scherbov, 1997).
Thus the population assumptions in the IIASA-WEC scenarios are
higher (11.7 billion in comparison with 10.4 billion) but still consistent with
recent population projections (see figure 9.3). It should be noted that the
population projections used in most scenarios that describe sustainable
development paths appear to have the same range as for all other scenarios in
the literature. This implies that population policies are apparently not
considered appropriate for achieving sustainability, nor is energy seen as an
appropriate instrument for achieving the population transition, at least across
most of the scenarios in the literature (see chapter 2). |
The task is indeed daunting. Nearly 2 billion people, or a third
of the world’s population, lack access to adequate, affordable, clean, and
convenient energy services such as electricity (chapter 2). The current
disparities in energy use mirror the disparities in access to affordable energy
services and in the distribution of wealth - the richest 20 percent of the
world’s population uses 55 percent of final, primary energy, while the
poorest 20 percent uses only 5 percent. Exclusion from modern energy services is
generally associated with poverty and environmental degradation.
Although it is true that about two-thirds of the global
population, or about 4 billion people, are now connected to electricity and that
great progress has been achieved, the challenge ahead is formidable; a simple
calculation illustrates its magnitude. In addition to the 2 billion people today
who still need to be connected to energy distribution or decentralised systems
and endowed with sufficient purchasing power to be able to afford modern energy
services, two to three times as many people are likely to be added to the global
population during the new century. This means that 6-8 billion people would need
to be provided with the access to affordable, clean, flexible, and convenient
energy services during the 21st century, a number larger than the current world
population. All scenarios considered here achieve this transition - to a varying
extent and through different energy system developments. Some of them do so
while fulfilling some of the criteria of sustainable development as well (see
the conclusion to this chapter).
In all three cases the structure of final energy develops
towards greater flexibility, quality, and environmental compatibility, and
energy intensities improve steadily. To facilitate comparisons among the three
cases, all share the same central demographic baseline assumption, in which
global population grows to 10 billion people by 2050 and to nearly 11.7 billion
by 2100. This is higher than the current medium projections of about 10.4
billion in 2100 by the World Bank, United Nations, and IIASA (box 9.1). This
means that 6-8 billion additional people would achieve access to adequate energy
services in all three
cases.
Economic development and equity
Economic development and growth are fundamental prerequisites
for achieving an increase in living standards and equity in the world. It is
therefore not surprising that assumptions about economic development are among
the most important determinants of energy scenarios. At the same time, economic
growth prospects are among the most uncertain determinants of scenarios.
Economic and social development has many dimensions, and a
number of indicators have been devised to assess progress and setbacks in human
development. The United Nations Development Programme defines development as the
furthering of human choices (UNDP, 1997). Arguably, choices are only possible
once basic human needs for food, shelter, health care, and education have been
met. Eradication of poverty is essential for achieving sustainability and human
development in general. Beyond the satisfaction of basic needs, the issue of
what constitutes development involves many cultural, social, and economic
factors that inherently involve questions of values, preferences, and policies.
Income is not an end in itself, but rather a means of enabling
human choices - or foreclosing them, in the case of poverty. Therefore per
capita income (usually measured by per capita GDP) has been widely used to
indicate the degree of economic development. In many instances this is closely
correlated (as lead or lag indicator) with other indicators and dimensions of
social development, such as mortality, nutrition, and access to basic services.
Although future rates of economic development are highly
uncertain, in all three cases of economic development considered in the
IIASA-WEC study, future economic and energy markets move to today’s
developing countries. The rate and timing of this transition varies across the
three cases, but the overall direction of change is the same. Along with
population growth, the economic catch-up of developing to industrialised
countries implies a long-term shift in the geographic focus of economic
activities.
Currently the situation is fundamentally different. OECD
countries produce and consume close to 80 percent of global economic output
(measured by gross world product), while they account for less than 20 percent
of global population. These disparities are illustrated in figure 9.1, which
shows the size of 11 world regions in proportion to their 1990 GDP (at market
exchange rates and 1990 prices). In 1990 the economic map of the world was very
different from geographic maps (Mercartor projections) - it was highly distorted
as a result of disparities among regions. Most developing regions were barely
discernible relative to Japan, Western Europe, and North America. In figure 9.1,
for example, compare the size of Japan in 1990 with that of China or the Indian
subcontinent.
For 2050 and 2100, the economic maps shown in figure 9.1
correspond to case B, the middle-course scenario of the IIASA-WEC study that is
the most cautious with respect to the speed of the developing world’s
economic catch-up. Nonetheless, over the long term economic maps begin to
resemble the geographic maps with which all of us are familiar. This means two
things. First, economic catch-up, even in relative terms, is a century-long
process and one of the greatest human challenges. Some regions may forge ahead,
but in the aggregate developing countries will require more than 50 years to
approach the income levels that OECD countries had in the 1960s or 1970s.
Second, with long-term development and catch-up (in relative but not absolute
terms), economic, as well as energy market, growth will be primarily in the
developing world.
In figure 9.1, between 1990 and 2100 the world economy increases
in size 10 times, from $20 trillion to $200 trillion (1990 dollars; or $24
trillion to $240 trillion in 1998 dollars). This leads to more equitable
distribution of economic activities geographically, but the gap in per capita
income remains very large. Therefore, in this scenario, in many parts of the
world local difficulties will persist and, despite rapid economic development,
adequate energy services may not be available to every citizen even 100 years
from now. Higher rates of economic development are required to narrow the gap
more substantially.
|
The richest 20 percent of the
world’s population uses
55 percent
of final, primary energy, while
the poorest 20 percent
uses
only 5 percent. |
This is illustrated in table 9.3, which compares per capita
income for the three cases (A, B, and C) for the 11 world regions. Cases A and C
include the three more sustainable scenarios (A3, C1, and C2). The table shows
that in case B only half of today’s developing regions will achieve the
1990 income levels of OECD countries by 2100, whereas this is the case for most
of the regions in the other three scenarios (A3, C1, and C2). The attainment of
this higher degree of economic catch-up is, however, fundamentally different for
the three more sustainable scenarios. In A3 this is achieved primarily through
economic growth that results from liberalised markets, free trade, and high
investment rates, whereas in C1 and C2 it is achieved through a substantial
redistribution of wealth (from industrialised to developing countries and
possibly from rich to poor) with a strong focus on maintaining environmental
enmities. All three futures are more equitable than reference case B, leading to
much higher economic development in the world. Gross world product increases by
a factor of 11-15 in A3, C1, and C2, to $220-300 trillion (1990 dollars;
$270-370 trillion in 1998 dollars) by 2100.
A comparison of these three cases of economic development shows
considerable uncertainty about future per capita GDP growth rates and about the
effectiveness of different policy measures in reducing the relative income gap
between today’s industrialised and developing countries. The range across
the scenarios is consistent with earlier reviews of economic growth assumptions
for long-term scenarios by Nordhaus and Yohe (1983), Gr�bler (1994), Manne and
Richels (1994), and Alcamo and others (1995). For instance, in the scenarios
reviewed in Alcamo and others (1995), and Gr�bler (1994), per capita annual GDP
growth rates typically are 1-3 percent for 1990-2100. On the basis of an average
per capita income of $4,000 in 1990, global per capita GDP could range from
$10,000-100,000 by 2100. Such uncertainties become amplified by regional
disparities, in particular future productivity growth in developing countries.
The great inherent uncertainty of future economic development
prospects is reflected in the wide range of economic development paths assumed
in the scenarios from the literature. The further one looks into the future, the
higher is the uncertainty. By 2100 the range is between 3 (IS92c scenario,
Pepper and others, 1992) and 30 times (FUND/EMF, modeller’s choice
scenario, Tol, 1995) the 1990 level (Nakicenovic, Victor, and Morita, 1998).
Thus the scenarios give a range of $60-$700 trillion, with a median of $240
trillion (1990 dollars; $290 trillion in 1998 dollars). These figures translate
into an annual growth rate variation of 1.1-3.2 percent, and a median growth
rate of 2.1 percent. Future economic growth rates therefore are generally
assumed to be lower than those of historical experience.
FIGURE 9.1. THE CHANGING GEOGRAPHY OF ECONOMIC WEALTH FOR
THE MIDDLE-COURSE (CASE B) SCENARIO IN 2050 AND 2100 RELATIVE TO 1990
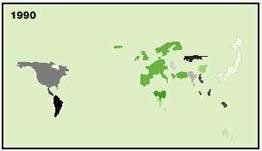
Figure
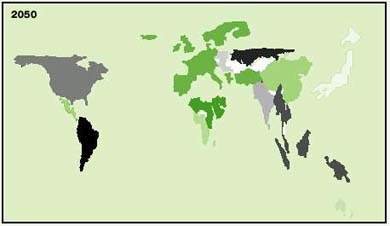
Figure
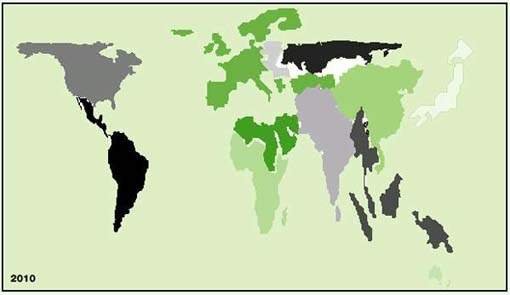
Figure
The areas of world regions are proportional to
their 1990 levels of GDP, expressed at 1990 market exchange rates.
Source: Nakicenovic, Gr�bler, and McDonald,
1998.
It is important to note that by 2100 the global scenarios that
represent sustainable development are mostly above the median of about $240
trillion (1990 dollars). Assuming a central population projection of 10 billion
people by 2100, the median growth path translates into about $24,000 (1990
dollars; $29,000 in 1998 dollars) average per capita gross world product, or
roughly the current per capita income level in more affluent industrialised
countries. Thus economic growth rates are high for the scenarios that achieve
sustainability, indicating that economic development is a prerequisite for both
higher equity and lower environmental impacts. This tendency is also reflected
in the three more sustainable scenarios in the IIASA-WEC study relative to the
reference
case.
Improvement of energy intensities
In all three cases economic development outpaces the increase in
energy, leading to substantially reduced energy intensities. As technologies
progress, and as inefficient technologies are replaced by more efficient ones,
the amount of primary energy needed per unit of GDP - the energy intensity -
decreases. In some developing regions the intensity of commercial energy
initially increases as traditional, less efficient forms are replaced by
commercial energy, but total energy intensity decreases in these cases as well.
All other factors being equal, the faster economic growth, the higher the
turnover of capital and the greater the increase in energy intensity.
In the scenarios, improvements in individual technologies were
varied across a range derived from historical trends and literature on future
technology characteristics. When combined with the economic growth patterns of
the different scenarios, the average annual overall global reduction in energy
intensity varies from about 0.8 percent, in line with historical experience, to
1.4 percent. These figures bracket the long-term average annual rate for
industrialised countries during the past 100 years of about 1 percent, and
cumulatively lead to substantial energy intensity decreases across all scenarios
(figure 4 in the overview). Efficiency improvements are significantly higher in
some regions, especially for shorter periods of time.
These differences in global developments across the scenarios
are reflected in even larger regional variations. The East Asian
‘miracle’ of double-digit average growth during the early 1990s has
been interrupted recently, but prospects for continued sound growth are good for
the coming decades. The transition economies of Central Asia, the Russian
Federation, and Eastern Europe have undergone a period of profound change and
reform, reflected in a deep recession and economic decline during the 1990s. The
prosperous economies of Western Europe have focused on reducing the high
unemployment that accompanied low growth rates.
The IIASA-WEC scenarios start in the base year 1990 and were
developed between 1992 and 1998, so that the actual trends of past years can be
compared with initial developments in the long-term scenarios. Figure 9.2 shows
the energy intensity improvement rates for six regions for the three cases of
economic development relative to historical trends (figure 4 in the overview).
They range from vigorous reduction of about 4 percent a year for China and other
centrally planned economies in Asia to a (temporary) increase in energy
intensities in the transition economies of Eastern Europe, Central Asia, and the
former Soviet Union. The scenario trajectories provide an excellent anticipation
of short-term developments during the 1990s, especially for the transition
economies. All scenarios assume that the next few decades will be characterised
by successful reform and restructuring in all transition economies, leading to
sustained investment in the energy sector and economic development that will be
reflected in long-term increases in energy intensities.
In addition to the energy intensity improvements, rates of
technological change and available energy resources also vary consistently
across the scenarios. For example, high rates of economic growth are associated
with rapid technological advance, ample resource availability, and high rates of
energy intensity increase. Conversely low rates of economic growth result in a
more limited expansion of energy resources, lower rates of technological
innovation in general, and lower rates of decrease in energy intensities.
TABLE 9.3 PER CAPITA GDP FOR THE 11 WORLD REGIONS IN 1990
AND IN THE THREE IIASA-WEC CASES IN 2050 AND 2100 (THOUSANDS OF 1990 DOLLARS,
MEASURED AT MARKET EXCHANGE RATES)
|
Region |
1990 |
2050 |
2100 |
|
|
A |
B |
C |
A |
B |
C |
|
Sub-Saharan Africa |
0.5 |
1.6 |
1.0 |
1.2 |
11.0 |
6.3 |
11.4 |
|
Centrally planned Asia and China |
0.4 |
7.0 |
3.4 |
5.4 |
21.2 |
12.8 |
15.4 |
|
Central and Eastern Europe |
2.4 |
16.3 |
7.8 |
8.0 |
52.7 |
29.0 |
21.8 |
|
Former Soviet Union |
2.7 |
14.1 |
7.5 |
7.1 |
49.3 |
26.8 |
20.2 |
|
Latin America |
2.5 |
8.3 |
7.1 |
7.4 |
27.8 |
20.1 |
21.0 |
|
Middle East and North Africa |
2.1 |
5.6 |
4.0 |
4.1 |
13.8 |
11.0 |
12.9 |
|
North America |
21.6 |
54.5 |
45.8 |
38.8 |
108.7 |
77.0 |
59.2 |
|
Pacific OECD |
22.8 |
58.7 |
45.8 |
42.8 |
111.0 |
74.6 |
62.9 |
|
Other Pacific Asia |
1.5 |
12.2 |
7.9 |
10.2 |
29.6 |
18.8 |
23.7 |
|
South Asia |
0.3 |
2.0 |
1.3 |
1.8 |
15.3 |
10.0 |
14.8 |
|
Western Europe |
16.2 |
45.9 |
37.1 |
32.9 |
93.5 |
63.9 |
53.7 |
|
World |
4.0 |
10.1 |
7.2 |
7.5 |
26.4 |
17.3 |
19.0 |
Note: Three scenarios are shown; middle-course case
B is compared with the three more sustainable scenarios, A3, C1, and C2, which
are characterised by higher economic growth, greater equity, and substantially
lower environmental impacts. All case A scenarios (A1, A2, and A3) share the
same type of economic development, as do the case C scenarios (C1 and C2).
Source: Nakicenovic, Grubler, and McDonald,
1998.
Primary energy requirements and supply
Future rates of economic development are among the most
important determinants of energy demand in the long term.2 The
IIASA-WEC study spans an increase in global energy needs in the range of 1.5-3
times by 2050, and 2-5 times by 2100. Taken together, energy requirements are
envisaged to increase at lower rates than economic growth. This means that
energy intensity is presumed to decline across all scenarios. By 2100 it falls
to between 80 and 20 percent of 1990 levels. This translates into annual
declines of between 0.8 percent and more than 1.5 percent, with a median of
about 1 percent. Thus the lowest future energy intensity improvements of 0.8
percent a year are in line with the historical experience of industrialised
countries.
Figure 9.3 shows a wide range of alternative future primary
energy requirements for the three scenarios. The energy needs for reference case
B are in the middle, about tripling by 2100. This development is bracketed by
the three more sustainable scenarios. A3 indicates substantially higher energy
needs resulting from more rapid economic growth, despite much higher energy
intensity. It nevertheless includes important characteristics of sustainability
because it leads to a substantially higher degree of economic equity with lower
environmental impacts at all scales. C1 (as well as C2) leads to the lowest
energy requirements of all scenarios, to about a doubling by 2100, resulting
from efficiency improvements and conservation; it is marked by a higher degree
of economic equity and very low environmental impacts.
For comparison, figure 9.3 also shows the highest and lowest
energy demand trajectories from the literature (Morita and Lee, 1998). The range
of future energy requirements across the scenarios is indeed large, from a
decline in the lowest scenario to an increase of 10 times in the highest. In
absolute terms, the increase by 2100 in primary energy requirements - in
comparison with 379 exajoules in 1990 - is expected to range from a moderate
increase, to 500 exajoules, to almost 3,200 exajoules. The highest energy
requirements correspond to an annual growth rate of 2 percent, exactly in line
with historical experience (since 1850; see figure 9.3). Also in line with
historical experience, many scenarios project a growing demand for fossil
energy, even if relative shares might be declining relative to alternative
sources of energy. This again emphasises the need for continuing improvement in
all energy efficiencies, including clean fossil fuels. The three IIASA-WEC
scenarios cover a significant part of the full range of primary energy
consumption spanned by other scenarios in the literature.
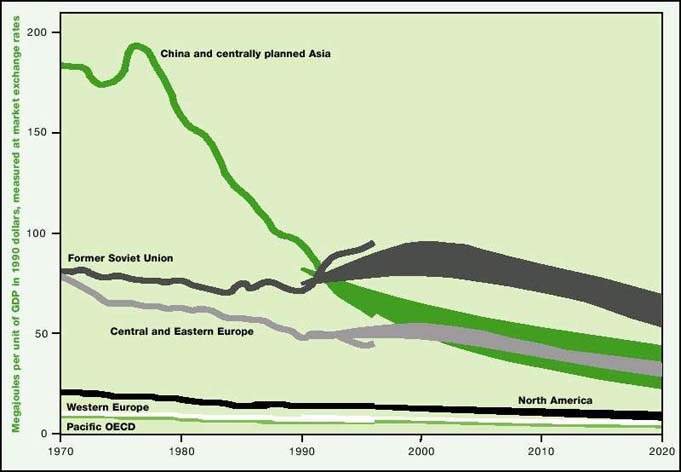
FIGURE 9.2. PRIMARY ENERGY
INTENSITIES FOR 6 REPRESENTATIVE REGIONS OUT OF THE 11 WORLD REGIONS, 1970-96,
AND IN THREE CASES, 1990-2020
Source: Nakicenovic, Gr�bler, and McDonald,
1998.
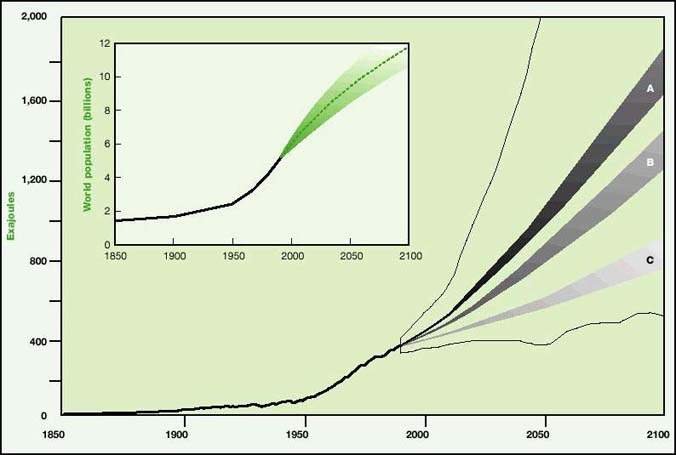
FIGURE 9.3 GLOBAL PRIMARY ENERGY
REQUIREMENTS, 1850-1990, AND IN THREE CASES, 1990-2100
The figure also shows the wide range of future
energy requirements for other scenarios in the literature. The vertical line
that spans the scenario range in 1990 indicates the uncertainty across the
literature of base-year energy requirements. The insert shows global population
growth, 1850-2000, and projections to 2100.
Source: Nakicenovic, Gr�bler, and McDonald, 1998; Morita and
Lee, 1998; Nakicenovic, Victor, and Morita, 1998; Bos and Vu,
1994.
Finally, the inset in figure 9.3 shows the global population
projections common to all IIASA-WEC scenarios. C1 leads to roughly constant per
capita primary energy consumption during the 21st century and describes a
transition towards more equity and lower environmental impacts. But it assumes
implementation of challenging policies, such as world-wide energy and carbon
taxes, that will change current development trends. In contrast A3 leads to a
higher increase - by 2.5 times - in per capita energy requirements, but it shows
that vigorous structural change of the energy system towards decarbonisation can
lead to low environmental impacts, even in conjunction with very high levels of
economic development and energy needs. The high rates of decarbonisation are,
however, not sufficient to offset increased energy demand, so the total carbon
emissions with A3 are substantially higher than those with C. Reference case B
indicates energy needs in the median range relative to the other two
alternatives (A and C) and the scenario literature in general, but it falls
short of the transitions described in the other three more sustainable
alternatives.
Alternative structures of future energy systems are capable of
meeting this growing demand for higher-quality energy end use and services.
Despite all the variations the scenarios look quite similar through 2020, and
all still rely on fossil fuels. But after 2020 the scenarios diverge, and the
energy transitions of the three more sustainable scenarios undergo a similar
degree of structural change in the energy system.
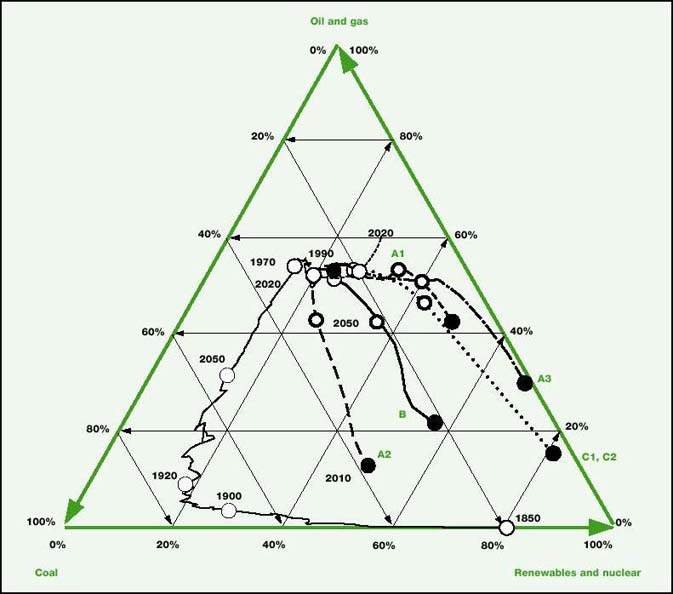
FIGURE 9.4. EVOLUTION OF PRIMARY
ENERGY STRUCTURE: SHARES OF OIL AND GAS, COAL, AND NON-FOSSIL SOURCES
(RENEWABLES AND NUCLEAR), 1850-2000, AND IN SIX SCENARIOS, 2000-2100
Shares are measured against the grid lines with
percentages shown on the three axes; see text for explanation of the figure.
Source: Nakicenovic, Gr�bler, and McDonald,
1998.
The roles of different primary energy sources, which vary across
the six scenarios, contribute to this divergence. Some continue to be fossil
fuel intensive; others envisage stronger shifts towards alternative sources such
as renewables or nuclear power. The geophysical availability of energy resources
is not a major constraint, even though currently estimated conventional oil and
gas reserves would soon be depleted across most of the scenarios. Instead the
availability of energy resources and the rates at which they are converted into
reserves are a function of the envisaged development strategies in the
scenarios. Part of the divergence in the structures of energy systems depends on
policy choices and development strategies. For example, the two case C scenarios
that assume strong international cooperation focused on environmental protection
through energy and carbon taxes rely much less on fossil fuel than do the other
scenarios. Figure 9.4 illustrates this long-term divergence in the structures of
energy systems across the scenarios.
Each corner of the triangle in figure 9.4 represents a
hypothetical situation in which all primary energy is supplied by a single
energy source: oil and gas on the top, coal on the lower left, and renewables
and nuclear energy on the lower right. Nuclear energy and renewables are grouped
together because they are in principle the non-fossil energy alternatives
available in the longer term. The illustration shows the historical development
of the global energy system starting in the 1850s, when most primary energy
needs were met by traditional (renewable) sources of energy, such as wood and
animal power, which in some cases are still harnessed in an unsustainable manner
- contributing to about 10 percent of deforestation and other adverse impacts
(chapters 3, 5, and 7).
The first transition in the historical development of the global
energy system, which lasted about 70 years, from 1850 to 1920, involved the
substitution of coal for traditional energy sources. The share of traditional
non-fossil energy sources declined from about 80 to 20 percent during this
period, while the share of coal increased from 20 to more than 70 percent. The
next transition has also lasted about 70 years, from 1920 to the present. It
involves the substitution of oil and gas for coal. The share of coal has
declined to about 30 percent, while the share of oil and gas has increased to
about 50 percent.
Figure 9.4 illustrates alternative development paths in the
structure of the energy system that might characterise the next transition.
Scenarios branch out after 2020. Some become coal intensive, such as reference
case B and high-growth A2. Others are more renewable and nuclear intensive, such
as the more sustainable A3 and ecologically driven C1 and C2. All the scenarios
eventually lead to a partial shift from fossil fuels to other sources of energy;
however, they follow alternative development paths. As the paths spread out,
they form diverging future developments. To some extent they are mutually
exclusive.
Most of the divergence after 2020 will depend on technological
developments and industrial strategies implemented between now and then. Which
energy sources in 2020 will best match the more flexible, more convenient,
cleaner forms of energy desired by consumers? Which firms will have made the
investments in research and development that will give them a technological
edge? And which will have refocused their operations away from merely providing
tonnes of coal or kilowatt-hours of electricity and towards offering better
energy services to consumers?
The answers to these questions will be determined between now
and 2020. Near-term investment decisions and efforts in technology research and
development will determine which of the alternative development paths will
dominate the post-2020 period. For example, the scenarios have the same
assumptions about fossil and nuclear energy resources and renewable energy
potentials (chapter 5). But their use differs across the scenarios, and these
differences tend to be amplified after 2020. Because of the long lifetimes of
infrastructure, power plants, refineries, and other energy investments, there
will not be a sufficiently large turnover of such facilities to reveal large
differences in the scenarios before 2020. But the seeds of the post-2020 world
will have been sown by then. Figure 9.4 illustrates that the achievement of a
more sustainably structured energy system should be seen as a cumulative,
evolutionary process: It needs to be initiated early to allow for the long time
constants required for fundamental transitions, such as a shift to cleaner
fossil fuels, renewables, and possibly nuclear energy.
|
The achievement of a more sustainably
structured energy
system needs to be
initiated early to allow for the long
time constants
required for
fundamental transitions
to cleaner fuels. |
Long-term global energy futures are no longer seen as being
geologically preordained. The imminent resource scarcity forecast in the 1970s
did not materialise. With continued exploration efforts and technological
progress, accessible and affordable reserves have increased, and this trend is
likely to continue. After 2020 all scenarios move away from their current
reliance on conventional oil and gas. As mentioned, the currently estimated
conventional oil and gas reserves do not reach much into the post-2020 periods
in any of the scenarios (chapter 5). This transition progresses relatively
slowly in scenario A1, where oil and gas are plentiful. In the more sustainable
scenarios, A3, C1 and C2, it progresses more rapidly because of faster
technological progress towards cleaner fossil energy systems (A3) or because
energy and environmental policies favour non-fossil alternatives (C1 and C2).
An ecologically driven clean-fossil version of case C is also
conceivable. Such a third C variant (C3) would incorporate most of the
environmentally compatible fossil energy conversion system together with
decarbonisation and carbon removal and storage. But such a scenario was not
developed, for two reasons. First, A3 already includes clean and efficient
fossil energy technologies, along with some carbon removal and its use for
enhanced oil recovery. Thus limited carbon removal and sequestration occur for
economic reasons and are competitive with other options for enhanced oil
recovery. But additional carbon removal, although technically possible, is
expensive and thus would require introducing carbon taxes or emissions limits.
In A3 cumulative carbon emissions are about 1,000 gigatonnes for 1990-2100. Thus
that amount of carbon - about 50 percent more than now in the atmosphere - would
need to be stored. Disposal in geological reservoirs is possible; however, the
amounts involved are gigantic, and affordable disposal and storage systems still
need to be developed (chapter 8). Second, the advantage of an ecologically
driven clean-fossil version of case C would basically be very similar to A3 but
would have the advantage of requiring storage of much less carbon, but still a
very large amount, comparable to the current carbon dioxide in the atmosphere.
In scenario A2 and reference case B, the transition away from
oil and gas includes an important contribution from coal, whose long-term market
share after 2050 is 20-40 percent. Nonetheless little of this coal is used
directly. Instead it is converted to high-quality energy carriers (electricity,
liquids, and gases) demanded by high-income consumers after 2050. Thus very
different resource and technological options can be drawn upon to meet the
cleaner energy being demanded by more and more affluent consumers
world-wide.
Technological dynamics and structural change
Technology is the key determinant of economic development and is
essential for raising standards of living and for easing humanity’s burden
on the environment (Gr�bler, 1998b). Because technological progress is based on
human ingenuity, it is thus a human-made resource that is renewable - as long as
it is nurtured. But this nurture has a price. Innovation, especially the
commercialisation of novel technologies and processes, requires continual
investments of effort and money in research, development, and demonstration
(RD&D). Technology diffusion, in turn, depends on both RD&D and learning
by doing. Some advanced technologies important in the scenarios - such as
hydrogen production, distribution, and end use - would be radical innovations
that are not likely to result from incremental improvement of current
technologies. And without investment and experience, there can be no long-term
technological improvement, either through incremental or radical change.
Innovation and technology diffusion require both that
opportunities are perceived and that the entrepreneurial spirit exists to pursue
them. Long-term scenarios cannot forecast future technological
‘winners’ or ‘losers’, but they can indicate areas of
technological opportunity. Figure 9.5 illustrates the global market potential in
the IIASA-WEC scenarios for four classes of energy technologies: new end-use
energy devices (efficient lighting, heat pumps), power plants, synfuel
production (from biomass, coal, and natural gas), and energy transport,
transmission, and distribution infrastructure. For each of the four classes of
technologies, the minimum, maximum, and average market potential for the six
scenarios are shown in 2020, 2050, and 2100.
Across the wide variation in possible energy developments
depicted in the scenarios, the importance of energy infrastructure grows
persistently. Even in the sustainable, low-demand scenarios of case C (C1 and
C2), energy infrastructure delivers at least 400 exajoules a year by 2050. By
the end of the century it averages 800 exajoules a year across all scenarios,
reaching close to 1,600 exajoules a year in the highest scenarios. The markets
for power sector technologies also grow substantially, with a wide spread
between the maximum and minimum scenarios. By 2050 the annual range is 120-560
exajoules (energy delivered). Part of this spread is due to uncertainties about
demand growth, but part arises from energy end-use innovations in the form of
new, on-site decentralised electricity generation technologies, such as
photovoltaics or fuel cells. The potential for decentralised systems in the long
term outgrows that of the power sector. The most important customers for energy
technologies would no longer be a limited number of utility managers but rather
millions of energy consumers world-wide. Synfuels also emerge in the long term
as a major technology market. An orderly transition away from conventional oil
and gas translates into large technology markets for synliquids, syngas - and,
in the long term, increasing shares of hydrogen produced from both fossil fuels
(coal and natural gas) and renewables (biomass). By 2100 the global synfuels
market could be at least 160 exajoules a year, comparable to the current global
oil market.
|
Long-term scenarios cannot
forecast future technological
'winners'
or 'losers', but they can indicate
areas of
technological
opportunities. |
As noted above, technological progress has a price - it requires
continual investment in RD&D. All the technological improvements in the
scenarios that are reflected in the expansion of all technology categories shown
in figure 9.5 presume steady RD&D investment. Given the importance of
strategic investment in RD&D, it is a cause for concern that energy-related
RD&D expenditures are currently declining in most OECD countries. Evidently
upfront RD&D expenditures are increasingly viewed as too expensive in
markets where maximising short-term shareholder value takes precedence over
longer-term socioeconomic development and environmental protection.
The important conclusion from this analysis of IIASA-WEC
scenarios is that far-reaching technological improvements (chapters 6-8) are
central to the transition towards sustainable development and thus need to be
developed and disseminated throughout the energy system - including to
decentralised systems and end users. Perhaps this is not surprising because end
use is the least efficient part of the whole energy system. These possible
developments have two important implications. First, they weaken the argument
for extensive RD&D investment in large, sophisticated, ‘lumpy’,
inflexible technologies such as fusion power and centralised solar thermal power
plants. Improvements in end-use technologies, through which millions, rather
than hundreds, of units are produced and used, are more amenable to
standardisation, modularisation, and mass production, and hence to benefit from
learning-curve effects (resulting in cost reductions and performance
improvements). Second, institutional arrangements governing final energy use and
supply are critical. The deregulation, reregulation, and liberalisation of
electricity markets can create incentives in this direction; service packages
can be tailored to various consumer preferences, especially because traditional
consumers can sell electricity back to the grid. But liberalisation could
discourage long-term RD&D by emphasising short-term
profits.
The structure of final energy requirements
In virtually all energy scenarios in the literature, economic
growth outpaces the increase in energy consumption, leading to substantial
reductions in energy intensities and efficiencies. This is to a large extent due
to technological change and structural changes towards less materials-intensive,
more knowledge-intensive activities. As individual technologies are developed
and enter the marketplace, inefficient technologies are replaced by more
efficient ones, and the structure of the energy-supply system and patterns of
energy services change. These factors reduce the amount of primary energy needed
per unit of final energy delivered to end users, as well as final energy per
unit energy service. With all other factors being equal, the faster economic
growth, the higher the rate of technological change, the higher the turnover of
capital, and the greater the decline in energy intensity and improvement of
energy efficiency. These long-term relationships between energy efficiency and
economic development are reflected in the majority of scenarios in the
literature and are consistent with historical experience across a range of
alternative development paths in different countries.
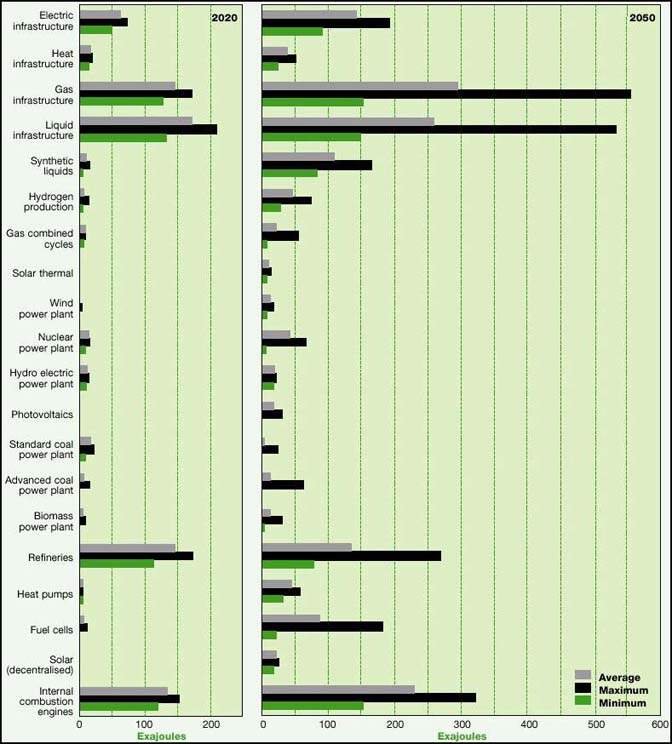
FIGURE 9.5. GLOBAL MARKET
POTENTIALS FOR POWER PLANTS, SYNFUEL PRODUCTION, NEW END-USE ENERGY DEVICES, AND
ENERGY INFRASTRUCTURE ACROSS SIX SCENARIOS, 2020 AND 2050
Source: Nakicenovic, Gr�bler, and McDonald,
1998.
The scenarios cover a wide range of energy supply possibilities
to meet growing energy requirements, from a tremendous expansion of coal
production to strict limits on it, from a phase-out of nuclear energy to a
substantial increase in its use. Yet all the variations explored in the
alternative scenarios match the continuing need for more flexible, more
convenient, cleaner forms of energy. This means that all energy is increasingly
converted into quality carriers such as electricity, liquids, and energy gases.
For example, the direct end use of solids by final consumers disappears by 2050.
Solid energy sources are more and more converted into liquids and gird-oriented
energy carriers such as energy gases and electricity.
Thus despite all the variations in major driving forces of
energy end use across a wide range of scenarios, the pattern of final energy use
is remarkably consistent across many scenarios that describe sustainable energy
development. Figure 9.6 illustrates the convergence in the structure of final
energy for the IIASA-WEC scenarios.
As shown in figure 9.6, all six scenarios portray a pervasive
shift from energy being used in its original form, such as traditional direct
uses of coal and biomass, to elaborate systems of energy conversion and
delivery. This shift continues in all cases, leading to ever more sophisticated
energy systems and higher-quality energy carriers. A second profound
transformation is the increasing delivery of energy by dedicated transport
infrastructure, such as pipelines and electric networks. This development
enhances trade possibilities and promotes similar end-use patterns across
regions with fundamentally different primary energy supply structures. Third,
changes in final energy patterns reflect the changes in economic structure
presented in the scenarios. As incomes increase, the share of transport,
residential, and commercial applications also increases.
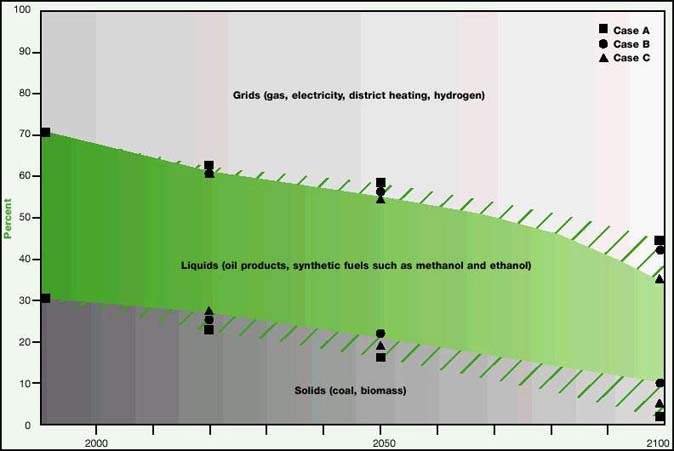
FIGURE 9.6 GLOBAL FINAL ENERGY
SHARES BY FORM IN THREE CASES
Solids include direct delivery to end users.
Overlapping areas indicate variations across the cases.
Source: Nakicenovic, Gr�bler, and McDonald,
1998.
These converging final energy patterns yield substantial quality
improvements in the energy (and energy services) delivered to the consumer.
Quality improvements are measured by two indicators: fuel-mix-induced efficiency
gains and the carbon intensity of final energy. The efficiency of final energy
use improves as the final energy carrier portfolio changes in the direction of
higher-quality fuels. The effect is an improvement via inter-fuel substitution
of 20-30 percent. The actual end-use efficiency gains are of course much larger,
for they are mostly driven by technological change in end-use devices (cars,
light bulbs, and so on). The main points are that more efficient end-use devices
will require higher-quality fuels, and there is a high degree of congruence
across all six scenarios. Thus whereas primary energy supply structures and
resulting carbon intensities diverge in the IIASA-WEC scenarios, those of final
energy converge. The decarbonisation trend of final energy relative to primary
energy is also faster across all the cases.
These energy developments are characteristic of many sustainable
scenarios. The use of non-commercial final energy generally disappears, while
industrial and transport energy shares generally grow, largely due to an
enormous increase in industrial production and mobility in developing countries.
In industrialised regions, however, residential and commercial energy needs
generally grow faster than those for industry. Growth of mobility, especially in
developing regions, is one of the pervasive changes across all the scenarios.
Even in industrialised countries, transport energy requirements grow faster than
any other final energy use. The share of final energy for transportation
increases from one-fifth today to a third in the case A scenarios and to a
quarter in the case C scenarios. The increase is more modest in C scenarios
because of their orientation towards public rather than individual transport and
towards partial replacement of mobility through communication. With high levels
of affluence and leisure, new services and new activities emerge that shift
final energy requirements away from materials- and energy-intensive production.
The demographic changes associated with ageing and single-person households
reinforce this trend in such scenarios.
As noted, some scenarios describe less-intensive mobility and
urbanisation developments. This is true for the case C scenarios that foresee a
stronger shift towards decentralised energy systems and reliance on local
solutions. Final energy needs in the residential and commercial sector increase
to more than half of all final energy after 2050. Mobility and
materials-intensive production are replaced by communication and services,
resulting in lower material and energy intensities. This leads to significant
differences across regions and scenarios in the end-use devices that are used
and in how they are used (that is, lifestyles), even when differences in total
final energy demand are small. This points to an important but still poorly
understood and thus weak interaction between lifestyles and energy services. An
illustration is given in the IIASA-WEC study, which contrasts the three
high-growth A scenarios for Latin America with the ecologically driven C
scenario for Western Europe. Both regions have a strong tradition of detailed
analyses of energy end use and associated lifestyle changes (Goldemberg and
others, 1988; Schipper and Meyers, 1992; IEA, 1993).
|
All six scenarios portray
a pervasive shift from energy
being
used in its original form to elaborate
systems of energy
conversion
and delivery. |
Temporal and spatial scales of scenarios
Energy scenarios in the literature cover a wide range of time
horizons, from 10-20 to more than 100 years. Sustainable energy scenarios
usually have long time horizons. The inertia of energy systems is high, so it
takes decades before a shift away from reliance on fossil energy sources can be
achieved in sustainable scenarios. Major exceptions are some of the recent
studies of policies and measures for meeting the carbon emission targets
specified in the Kyoto Protocol (UNFCCC, 1992). The protocol calls for the
reduction of emissions in industrialised countries (so-called Annex I under the
UNFCCC) by about 5 percent relative to the base year 1990 during the 2008-12
period (UNFCCC, 1997). A number of scenarios in the literature (such as IEA,
1998) focus on this time period and on achieving emission reductions. Some of
these scenarios would presumably lead to sustainable development in the long
run, assuming that structural change towards clean fossil and non-fossil energy
continues.
Generally, however, most scenarios that describe sustainable
development have long time horizons, usually extending for 100 years. They make
up an important share of all long-term energy scenarios. They share a number of
features with other long-term scenarios that are significantly different from
those of short-term scenarios. In general the longer the time horizon, the lower
the likely growth rates of driving forces and energy need. This tendency is
probably linked to the fundamental difference between short- and long-term
scenarios. Short-term scenarios are often national or regional and frequently
describe energy options that may be overly optimistic from a global perspective.
In contrast long-term scenarios are often global and focus on possibilities that
might be more limited than regional expectations.
The variability and uncertainty of regional and global scenarios
also tend to increase with higher temporal and spatial resolutions. Thus over
longer periods and larger areas, developments tend to average out, leading to
lower variations and uncertainties. If this is generally true, then it means
that the future is more open at higher scales of spatial and temporal
resolution, requiring a larger portfolio of alternative scenarios to cover the
range of possibilities.
Spatial phenomena are therefore important for developing and
interpreting scenarios. For example, many scenario environmental impacts require
a detailed regional resolution. Many environmental phenomena require that
scenario driving forces, energy use, and emissions be gridded with a very high
spatial resolution. Very few scenarios and modelling approaches are based on a
fine geographic scale. Thus, for a number of reasons, national or regional
spatial scales are not always ideal for energy scenarios. But such scenarios are
rare due to many unresolved methodological issues. With current methodological
approaches, energy-related spatial phenomena are more difficult to capture on
the global scale than evolution in time.
There are, of course, exceptions. Recent scenarios by S�rensen,
Kuemmel, and Meibom (1999) have high geographic resolution for driving forces as
well as energy use patterns (box 9.2). The scenarios highlight the uneven
geographic distribution of economic activities, resources, and energy patterns -
and also bring new insights into energy trade implications, energy
infrastructure, and transport. For example, the scenarios that rely on clean
fossil fuel and safe nuclear energy options entail trade and transmission of
energy in much the same pattern as today. This situation has important
implications for economic development in energy-importing countries that may
have lower economic growth relative to other scenarios with more self-sufficient
domestic provision of energy. The scenarios demonstrate that focusing on
decentralised, renewable energy sources with low energy densities would make it
difficult to match energy demand growth in some parts of the world by 2050. In
contrast scenarios that also rely on centrally produced renewable energy create
supply in excess of demand and through trade foster robust energy systems and
low adverse environmental impacts (S�rensen, Kuemmel, and Meibom,
1999).
The legacy of past generations
Energy scenarios explore the future and rarely look at the past.
But the dynamics of history matter for future developments. This is especially
relevant to scenarios that achieve sustainability for future generations. Equity
often plays an important role in such considerations.
This is in stark contrast to our common history. Both in the
past and today, a small minority of the global population accounts for most
economic activity, materials use, and mobility, just to mention a few driving
forces of energy use. Thus most energy is consumed by a relatively small,
affluent part of the global population that lives in industrialised countries;
this 20 percent of the population enjoys about 80 percent of gross world product
(see figure 9.1) and more than 60 percent of global energy consumption.
Historically, today’s affluent part of the global population has consumed
about 80 percent of fossil energy. Its many benefits from this consumption
include enormous economic development. But many of the adverse environmental and
other impacts of this cumulative energy consumption have been shared with the
rest of the world.
Most sustainable energy scenarios envisage a fundamental change
in the future from today’s inequitable distribution of benefits and adverse
impacts. The scenarios use various methods to implement policies to move global
development towards sustainability. For example, the IIASA-WEC case C scenarios
assume revenue-neutral energy and carbon dioxide taxes whose proceeds enhance
international collaboration and resource transfers from industrialised to
developing regions. This situation may appear unrealistic from the current
perspective, but it was necessary to achieve both rapid development of poor
regions and environmental protection. Another example is the so-called B1 family
of sustainable scenarios (developed by different modelling approaches) for the
IPCC Special Report on Emissions Scenarios (Nakicenovic and others, 2000)
that all achieve equity through a host of policy and behavioural changes in the
world, along with improvements of environmental compatibility at all scales (De
Vries and others, 2000). Thus sustainable energy scenarios require challenging
changes.
|
BOX 9.2. SPATIAL SCENARIO OF ENERGY END USE
S�rensen, Kuemmel, and Meibom (1999) give an example of an
energy scenario that emphasises demand-side management, high levels of energy
efficiency, and conservation while attaining high levels of global prosperity.
It assumes that average energy technology efficiency in 2050 will correspond to
the best current rates. This results in total global energy end-use demand of
about 220 exajoules in 2050. The scenario is thus characterised by relatively
low energy requirements relative to the increase in per capita energy use. The
energy available to the end user today is only about 12 percent of primary
energy, and the challenge is to increase this fraction. The resulting energy
requirements are roughly half those in the IIASA-WEC case C scenarios.
Population assumptions are about the same. S�rensen, Kuemmel, and Meibom (1999)
base their scenario on UN median population projections (UN, 1996) and UN
increasing urbanisation estimates (UN, 1997).
A unique feature of the scenario is a very high geographic
resolution (using the middle scenario of UN, 1996), increasing urbanisation (UN,
1997), and an increase from today’s per capita energy use by an average
factor of 2.7. GNP growth is larger because of the de-coupling of economic and
energy growth, and the distribution of this growth across regions is not even
(because a higher growth rate is assumed for today’s poor regions). Figure
below shows the ‘gridded’ total energy delivered to end users in 2050.
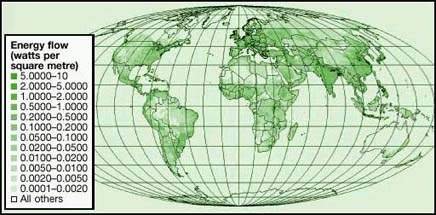
Scenario of total energy delivered
to end users, 2050
Note: Includes energy for air conditioning, process
heat, stationary mechanical energy, electric energy, energy for transportation,
and energy in food. The average energy demand is about 23 gigajoules per capita,
or three times the amount made useful at the end use
today.
Source: S�rensen, Juemmel, and Meibom, 1999.
|
The role of policies
Sustainable energy scenarios usually assume or imply a host of
measures to achieve their goals, from a transition from fossil energy sources to
adoption of environmentally friendly behaviour patterns. The policies include
market-based and regulatory mechanisms as well as assumed changes in human
behaviour (chapter 12). Regulatory standards, taxes, and emissions trading
schemes are comparatively easy to implement in scenarios developed using formal
models. But it is much more difficult to determine what measures would be
required to achieve the behavioural and institutional changes called for in such
scenarios. One example from recent IPCC scenarios is given here for illustrative
purposes (Nakicenovic and others, 2000).
The IPCC B1 scenario family includes many characteristics of
sustainable development. Its storyline or narrative description calls for
extensive changes (for further details see the Website at
http://sres.ciesin.org; https://www.ipcc.ch;
https://www.iiasa.ac.at/Research/TNT/Draft/Publications/publications.html; De
Vries and others, 2000; Nakicenovic and others, 2000; and Nakicenovic, 2000).
The storyline assumes a high level of environmental consciousness and
institutional effectiveness. Consequently environmental quality is high because
most of the potentially negative environmental aspects of rapid development are
anticipated and dealt with effectively at local, national, and international
levels. For example, transboundary air pollution (acid rain) is basically
eliminated in the long term. Land use is carefully managed to counteract the
impacts of activities that could damage the environment. Cities are compact and
designed for public and non-motorised transport, and suburban developments are
tightly controlled. Strong incentives for low-input, low-impact agriculture,
along with maintenance of large areas of wilderness, contribute to high food
prices with much lower levels of meat consumption.
These proactive local and regional environmental measures and
policies also lead to relatively low energy requirements and low emissions, even
in the absence of explicit interventions directed at conserving energy or
mitigating climate change. The IPCC B1 world invests a large part of its gains
in more efficient resource use (‘dematerialisation’), greater equity,
stronger social institutions, and increased environmental protection. A strong
welfare net prevents social exclusion on the basis of poverty. But the storyline
also considers that counter-currents may develop, and in some places people may
not conform to the main social and environmental intentions of the mainstream in
this scenario family. Massive income redistribution and presumably high taxes
may adversely affect the functioning of world markets. Environmental protection
could become an issue in some parts of the world. This all illustrates how
achieving sustainable development is a very difficult task - even in scenarios -
as new policies play out in relation to other driving forces.
|
Most sustainable energy scenarios
envisage a fundamental
change in the
future from today's inequitable
distribution of benefits
and
adverse impacts. |
Other examples of strong policies can be seen in nearly all
sustainable development scenarios. The “Transformed World” of Hammond
(1998), based on the “Great Transitions” of Gallopin and others
(1997), stresses the role of global technological innovation in addition to
enlightened corporate actions, government policies, and empowerment of local
groups. In the “Shared Space” of the Millennium Institute (Glenn and
Gordon, 1997), resources are shared more equitably for the benefit of all and
the safety of humanity. The Shell “Sustainable World” (1996, 1998) and
the WBCSD (1998) “Geopolity” and “Jazz” also examine
sustainable
futures.
Implications of sustainable energy scenarios
The divergence among the three cases described in this chapter
reflects different assumptions for a number of driving forces of future
development, such as demographic changes and economic growth. Assumptions about
future technological change are the most important determinants of how the
scenarios unfold. These assumptions include the effectiveness of RD&D and
the direction and rate of technological diffusion (including lock-in effects and
learning curves). Future capital investments and financing are also crucial
determinants of future energy development, as are global energy trade patterns.
Finally the impact of environmental changes at local, regional, and global
levels will also drive change and energy
developments.
RD&D trends and requirements and technological diffusion
The development of clean, efficient, affordable, reliable energy
systems is a common characteristic of most sustainable energy scenarios. An
important prerequisite for such future technology developments is sufficient
investment in RD&D. But this alone is not a guarantee for success. Radically
new technologies need to be introduced into the marketplace and (if successful)
need to be pervasively diffused to contribute to sustainability. Incremental
improvement of existing technologies is likely to fall short of changing
technoeconomic paradigms, as is foreseen in the three scenarios characterised by
sustainability. In fact, all these scenarios rely on pervasive diffusion, over a
long time period, of new technoeconomic systems in the energy system - from a
combination of advanced, highly efficient energy extractions, to conversion and
end-use technologies, to new, clean energy carriers such as hydrogen.
These technology needs for achieving sustainability are in stark
contrast to recent developments. RD&D efforts have increased substantially
in most OECD countries. But energy-related RD&D has declined in all of them
except Japan and Switzerland. In share of GDP, energy-related efforts may have
declined by as much as 10 percent a year on average in OECD countries. It has
been argued that this decline in public RD&D funding is more than
compensated for by private sources as a consequence of recent energy
privatisation and liberalisation. But the tentative evidence indicates that this
is not necessarily true for investments in radical new technologies, and that
private-sector energy RD&D focuses more on incrementally improving
technologies and may be declining. For example, private energy-related RD&D
has fallen by nearly a third in the United States during the past five years,
while RD&D in other sectors has increased (chapter 12).
Finally, it has been claimed that the deployment of new energy
technologies has occurred at an unprecedented rate in recent years despite the
declines in RD&D funding. This is supposed to indicate that there are plenty
of funds available for attractive new technologies. Perhaps this is true, but
many of the energy technologies that have been deployed successfully in recent
years - from combined-cycle gas turbine to horizontal drilling - were developed
long ago, when RD&D funding was plentiful. There also have been important
spillovers from other sectors; for example, the development of gas turbines
benefited from enormous progress on both military and civilian jet engines. But
new competitive pressures have probably contributed to price declines and wide
diffusion of these technologies.
A strong conclusion for a whole range of sustainable scenarios
is that a substantial increase in RD&D for new energy technologies is
needed. Otherwise most clean, efficient fossil and renewable technologies may
not reach competitiveness with traditional options. Significant improvements in
these technologies are required as traditional technologies improve as well.
This is not, however, an appeal to return to the types of exclusively public
expenditure programs on energy RD&D of past decades. The paradigm has
shifted now towards a balance between publicly and privately funded basic
research and towards far more reliance on incentives to promote private RD&D
and market applications, for example through tax and regulatory incentives for
innovation.
These kinds of advances in knowledge and technology are likely
to be as important for achieving a sustainable future as they were for
explaining the productivity growth in today’s industrialised countries. In
the original study by Solow (1956) it was estimated that 87 percent of per
capita productivity growth was due to technological change (the remainder was
attributed to increases in capital inputs). The contribution of technical
progress to pollution abatement is even greater: as the chapters on energy
technology (7 and 8) and the economy (11) show, innovations in pollution control
can often cut emissions by 95 percent, and potentially completely in some cases.
Advances in knowledge thus do not simply contribute to economic development in
general but also help achieve a higher degree of affluence, equity, and
environmental compatibility.
|
Technological diffusion
occurs over a long period
of
time, from a new technology's
first introduction to its
pervasive
adoption. |
Economic growth theory suggests that different capital and
labour productivities across countries lead to different productivity growth
rates and hence to conditional convergence across economies. As Rostow (1990)
explained, the “poor get richer and the rich slow down”. This relative
convergence of the poor and rich stems from the assumption of diminishing
returns on capital. Additional convergence potentials may accrue for economies
with a higher ratio of human to physical capital. In terms of a functional
relationship for future developments, therefore, per capita GDP growth rates are
expected (all other things being equal) to be higher for economies with low per
capita GDP levels. Notwithstanding many frustrating setbacks like the recent
‘lost decade’ for economic catch-up in Africa and Latin America,
empirical data indicate that the convergence theorem holds. The evidence put
forward by Barro (1997) and Barro and Sala-I-Martin (1995), based on the
experience of some 100 countries in 1960-85, shows per capita GDP growth rates
as a function of GDP per capita levels after accounting for all other salient
influencing variables (such as education, inflation, terms of trade, and
institutional factors).
Many sustainable scenarios have in common this kind of relative
economic convergence and catch-up between today’s developing and
industrialised regions in the next 100 years. The successful diffusion of new
technologies and different consumption patterns are therefore important
prerequisites for achieving sustainability in such scenarios.
With a few notable exceptions (for example, the scenario
developed by Lazarus and others, 1993, and the case C scenarios presented in the
IIASA-WEC study), the challenge of exploring conditions for closing the income
gap between developing and industrialised regions appears to be a fundamental
challenge for scenarios that describe sustainable development. Differential
economic growth rates can close a part of this gap; the other part needs to be
closed through additional measures ranging from accelerated rates of
technological diffusion to more equitable income and resource distribution. For
example, the C scenarios incorporate a challenging, broad portfolio of
environmental control technologies and policies, including incentives to
encourage energy producers and consumers to use energy more efficiently and
carefully, ‘green’ taxes (levied on energy and carbon), international
environmental and economic agreements, and technology transfer.
Case C reflects substantial resource transfers from
industrialised to developing countries, which spur growth and eradicate poverty.
Specifically, C assumes that energy and carbon taxes are applied universally,
albeit at different rates and timing, and are revenue neutral. The proceeds from
these taxes in OECD countries are recycled as resource transfers to developing
countries and are used to promote energy infrastructure, clean technologies,
efficiency, and conservation. Such transfers help solve part of the
scenarios’ development problem, which is fundamental for a sustainable
world. Solving the other part of the problem entails revitalising international
programs to address world poverty. These poverty alleviation aspects of
achieving sustainability are implicit in the scenarios - and include investment
in energy and environmental ends, but more important in education, health,
security against natural disasters, and so
forth.
Capital requirements and financing
Capital investment is crucial for energy development. Both the
overall development of and structural changes in energy systems result from
investments in plant, equipment, and energy infrastructure. Because adequate and
affordable energy supplies are critical for economic growth, any difficulties in
attracting capital for energy investment can slow economic development,
especially in the least developed countries, where 2 billion people have yet to
gain access to commercial energy services. And - although energy investment
accounts for only a small share of the global capital market - the availability
of the capital needed for a growing energy sector cannot be taken for granted
but depends on prices and regulations that permit investors to earn rates of
return that are competitive with other opportunities offered by international
capital markets. This is especially the case for sustainable development paths,
which require high levels of investment in new technologies and conservation
measures that may not be initially competitive with their traditional
counterparts.
Capital markets have been growing faster than total GDP for
quite some time, and this trend is unlikely to change. Present annual global
energy investments are approximately 7 percent of international credit financing
of about $3.6 trillion (Hanke, 1995). With capital markets growing relative to
GDP, and assuming largely stable future energy investment ratios, capital market
size does not appear to be a limiting factor for energy sector finance today and
is not likely to be one across a wide range of scenarios.
Very few scenarios in the literature give a detailed account of
energy-related investments. Even fewer describe investments that will promote
sustainable energy futures. Thus estimates of global capital requirements for
energy development are often based on back-of-the-envelope calculations of
aggregate energy investment indicators for several major energy-consuming
countries that have been extrapolated to the rest of the world. These estimates
tend to be highly influenced by present market realities and short-term market
expectations and necessarily incorporate a number of ad hoc (and not necessarily
consistent) assumptions about the relationship between income growth and energy
requirements.
For example, if energy intensities are assumed to increase,
capital requirements will, other things being equal, differ significantly from
scenarios in which energy intensities decline. Investments are likely to grow
faster than GDP in the former case and slower than GDP in the latter. Capital
estimates also depend greatly on the assumed costs of different technologies,
including infrastructure, and the projected energy mix. As a result, comparisons
among estimates of future investment requirements must recognise that each
reflects a set of assumptions consistent with a specific
energy-economy-environment scenario.
The IIASA-WEC scenarios provide a comprehensive assessment of
energy-related investment requirements on the basis of detailed bottom-up cost
calculations for the entire energy sector, extending from resource extraction
(such as coal mining and oil exploration) through development and production to
delivery of energy products to final consumers. The estimates of energy
investments do not include, however, those required to achieve more efficient
services or structural changes that lead to greater efficiencies. Each
technology - an oil platform, gas pipeline, liquefied natural gas (LNG)
terminal, electricity generating plant, district heat grid, and so forth - is
characterised by a set of technoeconomic parameters, one of which is investment
cost in dollars per unit of installed capacity. These costs are then aggregated
into the total investment requirements for the entire energy sector. But because
these cost estimates were derived during the 1990s (for the base year 1990),
they do not reflect more recent changes, such as declines in energy costs.
A conclusion consistent across all six IIASA-WEC scenarios is
that the capital requirements of the energy sector will be extremely large
relative to current standards, but will not be infeasible. During the next 30
years capital requirements across the scenarios are estimated to be $12-17
trillion, measured at market exchange rates and 1998 dollars (or $10-15 trillion
in 1990 dollars; this is to be compared with 1990 gross world product of about
$20 trillion; see table 9.1). (In 2000-20, investment requirements are estimated
to be $9-$13 trillion, 1998 dollars.) Figure 9.7 shows this range of cumulative
global energy investment requirements between 1990 and 2020. They are
desegregated into investments in the electricity sector, other energy conversion
systems, and energy supply (extraction, upgrading, transmission, and
distribution) for three major world regions; table 9.1 shows the cumulative
investments for 2020-50 and 2050-2100. Note that capital requirements are lowest
for the case C scenarios that describe sustainable development paths. These
scenarios’ relative advantage of substantially lower energy financing
requirements is an important indicator of the high economic value of energy
efficiency and conservation. But the costs of energy end-use changes are not
included in the assessment.
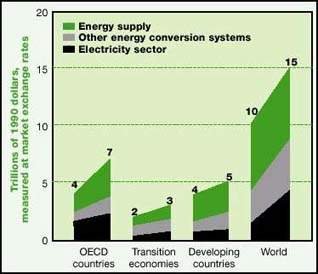
FIGURE 9.7. CUMULATIVE ENERGY
INVESTMENTS ACROSS SIX SCENARIOS, 1990-2020
The highest investments refer to case A and the
lowest to case C scenarios.
Source: Nakicenovic, Gr�bler, and McDonald,
1998.
As a share of GDP, global energy investments range from 1.5 to
1.9 percent across the scenarios. This is in line with historical norms: During
the early 1990s investment averaged just over 1 percent of global GDP (ranging
from $240-280 billion a year). In the scenarios they are highest in the
transition economies of Europe and Asia, where they range up to 7-9 percent of
GDP. These high investment needs are a legacy of the high energy intensity of
the former centrally planned economies and recent declines in investment that
went along with economic recession. The result is a substantial need to
reconstruct and upgrade energy infrastructure. Another important aspect of
future energy investment is that the share of developing regions rises sharply,
from today’s 25-30 percent to 42-48 percent, and these regions become the
largest capital investment market in all scenarios.
Overall, energy investments in the scenarios decrease as a share
of GDP throughout the world. But the challenge will be that an increasing
fraction of capital requirements will need to be raised from the private sector,
where energy needs will face stiffer competition and return-on-investment
criteria. Also most investments must be made in developing countries, where both
international development capital and private investment capital are often
scarce.
Technological diffusion
Technological progress is central to all scenarios that describe
sustainable development. The direction of technological change is of crucial
importance in these scenarios. To varying degrees they all envisage a transition
from reliance on fossil energy sources to clean fossil options, renewable energy
sources, and in some cases to safe nuclear energy. But they require the
development and diffusion of radical new technoeconomic systems. The IIASA-WEC
scenarios illustrate this by different directions of technological change in the
energy system within the framework of the three case A scenarios. Energy systems
structures range from continued reliance on fossil-intensive development paths
to high rates of decarbonisation. Otherwise the scenarios share the same
development of other driving forces such as population, economic growth, and
energy demand. Clearly the fossil-intensive scenarios do not meet sustainability
criteria - unless they radically reduce emissions, including carbon removal and
storage. Other implications of these alternative technological development paths
are equally important. This illustrates that the direction of technological
change can be as important for achieving sustainable development as all other
driving forces combined.
Technological diffusion occurs over a long period of time, from
a new technology’s first introduction to its pervasive adoption. For energy
technologies diffusion time may range from 10-20 years all the way to 100 years.
For example, the diffusion of motor vehicles or air conditioning systems usually
takes 10-20 years. In contrast, the diffusion of new energy systems consisting
of numerous individual technologies, such as a shift to renewable sources, might
take almost 100 years. A principal conclusion of many sustainable energy
scenarios is that the long-term transition to new energy technologies will
largely be determined by technological choices made in the next 10-30 years.
There is a need to anticipate technical characteristics - such as performance,
cost, and diffusion - of new energy technologies such as photovoltaics, hydrogen
production, and fuel cells; the long-term diffusion, transfer, and performance
of these technologies depends on near-term RD&D and investment policies and
decisions. If new technologies are not developed through dedicated RD&D
efforts, they will not be diffused and will not be available when needed.
Diffusion is an endogenous process. This illustrates path dependence in
technological diffusion; because there is a virtual lock-in to the development
path formed by many individual, related decisions, other possibilities are
excluded (for example, see Gr�bler, 1998b).
These lock-in effects have two implications. First, early
investments and early applications are extremely important in determining which
technologies - and energy resources - will be most important in the future. This
means that there needs to be an early investment in sustainable technologies if
the sustainable development path is to be achieved. Second, learning and lock-in
make technology transfer more difficult. This means that - in this context - the
difference between diffusion and transfer disappears; they are parts of the same
process. Successfully building and using computers, cars, and power plants
depends as much on learning through hands-on experience as on design drawings
and instruction manuals. And a technology that is tremendously productive when
supported by complementary networks of suppliers, repair workers, training
programs, and so forth, and by an infrastructure that has co-evolved with the
technology, will be much less effective in isolation.
Technology costs and performance - including energy efficiency
in particular - improve with experience, and there is a common pattern to such
improvements for most technologies. This pattern of increasing returns to
diffusion and transfer is important for the transition to sustainable energy
futures, and it needs to be incorporated more explicitly into the scenarios.
In case A, there are substantial learning-curve effects for all
new, and currently marginal, energy production and conversion technologies.
These developments are consistent with the technological perspectives given in
chapters 7 and 8. Thus there are considerable advances in hydrocarbon
exploration, extraction, and conversion, carbon removal and storage, renewable
and nuclear electricity generation, and hydrogen and biofuel production and
conversion. For case B, the learning-curve effects are also substantial,
especially for new, environmentally desirable technologies. But they lag on
average 30 percent behind those in case A, which is consistent with the less
concentrated RD&D efforts in case B. For case C, learning-curve effects by
design favour low-carbon fossil and renewable technologies. These technologies
benefit from improvements equal to those in case A. All other technologies
develop as in case
B.
International energy trade and security
Generally a lot of trade takes place in the scenarios, ranging
from capital goods to energy. Energy-related trade in capital goods includes
plant and equipment - required, for example, for the adoption of environmentally
friendly technologies. So not only trade in energy is important in the
scenarios. An analysis of the energy trade flows implied by the scenarios
reveals a general decline in the share of primary energy (equivalent) that is
traded world-wide. Currently about 18 percent of global primary energy is traded
among the main world regions (as defined in the IIASA-WEC study). This is in
close agreement with the true country-by-country figure for 1990 of about 19
percent (Nakicenovic, Gr�bler, and McDonald, 1998). Crude oil and oil products
are currently dominant, accounting for 78 percent of global energy trade; coal
accounts for 13 percent and natural gas for 9 percent. By 2050 primary energy
traded declines to between 11 and 16 percent. In comparison, oil and gas imports
to Western Europe were about 34 percent of primary energy consumption in 1990,
and oil imports to North America were about 16 percent of primary energy
consumption the same year. But absolute volumes continue to increase in the
scenarios - up to a factor of 2.5 for case A and a factor of 1.7 for case B. The
increase in case C is much lower, at 10-40 percent. Energy trade in case C is
limited primarily to sustainable energy forms (such as biomass, methanol,
ethanol, and to a lesser degree hydrogen) and actually shrinks beyond 2050. This
indicates that even in case C scenarios world trade in oil and gas continues to
increase, despite a shift towards stronger reliance on renewable energy sources
throughout the new century.
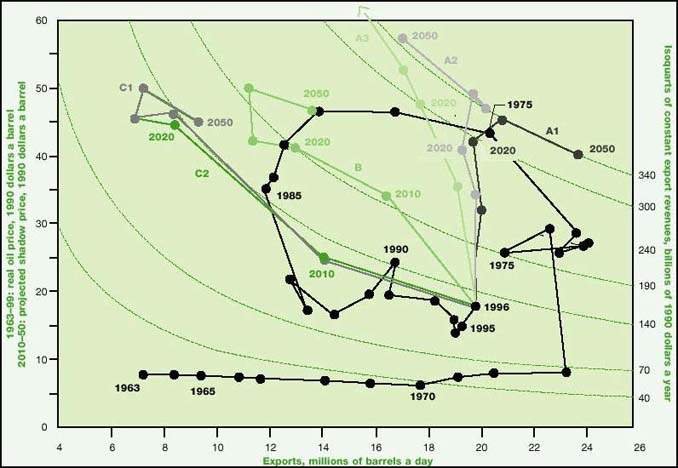
FIGURE 9.8. OIL EXPORT QUANTITIES,
PRICES, AND REVENUES FOR THE MIDDLE EAST AND NORTH AFRICA, 1963-96, AND IN SIX
SCENARIOS, 2010-2050
Source: Nakicenovic, Gr�bler, and McDonald,
1998.
The overall geopolitical shift in energy use from industrialised
regions to today’s developing regions across all scenarios is also
reflected in energy trade. In 1990 OECD imports accounted for 84 percent of
international energy trade. By 2020 OECD-country shares drop to 55 percent in
case C and 65 percent in case B, and by 2050 to 10 percent in case C and 34
percent in case A. This shift is likely to erode the current position of OECD
countries as the dominant energy buyers. Conversely import security concerns,
which traditionally have been strong in import-dependent Western Europe and
Japan, will increasingly be shared by today’s developing regions (chapter
4). Concerns about absolute import needs will also grow in developing countries
in comparison with OECD countries.
The prospects for oil-exporting regions are bright in the long
run across all scenarios, and, at least through 2050, oil revenue is unlikely to
be below $170 billion (in 1998 dollars) a year in the Middle East and North
Africa. But there are differences among the three cases, as shown in figure 9.8.
In case C, environmental policies reduce fossil fuel (that is, taxes and
regulation) demand and cause declining exports, but rising export prices keep
revenue constant. In cases A and B, technological change and the speed at which
reserves are replenished from the resource base (chapter 5) determine export
prices, export volumes, and revenues. In case A, greater technological progress
than in case B enables higher export at slightly elevated export prices, and
long-term revenues may exceed $360 billion (in 1998 dollars) annually. The
slower the rate of technological change, the more important the price component
becomes in revenue generation. Export volumes slip as reserves are replenished
more slowly, prices rise, and revenues vary as a function of the
scenario-specific oil substitution possibilities. Long-term export revenues for
the region exceed $360 billion a year in case A and are at least $240 billion a
year in case B, and thus are substantially higher than at present.
|
BOX 9.3. ENERGY SCENARIOS FOR THE NEWLY INDEPENDENT STATES
OF THE FORMER SOVIET UNION
Two scenarios of future energy developments for the former
Soviet Union, considered to include characteristics of sustainable development
from the regional perspective, are labelled “optimistic” and
“probable” (Makarov, 1999). The optimistic scenario is similar in
character to IIASA-WEC case A in that rapid globalisation of markets, vigorous
technological development, and increasing concerns for the environment are
assumed. The probable scenario has a number of characteristics in common with
IIASA-WEC case B. It basically represents a world where the optimistic scenario
is implemented more moderately.
After the recovery from the current recession in 2000-10, both
scenarios envisage rapid economic growth. In the optimistic case, per capita
income levels reach $10,000 by about 2030; in the probable scenario, by about
2040. Energy intensities are also assumed to improve, with economic growth
reversing the recent increases as the consequence of the deep recession.
The primary energy requirements range from 44 exajoules in the
probable scenario to 50 exajoules in the optimistic scenario by 2050, in
comparison with 57 exajoules in 1990. Energy intensity improvements lead to
generally lower energy requirements despite vigorous economic development. These
energy requirements correspond to 137-145 gigajoules per capita by 2050, in
comparison with almost 200 gigajoules per capita in 2050.
Already in 1990, 50 percent of final energy was delivered to
consumers in the form of high-quality energy carriers such as electricity, gas,
and district heat. The quality of final energy improves further in both
scenarios.
Electricity and gas exports grow consistently in both scenarios,
providing clean fuels to emerging energy markets in Europe and Asia. Gas is an
essential transition fuel in the scenarios because it is so well-matched to the
pervasive trend in consumer preferences for high-quality, clean, flexible
convenient final energy delivered by grids.
Both scenarios are characterised by declining energy sector
investments as a share of GDP, to 2.3-3.0 percent by 2050. In absolute terms the
cumulative financing requirements between 2000 and 2020 are in the range of
$500-$700 billion.
Concerns about possible climate change are considered limited in
the two scenarios for two reasons. First, the recession of the 1990s left the
region with other pressing economic, social, and environmental priorities.
Second, the energy development outlined in the two scenarios results in
emissions that are well below the 1990 levels specified for Russia and Ukraine
in the Kyoto Protocol. The difference between these specified emissions levels
and the much lower emissions in the two scenarios through 2050 (way beyond Kyoto
commitments) is an asset potentially worth money if and when the Kyoto Protocol
enters into force. |
Another potential exporter of fossil energy is the former Soviet
Union, where natural gas will be the principal energy export (box 9.3). Gas
exports from this region increase for all scenarios, from 4 exajoules in 1990 to
a relatively narrow range of 11-12 exajoules in 2020 and diverge afterwards
across the scenarios, as shown in figure 9.9. By 2050 annual exports range up to
27 exajoules, and annual revenues reach $150 billion (1990 dollars; $180 billion
in 1998 dollars).
Overall, crude oil and oil products remain the most traded
energy commodities through 2050. The spread is quite large, ranging between 77
percent in case A and 33 percent in case C. After 2050 methanol, piped natural
gas, LNG, and to a lesser extent also hydrogen become the key traded energy
commodities. Electricity, an important component of regional energy trade, and
is thus considered in the scenarios but is not important in global energy trade.
As noted above, trade and investment in technologies will be very important.
In general the global energy trade pattern shifts from primary
to secondary energy forms, which improves trade flexibility and lowers energy
security concerns. For example, methanol and hydrogen can be produced from a
number of primary sources ranging from coal to biomass (chapters 7 and 8).
Biofuels and eventually hydrogen production leave more value added in the
exporting regions than the export of primary energy. Exporting secondary energy
forms becomes a staple source of income for a number of developing regions.
Nevertheless oil- and gas-exporting regions generally increase their export
revenues even in the more sustainable scenarios, indicating that improved energy
efficiency and a shift towards other energy sources would not necessarily erode
the position of energy-exporting
regions.
Environmental issues at the local and regional scales
Local environmental impacts are likely to continue to take
precedence over global change in the achievement of sustainable energy
developments. According to the IIASA-WEC study, the natural capacity of the
environment to absorb higher levels of pollution is also likely to become a
limiting factor on the unconstrained use of fossil fuels. This also appears to
be the case in many other sustainable energy scenarios. Increasing income would
also lead to a higher demand for cleaner energy end uses in rural areas
world-wide. This includes a shift away from cooking with wood and coal in
inefficient traditional open fireplaces. Such a change would reduce indoor
pollution levels, currently estimated to be 20 times higher than in
industrialised countries.
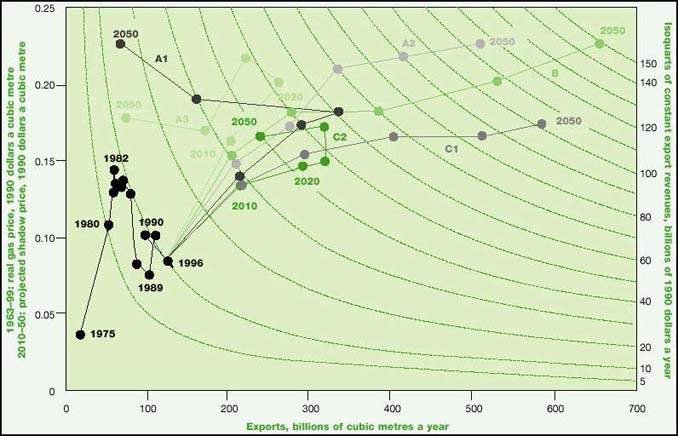
FIGURE 9.9. NATURAL GAS EXPORT
QUANTITIES, PRICES, AND REVENUES FOR THE FORMER SOVIET UNION, 1975-96, AND IN
SIX SCENARIOS, 2010-2050
Source: Nakicenovic, Gr�bler, and McDonald,
1998.
A particularly urgent environmental problem in densely populated
metropolitan areas is the high concentration of particulate matter and sulphur
dioxide. Here cleaner fuels, such as natural gas, and active abatement measures
will be required. Regional air pollution could also prove problematic,
especially in the rapidly growing, densely populated, coal-intensive economies
of Asia. In the booming cities of China and Southeast Asia, high levels of air
pollution must be addressed with appropriate measures (box 9.4).
According to the findings of the IIASA-WEC study, one of the
scenarios (A2), with a high dependence on coal (assuming no abatement measures),
would result in high sulphur dioxide emissions and significant regional
acidification, causing key agricultural crops in the region to suffer acid
deposition 10 times the sustainable level before 2020. Figure 9.10 shows excess
sulphur deposition above critical loads in Asia for the unabated A2 scenario.
According to this scenario, emissions could triple in Asia by 2020, and ambient
air quality in South and East Asia could deteriorate significantly in both
metropolitan and rural areas. Sulphur deposition would reach twice the worst
levels ever observed in the most polluted areas of Central and Eastern Europe
(for example, in the so-called black triangle between the Czech Republic,
Germany, and Poland). Of critical importance for economically important food
crops in Asia is that unabated sulphur emissions would cause critical loads to
be exceeded by factors of up to 10. As a result severe losses in crop production
could occur over large areas of Asia. In contrast to this dire outlook of
possible consequences of unabated sulphur emissions in coal-intensive A2, A3 and
C are relatively benign, leading to some, but not alarming, excess emissions in
the future; perhaps more important, by the middle of the 21st century global
sulphur emissions would be reduced to well below current levels.
|
BOX 9.4. ENERGY SCENARIOS FOR CHINA
Five scenarios are considered for China. The first is a baseline
scenario; the other four illustrate different strategies to achieve more
sustainable development from a regional perspective (Zhou, 1999).
The baseline scenario is intended to represent a practical,
feasible fulfilment of future energy demand with low risk. It is assumed that
GDP will expand by 22.7 times between 1990 and 2050, while energy demand will
increase relatively modestly by about 1.7 times during the same period. This is
due to vigorous improvement of energy intensities in combination with rapid
economic growth. The future energy supply in the baseline scenario continues to
be dominated by coal, however, with substantial technology and efficiency
improvements. The main limitations and concerns are related to potential adverse
environmental impacts. In particular, this coal-intensive baseline scenario is
likely to lead to air pollution and energy-related emissions that substantially
exceed acceptable levels. This is the main reason for the formulation of
alternative development paths that fulfil the development objectives of China,
but with substantially lower adverse environmental impacts.
The four sustainable scenarios explore alternative measures and
policies to reduce the environmental burden of energy. The first scenario
focuses on strengthening energy conservation. It is estimated that the energy
conservation potential, if fully utilised, could reduce energy demand in China
by 12 percent relative to the baseline by 2050. The second alternative scenario
focuses on adoption of clean coal technologies. The main advantage of this
scenario is that it would allow for the use of large domestic coal resources
while curbing air pollution and sulphur emissions. But it would still lead to
high carbon dioxide emissions. The third scenario focuses on renewable energy
sources as replacements for coal. The fourth scenario focuses on nuclear energy,
including breeder reactors, as a replacement for coal.
Combinations of these alternative scenarios were also
considered, resulting in a substantial decrease in the ultimate share of coal to
below 40 percent by 2050. Nevertheless coal remains the most important energy
source across all these alternatives. Thus one of the conclusions is that a high
priority should be placed on developing and diffusing clean coal technologies -
in addition to conservation - in the four more sustainable scenarios. This
strategy could lead to mitigation of 40 percent of future sulphur emissions (for
example, in the second alternative scenario, at relatively modest increases in
investment requirements, sulphur emissions decline from 23.7 million tonnes in
1995 to 13.5 millions tonnes in 2050). The energy conservation scenario had the
advantage of low financing requirements and the lowest carbon dioxide emissions
- but at the expense of a 60 percent increase in sulphur emissions. In contrast
the clean coal scenario achieves a 40 percent reduction of sulphur emissions but
has the highest carbon dioxide emissions. The renewable and nuclear energy
scenarios lead to reductions in emissions at all scales, but the reductions in
sulphur and carbon dioxide are not very large (10 percent and 20 percent), while
the investment costs are very high. |
People world-wide already suffer from local and regional air
pollution, and both governments and individuals are taking steps to improve the
situation. These actions are part of the drive towards higher efficiencies and
cleaner fuels and may also contribute to the shift towards a more sustainable
development path. They also have the positive spin-off effect of reducing carbon
emissions and possible global warming, although that is not their principal
motivation.
Consequently emissions of sulphur aerosol precursors portray
very dynamic patterns in time and space in most sustainable energy scenarios, in
contrast to the development in many reference scenarios (see figure 9.10). A
detailed review of long-term global and regional sulphur emission scenarios is
given in Gr�bler (1998a). Most recent scenarios recognise the significant
adverse impacts of sulphur emissions on human health, food production, and
ecosystems. As a result scenarios published since 1995 generally assume various
degrees of sulphur controls to be implemented in the future and are thus
substantially lower than previous projections. Other developments, such more
sulphur-poor coals and clean fossil technologies and a shift towards renewables
and natural gas in scenarios A3 and C, help promote substantial additional
emissions reductions as ancillary benefits.
A related reason for lower sulphur emission projections is the
recent tightening of sulphur-control policies in OECD countries that continue to
dominate global emissions, such as the amendments to the U.S. Clean Air Act and
implementation of the Second European Sulphur Protocol. These legislative
changes were not yet reflected in previous long-term emission scenarios, as
noted in Alcamo and others (1995) and Houghton and others (1995). The median
from newer sulphur-control scenarios is consequently significantly lower
relative to the older scenarios, indicating a continual decline in global
sulphur emissions.
Scenarios A3 and C include a host of environmental control
measures that help reduce emissions of sulphur dioxide and other pollutants.
This is consistent with most of the scenarios that lead to a long-term,
sustainable decline of particulate and sulphur levels, which would return
emission levels to those of 1900. As a general pattern, global sulphur emissions
do rise initially in recent scenarios, but eventually decline even in absolute
terms after 2050. The spatial distribution of emissions changes markedly,
generally from OECD regions to rapidly developing regions in Asia, and varies
across scenarios.
In the sustainable IIASA-WEC scenarios (A3 and C), emissions in
OECD countries continue their recent declining trend, reflecting a tightening of
control measures. Emissions outside OECD countries, most notably in Asia,
initially rise and then decline, resembling the current trend in OECD emissions.
The reductions are especially pronounced in the C scenarios because of a virtual
transition to the post-fossil era by 2100, essentially eliminating sulphur
emissions. A3 leads to substantial sulphur declines, even though it has the same
economic growth prospects as A2. There are many reasons. First, clean coal
technologies, such as gasification, remove sulphur as an inherent property of
the conversion process. Then there is a shift in fossil energy supply to low
sulphur-grade coals, higher shares of natural gas, and later to non-fossils as
well. Over the long term sulphur emissions decline in both scenarios throughout
the world, but the timing and magnitude
vary.
Climate change: Land use and other global issues
One important implication of the varying pattern of particulate
and sulphur emissions across the scenarios is that the historically important,
but uncertain, negative radiative forcing of sulfate aerosols may decline in the
very long run (Hulme, 1997; chapter 3). This means that the current cooling
effect on the climate that results from the emissions of particulates and
sulphur aerosols would diminish, causing additional, spatially different
patterns of climate change. This view is also confirmed by the model
calculations reported in Subak, Hulme, and Bohn (1997), Nakicenovic, Gr�bler,
and McDonald (1998), Nakicenovic (2000), Smith and others (forthcoming), and
Wigley (1999) and is based on recent long-term greenhouse gas and sulphur
emission scenarios. This means that precursors of air pollution and
acidification at the local and regional levels have an important role in global
climate change. But emissions of greenhouse gases such as carbon dioxide
continue to be the main source of climate warming.
Cumulative future CO2 emissions are in the first
approximation indicative of potential climate change (chapter 3). Carbon dioxide
emissions are the major anthropogenic source of climate change, and energy is
the most important source of CO2 emissions. A number of energy
scenarios in the literature account for the emissions of other greenhouse gases
and thus provide a more complete picture of possible implications for climate
change. For simplicity, only energy-related sources of CO2 emissions
are evaluated here.
Figure 9.11 shows the CO2 emissions of the six
IIASA-WEC scenarios superimposed on the emissions range of the energy scenarios
from the literature. The range is very wide by 2100, from more than seven times
current emissions to almost none for scenarios that assume a complete transition
away from fossil energy. The emission profiles are different across the range of
scenarios. Most portray a continuous increase throughout the 21st century,
whereas the sustainable scenarios generally have lower, more dynamic emission
profiles. Some of them curve through a maximum and decline.
For the scenarios in the literature, the distribution of
emissions by 2100 is very asymmetrical and portrays a structure resembling a
trimodal frequency distribution: those with emissions of more than 30 gigatonnes
of carbon (20 scenarios), those with emissions of 12-30 gigatonnes of carbon (88
scenarios), and those with emissions of less than 12 gigatonnes of carbon (82
scenarios). Most of the scenarios in this lowest cluster are situated at 2-9
gigatonnes of carbon; this cluster appears to include many of the sustainable
energy scenarios, and the second and third clusters most likely include only a
few of them. The lowest cluster may have been influenced by many analyses of
stabilising atmospheric concentrations, for example at 450 and 550 parts per
million by volume (ppmv), in accordance with the United Nations Framework
Convention on Climate Change (UNFCCC, 1992).
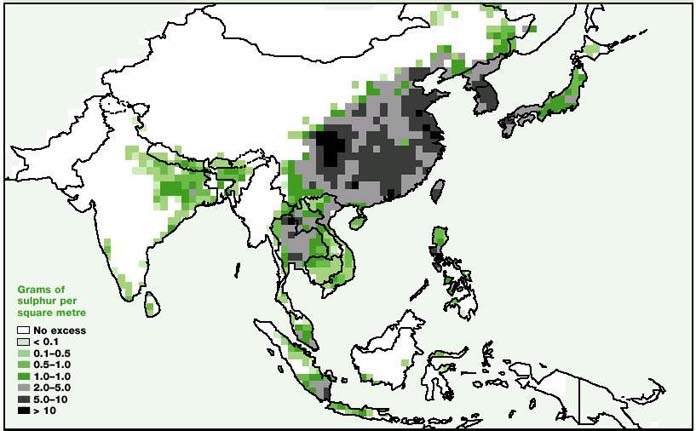
FIGURE 9.10. EXCESS SULPHUR
DEPOSITION ABOVE CRITICAL LOADS IN ASIA FOR AN UNABATED A2 SCENARIO, 2020
Source: Amann and others, 1995.
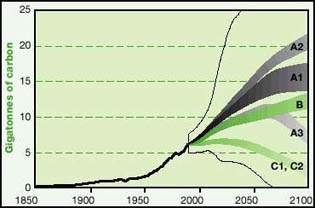
FIGURE 9.11. GLOBAL CARBON
EMISSIONS FROM FOSSIL FUEL USE, 1850-1990, AND IN SIX SCENARIOS, 1990-2100
For each scenario, the range shows the difference
between gross and net emissions. Gross emissions are actual carbon dioxide
released into the atmosphere. Net emissions include deductions for carbon
absorption (through biomass regrowth and sequestration). The figure also shows
the wider range of emissions for 190 scenarios in the literature. The vertical
line that spans the scenario range in 1990 indicates the uncertainty across the
literature of base-year carbon emissions.
Source: Nakicenovic, Gr�bler, and McDonald, 1998; Morita and
Lee, 1998.
The cumulative carbon emissions between 1990 and 2100 are 540
gigatonnes in the case C scenarios, 1,000 gigatonnes in B, 1,210 gigatonnes in
A1, 1,450 gigatonnes in A2, and 910 gigatonnes in A3. Thus A3 and C have both
the lowest cumulative emissions and lowest annual emissions towards the end of
the century. Accumulated emissions across the scenarios between 1990 and 2100
are shown in table 9.1 as well as the resulting atmospheric carbon dioxide
concentrations. Table 9.1 shows that the rising carbon dioxide emissions in
cases A and B lead to atmospheric carbon concentrations of 530-730 ppmv in 2100.
This compares with concentrations of 280 ppmv around 1800 (the beginning of the
fossil-fuel age) and current concentrations of 370 ppmv. A3, which includes
characteristics of sustainability, leads to the lowest atmospheric
concentrations of all A scenarios, about 530 ppmv by 2100. In B and A1, carbon
concentrations approach 590 and 620 ppmv, respectively, by 2100. The
concentrations of the coal-intensive A2 scenarios are the highest, 730 ppmv by
2100, about twice current levels. Only C scenarios lead to relatively benign
concentration levels of less than 450 ppmv (chapter 3).
Thus all scenarios except case C approach the doubling of
pre-industrial carbon concentrations. And again in all scenarios except C,
concentrations continue to rise throughout the 21st century. On the basis of
current knowledge, an increase of carbon concentrations to 600 ppmv by the end
of the 21st century could lead to an increase in the mean global surface
temperature of about 2.5 degrees Celsius, assuming the mean climate sensitivity
and with an uncertainty range of 1.5-4.5 degrees Celsius (chapter 3).
The C scenarios are the only ones in which carbon concentrations
stabilise by 2100, reflecting their ambitious emission reduction profile, from 6
gigatonnes in 1990 to 2 gigatonnes in 2100. After peaking at about 450 ppmv
around 2080, carbon concentrations slowly begin to decline as natural sinks
absorb excess carbon dioxide. The present carbon cycle models indicate that the
emissions reduction to about 2 gigatonnes of carbon a year (or about a third to
at most half the current global emissions) is an essential prerequisite for
eventually achieving stabilisation of atmospheric concentrations. This is the
reason why all other scenarios, including A3, result in continuously increasing
concentrations over the time horizon (although A3 is consistent, with
stabilisation at 550 ppmv in the 22nd century, assuming that the emissions would
further be reduced to about 2 gigatonnes of carbon a year).
Even with its ambitious emission reduction measures, C’s
atmospheric carbon concentrations rise by up to 90 ppmv during the 21st century.
This increase is about equal to the concentration rise since the onset of
industrialisation until today (from 280 to 370 ppmv during the past 200 years).
Thus even in C, some climate change appears inevitable: perhaps 1.5 degrees
Celsius (with an uncertainty range of 1.0-2.5 degrees Celsius) in increased
global mean surface temperature. This illustrates both the legacy of our past
dependence on fossil fuels and the considerable lead times required for an
orderly transition towards a zero-carbon economy and sustainable development
paths. It also illustrates the long residence time of carbon in the atmosphere.
Some of the carbon dioxide emissions from Watt’s first steam engine are
still airborne.
Both IIASA-WEC scenarios with characteristics of sustainability,
C and A3, are situated within the lowest cluster with emissions found in the
literature, at 2-9 gigatonnes of carbon by 2100. Thus they appear to cover the
range of future emissions associated with sustainable development quite well -
their range excludes only the most extreme emission scenarios found in the
literature. This leads to a substantial overlap in emission ranges across
different scenarios. In other words a similar quantification of the driving
forces that are all consistent with various concepts of sustainable development
can lead to a wide range of future emissions. Because this result is of
fundamental importance for assessing climate change and sustainable development,
it warrants further discussion.
Another interpretation is that a given combination of driving
forces is not sufficient to determine future emission paths. A particular
combination of forces, such as those specified in the three IIASA-WEC case A
scenarios, is associated with a whole range of possible emission paths. These
three A scenarios jointly cover the largest part of the scenario distribution
shown in figure 9.11. But only one of them, A3, can be characterised as
sustainable. The three scenarios explore different specific structures of future
energy systems, from carbon-intensive development paths to high rates of
decarbonisation. All three otherwise share the same assumptions about the
driving forces. This indicates that different structures of the energy system
can lead to basically the same variation in future emissions as can be generated
by different combinations of the other main driving forces - population,
economic activities, and energy consumption levels - with basically the same
structure of the energy system. The implication is that decarbonisation of
energy systems - the shift from carbon-intensive to less carbon-intensive and
carbon-free sources of energy - is of similar importance as other driving forces
in determining future emission paths.
Figure 9.12 shows the degree of decarbonisation achieved in the
scenarios relative to historical trends and the range observed in scenarios from
the literature. Carbon intensity of primary energy is shown as an indicator of
decarbonisation. The carbon intensity improves across all IIASA-WEC scenarios,
but is especially pronounced in the three with characteristics of
sustainability, C1, C2, and A3. Sustained decarbonisation requires the
development and successful diffusion of new technologies. An important
implication of the varying interplay of the main scenario driving forces is that
investments in new technologies during the coming decades might have the same
magnitude of influence on future emissions as population growth, economic
development, and levels of energy consumption taken together. Thus high or low
emissions can be associated with a range of social and economic scenarios; the
distinguishing feature of the low emissions and low pollution scenarios is that
the policies and technologies are in place to reduce emissions. But countries
will be better placed to implement climate-friendly policies if development, in
its broadest sense, is successful.
|
The long-term transition to new
energy technologies will
largely
be determined by technological
choices made in the
next 10-30
years. |
Furthermore decarbonisation also means that other environmental
impacts tend to be lower (Nakicenovic, 1996). Thus the energy systems structure
of IIASA-WEC scenario A3 is one of the main determinants of its sustainability.
In contrast, C scenarios require fundamental changes that encompass energy end
use as well. In many ways the transitions in the structures of the energy
systems described by the scenarios cannot be seen in isolation from the overall
development path towards sustainability. Other scenarios presented in the
IIASA-WEC study do not appear to be consistent with the characteristics of
sustainability given in table 9.2. This result suggests that the future
direction of technological change in the energy system is not only important for
reducing the dangers of climate change but can also help nudge the overall
development path in the direction of sustainability.
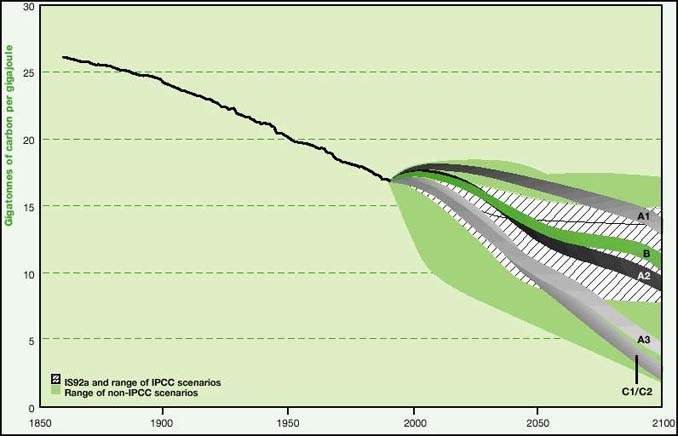
FIGURE 9.12. GLOBAL CARBON
INTENSITY OF PRIMARY ENERGY, 1850-1990, AND IN SIX SCENARIOS, 1990-2100,
RELATIVE TO THE SCENARIOS FROM THE LITERATURE AND THE IPCC IS92 SCENARIOS
Source: Nakicenovic, Gr�bler, and McDonald,
1998.
Conclusion
Scenarios are frequently used to assess sustainable development
paths. Sustainable futures often are easier to illustrate when they are compared
with other scenarios that contradict some of the conditions for achieving
sustainability. This is one of the reasons that, in recent studies, sustainable
scenarios are usually included among alternative futures. This class of
sustainable scenarios can be characterised by low environmental impacts at all
scales and more equitable allocation of resources and wealth relative to the
current situations and other alternative future energy developments. Recently
IIASA and WEC presented a set of six global and regional scenarios (Nakicenovic,
Gr�bler, and McDonald, 1998). Three of the scenarios describe futures with
characteristics of sustainability. They are used in this chapter to illustrate
the measures and policies for the near-term future that would be required to
move away from other alternative but unsustainable development paths. A single
reference scenario is used to outline quite positive future developments, but
they do not fulfil the essential conditions for achieving sustainability.
One of the three sustainable scenarios, C1, is consistent with
most of the conditions and concepts of sustainable development advanced in this
report. It presents a rich and green future and presents a fundamentally
different future development path that includes both substantial technological
progress and unprecedented international cooperation centred on environmental
protection and international equity - it includes a high degree of environmental
protection at all scales, from eradication of indoor air pollution to low
impacts on climate change, with an active redistribution of wealth and very high
levels of energy efficiency and conservation. Thus it fulfils most of the
criteria for sustainable development - such as increasing both economic and
ecological equity among world regions and countries - and leads to a
significantly lower impact on the climate than scenarios with higher greenhouse
gas emissions This scenario requires a virtually complete transition away from
reliance on fossil energy sources and towards renewable energy sources.
Two variants of this scenario were considered. One of them, C2,
foresees a nuclear phaseout by 2100. Both are characterised by a high degree of
energy conservation and vigorous efficiency improvements throughout the whole
energy system and among end users. Consequently total energy requirements are
relatively low relative to the high levels of affluence and quality of life,
especially in today’s developing regions. The achievement of such a future
is indeed challenging, and ranges from devising new RD&D policies to
bringing to market new energy technologies, to imposing energy and carbon taxes
as incentives for improving energy efficiency and conservation and increasing
the shift away from fossil fuels.
|
Local environmental impacts are
likely to continue to take
precedence
over global change in the
achievement of sustainable
energy
developments. |
The second scenario that includes characteristics of
sustainability, A3, is fundamentally different in nature and quite similar to
the reference scenario except in the future structure of the energy system. Thus
environmental protection and higher levels of affluence are achieved less
through changes in levels of energy end use and structure and more through a
dedicated decarbonisation of the energy system. Again efficiency improvements
are important, and clean fossils such as natural gas are foreseen as gaining
much larger shares of global energy needs, along with renewable sources of
energy - all contributing towards decarbonisation. Decarbonisation is in part
also achieved through more sophisticated energy conversion and processing that
includes carbon removal along with more conventional pollutants.
These scenarios illustrate different levels of compatibility
between future energy systems and sustainable development. C1 shows the highest
level of compatibility with sustainable development characteristics. It
exemplifies that the energy aspects of the major issues analysed in chapters 1-4
can be addressed simultaneously. But C1 should be taken only as one illustration
of an energy system compatible with a sustainable development future. Other
combinations of primary energy sources and energy use levels might be equally or
more compatible with sustainable development, as illustrated by C2 and A3,
depending on the level of success with the development and dissemination of new
technologies (chapters 6-8). For example, if the carbon sequestration options
discussed in chapter 8 are realised, there need not be a large conflict between
using coal and reducing carbon emissions, and the fossil fuel share in a
sustainable future could be much larger than in C1, as illustrated in A3
scenario.
All sustainable scenarios, including the three IIASA-WEC
scenarios described in this chapter in detail, have positive (desirable) and
normative (prescriptive) elements. They usually include strong assumptions about
desirable futures and prescribe how such futures can be achieved. Common to most
is that they show that sustainable futures are not achievable with current
policies and prevailing development trends. Their achievement often requires a
fundamental change or major paradigm shift. Thus sustainable energy scenarios
are often designed to offer policy guidance on managing, for example, an orderly
transition from today’s energy system, which relies largely on fossil
fuels, towards a more sustainable system with more equitable access to
resources.
More global studies are considering futures with radical policy
and behavioural changes to achieve a transition to a sustainable development
path during the 21st century. The great merit of RD&D policies, diffusion,
and the adoption of new technologies associated with market-based instruments
for environmental change is that radical developments often proceed gradually
from seemingly moderate policies, leading to major improvements over time. But
they require continuity over decades so that the cumulative effects of moderate
polices can result in radical change. These are some of the crucial
characteristics of the three IIASA-WEC scenarios that lead towards sustainable
development.
Another central feature of these three scenarios is that
adequate provision of energy services and more equitable allocation of resources
are crucial for achieving sustainability. At the same time, energy use is a main
cause of environmental degradation at all scales and so can inhibit the
achievement of sustainability. Thus environmental protection - from indoor
pollution to climate change - is an essential element of sustainable development
in these scenarios. Rapid development and clean, efficient energy are
complementary elements of most of the scenarios. The resolution of these future
challenges offers a window of opportunity between now and 2020. Because of the
long lifetimes of power plants, refineries, and other energy investments, there
is not a sufficient turnover of such facilities to reveal large differences
among the alternative scenarios presented here before 2020, but the seeds of the
post-2020 world will have been sown by then.
The choice of the world’s future energy systems may be wide
open now. It will be a lot narrower by 2020, and certain development
opportunities that are forgone now might not be achievable later. There may well
be environmental irreversibilities, but technical changes may still take place,
and it is a question of whether they will be too late rather than whether they
will occur at all. Perhaps more important is the question of development
initiatives directed at eradicating poverty, disease, and illiteracy in the
world, and whether they will be timely and sufficient to offset currently
inadequate efforts. The achievement of sustainable development dictates a global
perspective, a very long time horizon, and immediate policy measures that take
into account the long lead times needed to change the system.
Notes
1. Table 9.2 provides a number of indicators that can be used to
characterise the achievement of sustainable development in energy scenarios and
shows how the three scenarios selected for this assessment fare relative to one
another.
2. Energy prices are an important determinant in the short to
medium term. But in the long term, technology and policy are more important
determinants, although important feedback mechanisms do exist - for example, in
the form of induced technical change. As a result future levels of energy demand
can vary widely, even for otherwise similar scenario characteristics, in terms
of population and level of economic development.
References
Alcamo, J., A. Bouwman, J. Edmonds, A. Gr�bler, T. Morita, and
A. Sugandhy. 1995. “An Evaluation of the IPCC IS92 Emission
Scenarios.” In Houghton, J.T., L.G. Meira Filho, J. Bruce, Hoesung Lee, B.
A. Callander, E. Haites, N. Harris, and K. Maskell, eds., Climate Change
1994: Radiative Forcing of Climate Change and An Evaluation of the IPCC IS92
Emission Scenarios. Cambridge: Cambridge University Press for the
Intergovernmental Panel on Climate Change.
Amann, M., J. Cofala, P. D�rfner, F. Gyarfas, and W. Sch�pp.
1995. “Impacts of Energy Scenarios on Regional Acidifications.” In WEC
Project 4 on Environment, Working Group C, Local and Regional Energy Related
Environmental Issues. London: World Energy Council.
Barro, R.J. 1997. Determinants of Economic Growth.
Cambridge, Mass.: MIT Press.
Barro, R.J., and X. Sala-I-Martin. 1995. Economic Growth.
New York: McGraw-Hill.
Bos, E., and M.T. Vu. 1994. World Population Projections:
Estimates and Projections with Related Demographic Statistics, 1994-1995
Edition. Washington, D.C.: World Bank.
De Vries, B., J. Bollen, L. Bouwman, M. den Elzen, M. Janssen,
and E. Kreileman. 2000. “Greenhouse Gas Emissions in an Equity-,
Environment - and Service-Oriented World: An IMAGE-Based Scenario for the Next
Century.” Technological Forecasting & Social Change 63 (2-3).
Gallopin, G., A. Hammond, P. Raskin, and R. Swart. 1997.
Branch Points. PoleStar Series Report 7. Boston: Stockholm Environment
Institute Boston Center.
Glenn, J.C., and T.J. Gordon, eds. 1997. “State of the
Future: Implications for Actions Today.” American Council for the United
Nations University, Millennium Project, Washington, D.C.
Goldemberg, J., T.B. Johansson, A.K. Reddy, and R.H. Williams.
1988. Energy for a Sustainable World. New Delhi: Wiley Eastern.
Gr�bler, A. 1994. “A Comparison of Global and Regional
Energy Emission Scenarios.” WP-94-132. International Institute for Applied
Systems Analysis, Laxenburg, Austria.
Gr�bler, A. 1998a. “A Review of Global and Regional Sulfur
Emission Scenarios.” Mitigation and Adaptation Strategies for Global
Change 3 (2-4): 383-418.
Gr�bler, A. 1998b. Technology and Global Change.
Cambridge: Cambridge University Press.
Hammond, A. 1998: Which World? Scenarios for the 21st
Century, Global Destinies, Regional Choices. London: Earthscan.
H�fele, W., ed. 1981. Energy in a Finite World: A Global
Systems Analysis. Cambridge, Mass.: Ballinger.
Hanke, T. 1995. “Die M�rke spielen verr�ckt [in
German].” Die Zeit 18: 33.
Houghton, J.T., L.G. Meira Filho, J. Bruce, Hoesung Lee, B. A.
Callander, E. Haites, N. Harris, and K. Maskell, eds. 1995. Climate Change
1994: Radiative Forcing of Climate Change and an Evaluation of the IPCC IS92
Emissions Scenarios. Cambridge: Cambridge University Press for the
Intergovernmental Panel on Climate Change.
Hulme, M. 1997. “Comment on the First Draft of the Sulfur
Discussion Paper.” Climate Research Unit, University of East Anglia,
Norwich, U.K.
IEA (International Energy Agency). 1993. Cars and Climate
Change. Paris: Organisation for Economic Co-operation and Development.
IEA (International Energy Agency). 1998. World Energy
Outlook. Paris: Organisation for Economic Co-operation and Development.
IIASA-WEC (International Institute for Applied Systems Analysis
and World Energy Council). 1995. Global Energy Perspectives to 2050 and
Beyond. Laxenburg, Austria: International Institute for Applied Systems
Analysis.
Ishitani H., T.B. Johansson, S. Al-Khouli, H. Audus, E. Bertel
and others. 1996. “Energy Supply Mitigation Options.” In R.T. Watson,
M.C. Zinyowera, and R.H. Moss, eds., Climate Change 1995 - Impacts,
Adaptation and Mitigation of Climate Change: Scientific Analysis. Cambridge
University Press for the Intergovernmental Panel on Climate Change.
Johansson, T.B, H. Kelly, A.K.N. Reddy, and R.H. Williams. 1993.
“Renewable Fuels and Electricity for a Growing World Economy: Defining and
Achieving the Potential.” In T.B. Johansson, H. Kelly, A.K.N. Reddy, and
R.H. Williams, ed., Renewable Energy: Sources for Fuels and Electricity.
Washington, D.C.: Island Press.
Kram, T., K. Riahi, R.A. Roehrl, S. van Rooijen, T. Morita, and
B. de Vries. 2000. “Global and Regional Greenhouse Gas Emissions
Scenarios.” Technological Forecasting & Social Change 63 (2-3).
Lazarus, M.L., L. Greber, J. Hall, C. Bartels, S. Bernow, E.
Hansen, P. Raskin, and D. von Hippel. 1993. Towards a Fossil Free Energy
Future: The Next Energy Transition. Technical Analysis for Greenpeace
International. Boston: Stockholm Environmental Institute Boston Center.
Leggett, J., W.J. Pepper, and R.J. Swart. 1992. “Emissions
Scenarios for IPCC: An Update.” In J.T. Houghton, B.A. Callander, and S.K.
Varney, eds., Climate Change 1992: The Supplementary Report to the IPCC
Scientific Assessment. Cambridge: Cambridge University Press for the
Intergovernmental Panel on Climate Change.
Lutz, W., W. Sanderson, and S. Scherbov. 1997. “Doubling of
World Population Unlikely.” Nature 387 (6635): 803-05.
Makarov, A.A. 1999. “Newly Independent States of the Former
Soviet Union.” Paper prepared for the World Energy Assessment. United
Nations Development Programme, New York.
Manne, A., and R. Richels. 1994. “The Costs of Stabilizing
Global CO2 Emissions: A Probabilistic Analysis Based on Expert
Judgements.” Energy Journal 15 (1): 31-56.
Morita, T., and H.-C. Lee. 1998. “IPCC SRES Database,
Version 0.1, Emission Scenario.” Database prepared for IPCC Special Report
on Emissions Scenarios, https://www-cger.nies.go.jp/cger-e/db/ipcc.html
Nakicenovic, N. 1996. “Freeing Energy from Carbon.”
Daedalus 125 (3): 95-112.
Nakicenovic, N. 2000. “Greenhouse Gas Emissions
Scenarios.” Technological Forecasting & Social Change 65 (3).
Nakicenovic, N., A. Gr�bler, and A. McDonald, eds. 1998.
Global Energy Perspectives. Cambridge: Cambridge University Press.
Nakicenovic, N., N. Victor, and T. Morita. 1998. “Emissions
Scenarios Database and Review of Scenarios.” Mitigation and Adaptation
Strategies for Global Change 3 (2-4): 95-120.
Nakicenovic, N., J. Alcamo, G. Davis, B. de Vries, J. Fenhann,
and others. 2000. Special Report on Emissions Scenarios by the
Intergovernmental Panel on Climate Change. Cambridge: Cambridge University
Press for the Intergovernmental Panel on Climate Change.
Nordhaus, W.D., and G.W. Yohe. 1983. “Future Paths of
Energy and Carbon Dioxide Emissions.” In W.A. Nierenberg, ed., Changing
Climate: Report of the Carbon Dioxide Assessment Committee. Washington,
D.C.: National Academy Press.
Pepper, W.J., J. Leggett, R. Swart, J. Wasson, J. Edmonds, and
I. Mintzer. 1992. “Emissions Scenarios for the IPCC. An Update:
Assumptions, Methodology, and Results. Support Document for Chapter A3.” In
J.T. Houghton, B.A. Callandar, and S.K. Varney, eds., Climate Change 1992:
Supplementary Report to the IPCC Scientific Assessment. Cambridge: Cambridge
University Press for the Intergovernmental Panel on Climate Change.
Raskin, P., G. Gallopin, P. Gutman, A. Hammond, and R. Swart.
1998. Bending the Curve: Toward Global Sustainability. Report of the
Global Scenario Group, PoleStar Series Report 8. Stockholm: Stockholm
Environment Institute.
Rostow, W.W. 1990. The Stages of Economic Growth. 3rd
edition. Cambridge: Cambridge University Press.
Schipper, L., and S. Meyers. 1992. Energy Efficiency and
Human Activity: Past Trends, Future Prospects. Cambridge: Cambridge
University Press.
Schwartz, P. 1991. The Art of the Longview: Three Global
Scenarios to 2005. New York: Doubleday.
Shell International Ltd. 1996. The Evolution of the
World’s Energy Systems. The Hague: Shell International.
Shell International Ltd. 1998. People and the Environment:
The 1997 Shell International Exploration and Production Health, Safety and
Environment Report. The Hague: Shell International.
Smith, S.J., T.M.L. Wigley, N. Nakicenovic, and S.C.B. Raper.
Forthcoming. “Climate Implications of Greenhouse Gas Emissions
Scenarios.” Technological Forecasting & Social Change.
Solow, R. 1956. “A Contribution to the Theory of Economic
Growth.” Quarterly Journal of Economics 70: 56-94.
S�rensen, B., B. Kuemmel, and P. Meibom. 1999. “Long-Term
Scenarios Global Energy Demand and Supply.” IMFUFA [Department of Studies
in Mathematics and Physics and their Functions in Education, Research and
Applications], Roskilde University, Roskilde, Denmark.
Subak, S., M. Hulme, and L. Bohn. 1997. The Implications of
FCCC Protocol Proposals for Future Global Temperature: Results Considering
Alternative Sulfur Forcing. CSERGE Working Paper GEC-97-19. Centre for
Social and Economic Research on the Global Environment, University of East
Anglia, Norwich, U.K.
Tol, R.S.J. 1995. “The Climate Fund Sensitivity,
Uncertainty, and Robustness Analyses.” W-95/02, Institute for Environmental
Studies, Climate Framework. Vrije Universiteit, Amsterdam.
UN (United Nations). 1996. Annual Populations 1950-2050: The
1996 Revision. New York: UN Population Division (data on diskettes).
UN (United Nations). 1997. United Nations Commission on
Population and Development, Thirteenth Session, Report of the Secretary General
on Progress on Work in the Field of Population in 1996. New York: United
Nations.
UN (United Nations). 1998. World Population Projections to
2150. New York: Population Division, UN Department of Economics and Social
Affairs.
UNDP (United Nations Development Programme). 1997. Human
Development Report 1997. Oxford: Oxford University Press.
UNFCCC (United Nations Framework Convention on Climate Change).
1992. “United Nations Framework Convention on Climate Change.”
UNEP/WMO Information Unit of Climate Change (IUCC) on behalf of the Interim
Secretariat of the Convention. IUCC, Geneva.
UNFCCC (United Nations Framework Convention on Climate Change).
1997. “Kyoto Protocol to the United Nations Framework Convention on Climate
Change.” FCCC/CP/L7/Add.1, 10 December 1997. United Nations, New York.
WBCSD (World Business Council for Sustainable Development).
1998. “Exploring Sustainable Development.” Geneva.
Wigley, T.M.L. 1999. “The Science of Climate Change. Global
and U.S. Perspectives.” PEW Center on Global Climate Change, Arlington, Va.
WEC (World Energy Council). 1993. Energy for Tomorrow’s
World. London: Kogan Page.
Zhou, F. 1999. “China’s Future Energy Scenario
Analysis.” Paper prepared for the World Energy Assessment. United Nations
Development Programme, New
York.
Chapter 10. Rural Energy in Developing Countries
Jos� Goldemberg (Brazil)
LEAD AUTHORS: Amulya K.N. Reddy (India), Kirk R.
Smith (United States), and Robert H. Williams (United States)
|
ABSTRACT
Supplying modern energy services to the 2 billion people who
still cook with traditional solid fuels and lack access to electricity is
probably one of the most pressing problems facing humanity today. The amount of
energy needed to satisfy the basic needs of rural populations around the world
is relatively small, and appropriate technologies are available. However,
widening access to modern energy services is limited by the extreme poverty
found particularly in the least developed countries.
Living standards in rural areas can be significantly improved
by promoting a shift from direct combustion of biomass fuels (dung, crop
residues, and fuelwood) or coal in inefficient and polluting stoves to clean,
efficient liquid or gaseous fuels and electricity. Although consumers tend to
shift to these modern, higher-quality energy carriers as their incomes rise and
the carriers become more affordable, the process is slow. Yet a shift to such
carriers can reduce the damage to human health and the drudgery associated with
continued reliance on inefficient, polluting solid fuels.
This chapter describes experience with and prospects for
improving the technologies used to cook with biomass in several countries, as
well as the development of clean, non-toxic cooking fuels. Progress in rural
electrification-using both centralised, grid-based approaches and small-scale,
decentralised technologies-is also described.
Technological developments alone, however, will not improve
access or promote greater equity. New institutional measures are also needed,
including financing to cover the initial capital costs of devices and equipment.
Energy initiatives will be most successful when integrated with other policies
that promote development. And because local populations will ultimately use,
maintain, and pay for energy services, they should be involved in making
decisions about energy systems. |
The lack of adequate energy services in rural areas of
developing countries has social dimensions (chapter 2) as well as serious
environmental and health effects (chapter 3). Many of these problems are
exacerbated by the almost exclusive reliance of rural populations in most areas
on traditional fuels coupled with simple technologies characterised by low
energy efficiency and harmful emissions. This chapter thus focuses on
technological opportunities, as well as other strategies, for delivering
adequate, affordable, cleaner energy supplies to rural areas.
The second half of the 20th century witnessed a strong
urbanisation trend and the emergence of megacities (those containing more than
10 million people) in most developing countries. Between 1970 and 1990 the share
of people living in cities grew from 28 to 50 percent. But while the rural
population relatively decreased during this period, the absolute number of
people living in rural areas increased to 3 billion. Despite this, rural
development often remains low on government agendas because of increasing
demands of growing, politically and economically dominant urban populations.
Thus the explosive growth of cities makes it difficult for policy-makers to give
rural development the attention it deserves.
The dispersed character of rural populations and their low
commercial energy consumption result in poor capacity utilisation efficiency for
transmission and distribution systems and other energy infrastructure. Extending
an electric grid to a few households in a rural setting can result in energy
costs of up to $0.70 per kilowatt-hour, seven times the cost of providing
electricity in an urban area (World Bank, 1996). Thus conventional approaches to
extending energy infrastructure are economically inefficient, for both public
and private providers-which is another reason the energy problems of rural
populations are given low priority by governments.
Because the poor people in rural areas lack access to
electricity and modern fuels, they rely primarily on human and animal power for
mechanical tasks, such as agricultural activities and transport, and on the
direct combustion of biomass (wood, crop residues, dung) for activities that
require heat or lighting. Human energy is expended for household work (gathering
and preparing biomass for fuel, fetching water, washing clothes), agriculture,
and small industry. Biomass fuels are typically used for cooking (which
dominates inanimate energy consumption in most warm regions), space heating,
heating water for bathing, and meeting some industrial heating needs. Kerosene
is used predominantly for lighting, and to a small extent in rural industry.
Although much of the world’s rural population has no access to electricity
generation, many have small battery-operated devices such as radios and
flashlights.
Rungs on the energy ladder
Large amounts of human energy are spent gathering fuelwood in
many parts of the world, and the burden tends to fall more heavily on women and
children.1 Although there are exceptions, history has generally shown
that when alternatives are available and affordable, consumers opt for more
modern energy carriers. As incomes rise and opportunities for using better
technologies become available, consumer preferences shift to more efficient,
convenient, cleaner energy systems as they become more affordable. That is,
consumers move up the energy ladder (chapter 3). This involves a shift to modern
energy carriers or to more convenient and energy-efficient conversion devices.
|
Accelerating the
introduction of modern energy
is a key
strategy for promoting
sustainable development
in rural areas. |
For cooking and other heating purposes, the lowest rungs on the
energy ladder involve use of dung or crop residues, with fuelwood, charcoal,
kerosene, and liquefied petroleum gas (LPG) or natural gas representing
successively higher rungs. For lighting, the lowest rung is represented by fire,
followed in turn by liquid-fuelled (such as kerosene) lamps, gas lanterns, and
electric bulbs. To do mechanical work, consumers shift from human and animal
energy to diesel fuel and electricity as soon as they become available, because
they are almost always more cost-effective. Often a synergy between modern
energy carriers and more efficient end-use devices occurs.
One of the aims of this chapter is to explore the technological,
economic, social, and institutional prospects for more rapidly introducing
modern energy carriers into rural areas-which would allow households to move
quickly to the top of the energy ladder, ideally skipping (leapfrogging) some of
its rungs. Accelerating the introduction of modern energy, then, is a key
strategy for promoting sustainable development in rural areas of developing
countries. Principally, it involves providing:
· Clean liquid or
gaseous fuels for cooking, and electricity for lighting and other basic
household amenities.
· Liquid fuels and electricity
to mechanise agriculture.
· Electricity
sufficiently low in cost to attract industrial activity to rural areas (thereby
providing well-paying jobs and helping to stem migration to urban
settlements).
It is desirable to skip rungs and advance to the highest rungs
on the energy ladder wherever feasible.2 But because the 2 billion
rural poor live in many different circumstances, a complete range of approaches
need to be explored, and those that work best in each set of circumstances need
to be encouraged. Appropriate public policies should be implemented to
accelerate the process and reduce human suffering.
Satisfying basic human needs with modern energy carriers
requires relatively small amounts of energy in absolute terms. In regions that
do not require space heating, final household energy requirements for satisfying
basic needs are estimated to be about 2,000 kilocalories per capita per day, or
0.1 kilowatt per capita in average power provided (80 percent for cooking and 20
percent for electricity; Reddy, 1999). The cooking needs of the 2 billion people
not served by modern fuels correspond to about 120 million tonnes of oil
equivalent of LPG a year-which equals 1 percent of global commercial energy
consumption or 3 percent of global oil consumption. This is less than is
currently lost flaring natural gas in oil fields and refineries.
Thus commercial energy requirements for satisfying basic needs
in rural areas are truly modest. Yet provision of even these modest amounts of
energy to rural areas would offer the potential for enormous increases in
amenities, particularly if these modern energy carriers were coupled with
energy-efficient end-use devices.3
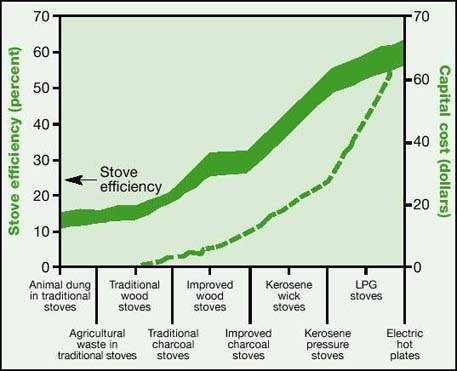
FIGURE 10.1. EFFICIENCY OF STOVES
WITH COMMERCIAL AND NON-COMMERCIAL FUELS
Source: Baldwin, 1987.
Progress in delivering modern energy to rural areas has been
slow. But as will be shown, technical options to provide rural people with
access to convenient, affordable energy services are commercially available (or
nearly so). This is particularly the case in regions where modern energy
carriers, such as biogas or producer gas, can be derived from local biomass and
where gathering biomass feed-stock can provide opportunity for income
generation. The challenge of making modern energy available to the very poorest
households is primarily institutional, notwithstanding the economic costs and
risks inherent in developing and disseminating untried systems. New financial
mechanisms and other innovative policy approaches are needed, as discussed
below.
Fuels in rural areas: climbing the energy ladder
The oldest human energy technology, the home cooking fire,
persists as the most prevalent fuel-using technology in the world. For much of
the world’s population, household fuel demand makes up more than half of
total energy demand. The energy ladder (discussed briefly above and in chapter
3) is used here as a framework for examining the trends and impacts of household
fuel use. As figure 10.1 illustrates, the fuel-stove combinations that represent
rungs on the ladder tend to increase in cleanliness, efficiency, and
controllability. Conversely, capital cost and dependence on centralised fuel
cycles also tend to increase with movement up the ladder.
Shortages of local wood supplies combined with institutional and
economic constraints on petroleum-based fuels often lead to household coal use,
which is widespread in Eastern Europe, China, and South Africa. Coal has a
higher energy density than wood and so is easier to store. Coal’s high
energy density also makes it cost-effective to ship over longer distances than
wood to efficiently supply urban or rural markets. In these senses, coal is
similar to other household fossil fuels. Unlike kerosene and gas, however, coal
often represents a decrease in cleanliness relative to wood. Like wood, another
solid fuel, coal is difficult to use efficiently in household appliances.
|
BOX 10.1. COMPARISON OF STOVE PROGRAMMES IN CHINA AND
INDIA |
|
China |
India |
|
The programme focused on areas with the greatest need and
selected pilot counties with biomass fuel deficits. |
The programme was implemented country-wide, resulting in
dispersion of effort and dilution of financial resources. |
|
Direct contracts between the central government and the county
bypassed much bureaucracy. This arrangement generated self-sustaining rural
energy companies that manufacture, install, and service stoves and other energy
technologies. |
The programme administration was cumbersome, moving from the
centre to the state level, then to the district, and finally to the taluka,
where the stove programme is just one of many national efforts being
implemented locally by the same people. |
|
Local rural energy offices run by provincial governments are in
charge of technical training, service, implementation, and monitoring for the
programmes. These efforts are separately funded and relatively independent.
|
Lack of a strong monitoring plan was a severe weakness in early
programmes. Some improvement has occurred through assignment of the task to
university-based technical backup units. Coverage is still incomplete, however.
|
|
Stoves are not only suitable for fuel savings and reduction of
household smoke, but also are designed for convenience and attractiveness,
highlighting the lessons learned from problems in early programmes that stressed
only fuel savings. |
India has made a wide variety of attempts to integrate
efficiency and convenience, which have suffered from the top-down structure of
the programme. |
|
Stove adopters pay the full cost of materials and labour. The
government helps producers through stove construction training, administration,
and promotion support. |
Stove adopters pay about half the cost of stoves; the government
pays the rest. As a result the producer’s incentive to construct stoves is
oriented towards the government. |
|
Emphasis has been on long-lived stoves made of ceramic or metal
and otherwise designed to be a significant household asset for a number of
years. |
Many of the stoves have been made from local materials and by
villagers without artisanal skills, resulting in short lifetimes in day-to-day
household use. |
Source: Smith and others, 1993; Barnes and
others, 1993; Ramakrishna, 1991a, b.
Climbing the energy ladder for cooking can be accomplished using
commercially available technologies such as improved cooking stoves and kerosene
or LPG. As discussed below, biogas and producer gas are almost at the point of
commercialisation, and additional and cleaner advanced technologies for meeting
cooking needs are under
development.
Improved cooking stoves
Since about 1980, several hundred programmes around the world
have focussed on developing and disseminating improved biomass cooking stoves in
the villages and urban slums of the developing world. These programmes have
ranged in size from the introduction of a few hundred stoves by local
non-governmental organisations to huge national efforts in China and India that
have affected millions of households. The programmes seek to accelerate the
natural trend for people to move towards cleaner, more efficient devices when
they are available and affordable.
Such programmes have had mixed success. Some have disseminated
many improved stoves with significant lifetimes. Others have not. The failures,
however, represent progress along a learning curve, and more recent programmes
have tended to have higher success rates. In this regard, it is instructive to
compare the two largest initiatives, those of China and India (box 10.1).
Over the past 20 years, perhaps 90 percent of world-wide
installations of improved cooking stoves occurred in China. From 1982-99 the
Chinese National Improved Stoves Programme reported the installation of improved
stoves in more than 175 million rural households. These were mainly biomass
stoves used for cooking. But in the northern states of China, where temperatures
drop during the winter, dual-use stoves for cooking and heating were included.
In China improved stoves are affordable, and the government contribution is low.
An improved stove in China costs about 85 yuan ($10), and the government
contributes an average of 4.2 yuan per stove ($0.84). Part of the success of the
programme is attributed to the attention-including well-publicised national
competitions and awards-given to improved stove design.
The Indian programme, initiated in 1983, is called the National
Programme on Improved Chulhas (cooking stoves). So far, nearly 30 million stoves
have been disseminated. A mix of portable (without chimneys) and fixed designs
have been approved. The government subsidises at least half of the costs of the
stoves, which amounts to 200 rupees ($4.50) per stove. Although dissemination
has been impressive, follow-up surveys suggest that less than one-third of the
improved stoves are still in use. Some reasons given for discontinuing use are
that the stoves did not really save energy, did not eliminate smoke, or broke
down. Other surveys found that adopters felt that stoves were consuming less
energy and producing less smoke. The mixed perceptions indicate differing levels
of success in implementation.
Several lessons can be learned from the two programmes. The
greater success in China can be attributed to programme design and
implementation, including the factors described in box 10.1. Both programmes now
face pressure to reduce subsidies in a more market-based approach. In addition,
although both programmes now incorporate monitoring for energy efficiency,
neither includes evaluations of the smoke-exposure benefits.
|
The cooking needs of the 2 billion people
not served by
modern fuels correspond
to about 1 percent of global
commercial energy
consumption
or 3 percent of global
oil consumption. |
Another commonly cited example of success is the introduction of
a more efficient ceramic charcoal cooking stove, the jiko, developed in
Kenya. At. least 700,000 such stoves are now in use in that country, in more
than 50 percent of urban homes and in about 16 percent of rural homes.
About 200 small-scale businesses and artisans produce more than
13,000 stoves each month. Both the stove itself and the general programme for
disseminating it have been adapted for use in a number of other African nations
(table 10.1).
The process of research, development, demonstration, and
commercialisation that led first to the improved jiko and then to other
high-efficiency stoves was seeded by international and local development funds
(in contrast to the Indian and Chinese programmes, which were almost entirely
organised and funded domestically). Most important, policy-makers decided not to
directly subsidise the production and dissemination of these stoves but to
provide support to designers and manufacturers.
Because the stoves were relatively expensive ($15) and their
quality was highly variable, sales were slow at first. But continued research
and increased competition among manufacturers and vendors spurred innovations in
both the materials used and the methods of production. An extensive marketing
network for those stoves is flourishing, and prices have fallen to $1-3,
depending on size, design, and quality. This outcome is consistent with the
learning curve theory, whereby the price of a new technology decreases by a
uniform amount (often about 20 percent) for each doubling of cumulative sales
(chapter 12).
Part of the success of the jiko, however, is due to its use of a
relatively high-quality fuel, charcoal. It is much easier to design simple
stoves with high energy efficiency for use with such low-volatility solid fuels
relative to those that use the unprocessed biomass that is the main source of
household energy in the world’s villages. Charcoal stoves are also
inherently less polluting than those burning unprocessed biomass, and thus do
not incorporate chimneys. Like other low-volatility solid fuels-such as some
coals-charcoal produces fewer health-damaging particles and gases than wood, but
it does produce substantial carbon monoxide. Households relying on such
low-volatility fuels, therefore, risk overnight carbon monoxide poisoning, which
annually causes thousands of deaths world-wide.
TABLE 10.1. NUMBER OF IMPROVED STOVES DISSEMINATED IN EAST
AND SOUTHERN AFRICA, 1995
|
Country |
Urban |
Rural |
Total |
|
Kenya |
600,000 |
180,000 |
780,000 |
|
Tanzania |
54,000 |
n.a. |
54,000 |
|
Uganda |
52,000 |
n.a. |
52,000 |
|
Ethiopia |
23,000 |
22,000 |
45,000 |
|
Rwandaa |
30,000 |
n.a. |
30,000 |
|
Sudan |
27,000 |
1,400 |
28,400 |
|
Zimbabwe |
11,000 |
10,000 |
21,000 |
|
Burundia |
20,500 |
n.a. |
20,500 |
|
Somaliaa |
15,400 |
n.a. |
15,400 |
n.a. - Not available. a. Civil strife has
significantly affected stove programmes and reduced the number of improved
stoves in use.
Source: Karekezi and Ranja, 1997.
In addition, the process of making charcoal from wood is often
quite inefficient, leading to heavy pressure on forests in much of Africa to
supply urban areas. The inefficiency of charcoal kilns means that the charcoal
fuel cycle is probably the most greenhouse-gas-intensive major fuel cycle in the
world, even when the wood is harvested renewably, and often it is not. Thus
charcoal could not be a sustainable rural energy option in the long run, unless
its supply system were to be drastically altered.
Even the best biomass stoves available today do not greatly
reduce the health-damaging pollution from biomass combustion, although they may
put it outside through well-operating chimneys or hoods. This is certainly
better than releasing the smoke inside; but in densely populated villages and
slums, it can lead to heavy neighbourhood pollution. Thus even nearby households
using clean (or no!) fuels may suffer from high levels of exposure. Therefore,
because of health concerns-unless truly clean-burning biomass stoves can be
developed at reasonable costs-in many areas, improved stoves are probably not
sustainable in the long run. They may continue to play an important interim role
in improving the quality of life of the rural and urban poor; but as concluded
in chapter 3, the long-term goal should be to eliminate household use of
unprocessed solid fuels.
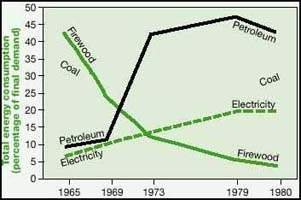
FIGURE 10.2. POST-BIOMASS ENERGY
TRANSITION IN THE REPUBLIC OF KOREA, 1965-80
Source: Baldwin, 1987.
|
Kerosene and LPG actually produce
fewer greenhouse gas
emissions
per unit of energy service
than biomass fuels used
in
traditional ways. |
Kerosene and liquefied petroleum gas
In countries that achieved successful rural development during
the past 50 years, kerosene and then LPG replaced biomass fuels. Figure 10.2
shows the changing household fuel picture in the Republic of Korea as rural
development proceeded in the 1960s. At the start of the period, wood was the
chief fuel, but 15 years later it had been replaced almost entirely by
petroleum-based fuels. Similar transitions have occurred in other regions as
well. Natural gas and town gas (made from coal) have continuing important roles
in urban development (but rarely in rural areas, because of pipeline
transmission requirements).
As consumers climb the energy ladder, kerosene is usually the
first modern fuel to be used, because it is more easily transported and stored
than LPG. However some countries-notably China-have restricted the availability
of kerosene, thereby encouraging the direct movement to LPG. Kerosene, although
substantially superior to biomass in efficiency and cleanliness, is not as
desirable as LPG, which burns nearly without pollution in comparison with fuels
on lower rungs. Of course, liquid and gaseous fuels pose other risks: For LPG,
the most important are fires and explosions; in the case of kerosene, children
may suffer poisoning due to careless household storage. Experience has shown,
however, that these risks are lower than those posed by biomass fuels.
LPG must be distributed in pressurised canisters that, along
with the stove, involve significant up-front investments by households. In
addition, both LPG and kerosene require a stable, reliable distribution system
running from the refinery to neighbourhood distributors, something that does not
exist in many parts of the developing world. The combination of these two
factors often prevents LPG from being used by many households that could
otherwise afford its daily cost. Indeed, in many developing-country cities, the
daily cost of LPG would be less than the cost of shipping biomass from rural
areas. Lack of capital for the stove and canister and poor supply reliability,
however, prevent households from shifting to LPG.
Despite these problems, LPG programmes have been very successful
in most of Latin America, particularly in Brazil, where LPG has replaced all
other fuels for cooking-even in many remote rural areas. The main reason for
this success was a very dependable system of distribution and replacement of LPG
canisters.
A study in Hyderabad, India, found that the simple measure of
stabilising LPG supplies by the local government encouraged many urban
households to shift to LPG. This is a policy without fuel subsidies that saves
money for households and has a beneficial impact on the environment (Barnes and
others, 1994). If users have a first-cost constraint, the programme should
provide low-interest loans towards initial costs. Subsidies to help households
meet the up-front costs for equipment such as stoves and canisters are much more
acceptable policies than subsidising fuel. Fuel subsidies alone tend to divert
use of fuel to industry, transport, and households that already have stoves,
making the subsidies very costly, economically inefficient ways to help the
poor.
Because fossil fuels such as kerosene and LPG are non-renewable
and their combustion contributes to greenhouse-gas emissions, some may question
their role in sustainable energy strategies. However, the quantity of LPG needed
to support cooking for the current unserved population of 2 billion is trivial
at the global level (see above). Moreover, kerosene and LPG actually produce
fewer greenhouse gas emissions per unit of energy service than biomass fuels
used in traditional ways (chapter 3).
Nevertheless, instead of relying on fossil fuels with
substantial new infrastructure requirements, it is sometimes desirable to
produce clean fuels that can be used efficiently from local biomass resources.
Biogas and producer gas systems, as well as advanced technology options such as
synthetic LPG or dimethyl ether (DME), appear promising in the longer
term.
Biogas for cooking
Biogas, a clean-burning methane-rich fuel gas produced through
anaerobic digestion (bacterial action in a tank without air) of suitable biomass
feedstocks, is the only biomass-derived modern energy carrier for household
applications with which there is widespread experience. Biogas can be generated
from cattle dung and animal wastes, and with substantially more difficulty, from
some crop residues. Although these feedstocks are frequently used directly as
cooking fuel, in most areas they are not preferred fuels and are used only when
wood is not available. Biogas systems offer multiple benefits. The
digester-effluent is usually a good fertiliser, and, if connected to latrines,
biogas plants can provide valuable sanitation services. For cooking and other
thermal household tasks, it is simple and reasonably efficient to use the gas
directly in conventional low-pressure gas burners. Biogas can also provide
lighting when used in mantle lamps.
In societies where suitable feedstocks are readily available,
small family-sized biogas digesters were thought to have considerable potential.
A number of countries initiated programmes-China and India on a large scale.
Results have been mixed, especially in the early stages. China’s efforts
resulted in the construction of 7 million household-scale digesters from
1973-78. But quality control and management problems resulted in a large number
of failures. More recently, coordinated efforts have focused on regions thought
to be most promising for the technology. Service organisations and biogas
services stations have been established. By 1994, 5 million domestic plants were
operating satisfactorily. India’s experience has been on a slightly smaller
scale, but the numbers are still impressive-by the end of 1998, almost 2.8
million domestic plants were installed. India’s Ministry of
Non-Conventional Energy Sources has identified a potential for 12 million
digesters.
Biogas experience in Africa has been on a far smaller scale and
has been generally disappointing at the household level. The capital cost,
maintenance, and management support required have been higher than expected.
Moreover, under subsistence agriculture, access to cattle dung and to water that
must be mixed with slurry has been more of an obstacle than expected. However,
possibilities are better where farming is done with more actively managed
livestock and where dung supply is abundant-as in rearing feedlot-based
livestock.
|
BOX 10.2. BIOGAS IN NEPAL
The principal objective of the Biogas Support Programme in Nepal
is to promote the wide-scale use of biogas as a substitute for the wood,
agricultural residues, animal dung, and kerosene that presently meet the cooking
and lighting needs of most rural households in the country. The rising demand
for locally available biomass from a rapidly increasing population has helped
accelerate the rates of deforestation, soil degradation, and environmental
decline in densely inhabited areas. In addition, use of biomass fuels and
kerosene has compromised health and welfare-especially of women and children,
who are most often subjected to the smoke and fumes associated with the use of
these fuels.
Since its inception, the programme has installed more than
40,000 family-size biogas units benefiting more than 200,000 members of rural
households. The programme’s target is to install an additional 100,000
units by the middle of 2003. This compares to only 6,000 biogas units installed
before the programme. This substantial increase has been achieved while
simultaneously reducing the costs and increasing the reliability and efficiency
of biogas plants.
A critical element in developing the commercial market for these
plants has been the programme’s innovative financial engineering and
judicious application of consumer subsidies. The subsidy, fixed at three levels,
accounted for 35 percent of the total cost of biogas plants in 1998. The
objective of the programme is to eliminate dependency on direct subsidies by
2003. The programme has also strengthened institutional support for the biogas
market.
At the start of the programme, essentially only one state-owned
company, the Gobar Gas Company, was producing biogas plants. By the end of 1998,
as a direct result of market development, 38 private companies besides Gobar had
entered the business. To be eligible to receive the subsidy provided to farmers,
all participating companies must meet strict production quality and service
standards for their plants. As a result of the growing competition, technical
design modifications, and better quality control measures, the overall cost of
biogas plants in Nepal has declined by more than 30 percent since 1992. In
addition to the institutional improvements, employment for skilled as well as
unskilled labour in rural areas has been generated. |
Source: Mendis, 1999.
The initial enthusiasm for biogas has thus been somewhat
dampened by experience. Because of its requirement for relatively large amounts
of animal dung, the niche for household biogas plants is likely to remain small.
Poor families do not have access to enough dung, and better-off families with
sufficient animals often prefer to purchase fuel and fertiliser rather than
spend time gathering dung and managing the often-temperamental digesters. Even
so, in the right social and institutional context, and with appropriate
technical expertise, the potential for biogas remains significant. These
conditions seem to have been achieved in the Biogas Support Programme in Nepal
through an innovative financial scheme (box
10.2).
Producer gas for cooking
An alternative to biogas is producer gas, a mixture consisting
largely of carbon monoxide, hydrogen, and nitrogen. Producer gas is generated in
a thermochemical conversion process through partial oxidation in air of biomass
feedstocks (Stassen, 1995). The basic principles of generating producer gas have
been known since the 18th century. Producer gas derived from biomass has been
used for domestic and industrial heating purposes, for cooking, for stationary
power, and for motor vehicle applications. (During World War II more than a
million gasifier-powered vehicles helped to keep basic transport systems running
in Europe and Asia.)
During periods of peace and wide availability of cheap, more
convenient fossil fuels, interest in biomass-derived producer gas has been low.
The energy crises of the 1970s rekindled interest in producer gas technology,
but interest waned again with the collapse of world oil prices in the mid-1980s.
Once again, there is growing interest in technology for making producer gas from
biomass for cooking, heating, and electricity generation. Power generation
applications of producer gas are discussed later in this chapter. Here the focus
is on domestic cooking.
Part of the reason for renewed interest in producer gas
technology is increasing concern about the adverse health effects of indoor air
pollution caused by biomass and coal burned for domestic cooking and heating
(chapter 3) and the large role that producer gas used in gas-burning stoves
could play in reducing this pollution-the air pollution from these stoves is
nearly zero. In typical agricultural regions, the energy generation potential
from producer gas is greater than that from biogas, because crop residues tend
to be more abundant than dung.4 And whereas biogas generation is
often the preferred energy conversion technology for making use of the energy
content of dung, producer gas generation is a far easier approach for exploiting
the energy content of crop residues.
In addition, because it is a chemical rather than biological
process, producer gas manufacture is not sensitive to ambient temperature,
greatly increasing the potential geographic extent of its application. Another
reason for renewed interest in biomass-derived producer gas in China is a severe
new air pollution problem caused by the burning of crop residues in fields-a
consequence of the rising affluence of farmers (see the annex to this chapter).
This problem is forcing a search for new productive uses of crop residues.
Several Chinese provinces are making efforts to convert residues
into producer gas in centralised village-scale gasifiers and to distribute the
cooking gas by pipes to households. For example, the Shangdong Academy of
Sciences has developed crop residue gasifiers and centralised households meet
equipment such gas supply system technology for are much cooking gas
applications, and 20 such policies village-scale gasification systems are
operating in the province (Dai and Lu, fuel. 1998). Monitoring and assessment of
a village experience in Shangdong Province (case 1 in the annex) shows that
current technology has considerable consumer appeal and would be highly
competitive if the gas were properly priced. The technology for making producer
gas from crop residues promises to be widely deployable for cooking
applications, and thus to largely solve the indoor air pollution problem caused
by stoves that burn biomass or coal.
TABLE 10.2. GLOBAL POPULATION AND ACCESS TO ELECTRICITY,
1970-90 (MILLIONS OF PEOPLE)
|
Country |
1970 |
1980 |
1990 |
|
World population |
3,600 |
4,400 |
5,300 |
|
Rural population |
2,600 |
3.000 |
3,200 |
|
With access to electricitya |
610 |
1,000 |
1,400 |
|
Without access to electricity |
2,000 |
2,000 |
1,800 |
|
Percentage of rural population with access |
23 |
33 |
44 |
a. Access includes people living in villages
connected to power lines. This does not necessarily mean that most households
are hooked up to electricity.
Source: Davis, 1995.
|
Subsidies to help households meet
the up-front costs for
equipment such
as stoves and canisters are much
more acceptable
policies
than subsidising fuel. |
One problem posed by current gasifiers used in China is that
they produce substantial tars (condensable hydrocarbons that are scrubbed from
the gas before delivery to consumers). If disposed of without adequate treatment
to groundwater or surface water, these tar wastes would pose significant water
pollution problems. Moreover, the option of using crop residues or producer gas
for cooking will not solve the air pollution problem in China that arises from
burning excess crop residues in the field. The producer gas option is about
twice as efficient as direct combustion in providing cooking services, so that
only about half as much residue is required for cooking relative to
direct-combustion stove systems.5 At the national level, use of just
60 percent of all crop residues potentially available for energy purposes would
be adequate to meet all rural cooking needs.
In addition, the producer gas cooking option poses another
public health risk: Typically, about 20 percent of producer gas is carbon
monoxide-of which accidental leaks into houses can be lethal. Although some
hydrocarbon impurities in the gas impart an odour to producer gas that is
usually noticed before a lethal dose is inhaled, occasional accidents are
inevitable. Therefore (as discussed below), safe, clean, advanced technological
options for producing cooking fuel from biomass should be the focus of research
and
development.
Rural electrification
Electricity is at the top of the energy ladder and is highly
efficient and convenient for some specialised cooking appliances, such as rice
cookers and microwave ovens. But for many years to come, electricity is unlikely
to be practical for general cooking in most rural areas of the developing world.
Nevertheless, for lighting, communication, refrigeration, and motor
applications, electricity is essential for a satisfactory quality of life.
Moreover, electricity is key to improving agricultural productivity through
mechanisation and is essential for many rural industrial activities.
Considerable progress has been made in rural electrification programmes designed
to extend electricity services to isolated villages (table
10.2).
The centralised approach
Between 1970 and 1990, 800 million people in rural areas gained
access to electricity. Yet of the 3 billion people living in rural areas of
developing countries in 1990, 2 billion were still without access to
electricity. This global total masks significant variations between regions and
countries. In particular, China’s rapid electrification programme-through
which 365 million rural residents gained access to electricity from
1970-90-significantly increased the world total. If China were excluded, current
access levels would drop from 44 to 33 percent, or exactly the level of
1980.6
The distinction between access to electricity by villages and
households should also be noted. India, for example, has an ambitious rural
electrification programme, targeting agricultural end use. But while 80 percent
of villages have electricity, less than 50 percent of households can afford it.
Several studies highlight an important point for economic
success: electrification cannot by itself ensure economic development. It is a
necessary but insufficient condition. Electrification works best when overall
conditions are right for rural income growth and when it is complemented by
social and economic infrastructure development-such as rural water supplies,
health programmes, primary and secondary education, and regional and feeder
roads. Thus rural electrification contributes to but is not a substitute for
other rural development measures.
Rural electrification programmes have typically concentrated on
connecting villages and remote areas to a national grid-often owned and operated
by a public utility. The tendency has been to extend the grid incrementally,
reaching towns and settlements in order of increasing capital costs. Thus remote
areas with small populations are likely to be the last to receive electricity.
Moreover, many rural areas face high transmission and distribution costs, for
several reasons:
· The capacity of
power lines is inefficiently used because of low population.
· Densities and demand levels
are low.
· Villages may have very peaky
(undiversified) demand profiles. Line losses tend to be high.
· In addition, incremental
extension of the grid (rather than extension optimised to minimise losses)
causes lines to be strung haphazardly, resulting in greater
losses.
The decentralised approach
Because of the problems of supplying grid electricity for small,
scattered, peaky loads, decentralised electricity generation is becoming more
attractive. With decentralised systems, the high costs of transmission and
distribution networks can be avoided. But small-scale, decentralised solutions
face other barriers. The decentralised generation technologies discussed below
are diesel-engine generator sets, small-scale hydropower, photovoltaics, wind,
and small-scale biopower using producer gas. No attempt is made to be
comprehensive on the technological opportunities for decentralised electricity
generation. Instead, the discussion illustrates key features of different
technologies, highlighting advantages and drawbacks for rural development needs.
Diesel-engine generator sets. Diesel generators are
common in many remote settlements, either for a single user or as part of a
local distribution network. Such systems may be operated by a power utility or,
more commonly, by private enterprises. Rural hospitals, government offices, and
police stations in remote areas typically have their own diesel generators.
Diesel sets with capacities of 50-500 kilowatts of electricity
are widely used in rural Latin America and Asia but have only recently been
disseminated in Africa. The electricity produced by diesel sets typically costs
$0.30 a kilowatt-hour-two to three times the cost of electricity from grids in
urban areas but still cost-effective relative to grid extension. (This cost is
typical of the Amazonia region of Brazil, where there are 900 diesel sets with a
total generating capacity of 391 megawatts.) The high costs of maintenance and
of transporting diesel fuel and lubricating oil to remote places make
electricity fairly expensive.7 Despite these costs, electricity is
typically highly valued by local populations because of the enormous
improvements in living standards that it brings (box 10.3). But while high-cost
electricity may be acceptable for satisfying basic needs in households and for
some agricultural and cottage industry applications, lower costs are needed to
attract a greater job-generating industrial base to rural areas.
Small-scale hydropower. Small-scale hydropower is a
locally available resource that in some regions can be exploited to deliver
electricity or mechanical power (for pumping water and other applications) to
rural areas. The resource potential for small-scale hydropower is discussed in
chapter 5; its technology, costs, and future prospects are discussed in chapter
7. Here the focus is on current activities and the prospects for using
small-scale hydropower to address rural development needs.
Small-scale hydropower technology, which is being pursued in
about 100 countries, is often divided into three categories: micro hydro (less
than 100 kilowatts), mini hydro (100-1,000 kilowatts), and small hydro (1-30
megawatts). By the end of 1994 China alone had 6,000 small-scale hydropower
stations with a total installed capacity of 15,650 megawatts, supplying 49
terawatt-hours of electricity (Qui and others, 1996)-29 percent of hydroelectric
power generation and nearly 8 percent of rural electricity consumption (Deng and
others, 1996). In 1989 China accounted for about 38 percent of world-wide small
hydropower (23.5 gigawatts), at which time more than 130 companies manufactured
equipment specifically for plants with capacities ranging from 10 kilowatts to
more than 10 megawatts. Of the 205 turbines ordered world-wide in 1989, the size
distribution was micro hydro, 15 percent; mini hydro, 57 percent; and small
hydro, 28 percent (Moreira and Poole, 1993). In China and Viet Nam even
sub-kilowatt systems have been sold for household electrification. Such turbines
are installed at the end of hose-pipes, with somewhat unreliable but serviceable
results. However, the potential market for such systems is limited by the
availability of water resources.
On a somewhat larger scale, hydropower plants of 50 kilowatts
and more can be used to electrify communities or small regions by establishing
mini grids. Costs are highly variable (chapter 7), depending on the site
topography, proximity of the site to the main load area, and hydrological
conditions.
Small-scale hydropower has one drawback: it is almost always
obtained from run-of-river plants that lack the reservoir capacity to store
water. Consequently, severe seasonal variations in power output may occur,
depending on a site’s hydrology. Thus the long-term viability of
small-scale hydropower may depend on backup electricity that is supplied either
locally or through the grid (Moreira and Poole, 1993).
Photovoltaics. Photovoltaic technology is cost-effective
in providing electricity to rural areas at the very smallest scales (typically
less than 100 watts) in areas with no access to grid electricity and where
electricity demand is characterised by such low levels and infrequency that even
diesel electricity cannot compete (see chapter 7 for details about photovoltaic
technology and its economics in such applications). The potential for
photovoltaic technology to support rural development arises from the fact that
it can be used for household lighting, radios, and television sets, and to
refrigerate medicines at rural clinics.
In 1999 global photovoltaic sales totalled 200 megawatts, 10
percent of which was for off-grid applications in rural areas of developing
countries. One important obstacle to wider rural deployment of photovoltaic
technology is the limited financing available for such small systems (see
section below on the time horizon for technological options). Kenya has the
world’s highest penetration rate of household photovoltaic systems, with
more than 80,000 systems in place and annual sales of 20,000 systems. Fifty
local and fifteen international importers, assemblers, installers, and
after-sales providers serve this market, which developed without significant
aid, subsidies, or other support. Although the current market is strong, there
is still a tremendous need to standardise equipment, as well as improve
batteries, lighting fixtures, and electronic ballasts used in integrated
household photovoltaic systems. In addition, possible credit arrangements need
to be studied, as do the relative advantages of leasing a system rather than
purchasing it.
In 1999 South Africa’s power utility, Eskom, entered into a
joint venture with Shell Solar Systems to provide 50,000 homes with
photo-voltaic systems in areas where grid connection is not considered feasible.
This three-year programme contributes to a market that is believed to exceed 2
million households. Customers pay a monthly rate to lease and use the equipment,
which allows a reasonable rate of return to Eskom.
|
BOX 10.3. DIESEL ENGINES IN A MULTIPURPOSE PLATFORM PROJECT
IN MALI
In Mali a project is under way to introduce, by 2003, 450
multipurpose platforms to provide, at the village scale, mechanical power and
electricity through diesel engines to 10 percent of the country’s rural
population. At least two-thirds of these platforms will be coupled to water and
electricity distribution networks. By 2003 rural access to electricity is
expected to be more than 3 percentage points higher than urban access. Although
the project is based on the use of diesel fuel oil, it is envisaged that in the
future pourghere nut oil or some other liquid biofuel will be used.
The engine selected for this project is a 1950s-vintage slow
diesel engine (a Lister engine, from India). This engine was chosen because of
its low initial capital cost; low prices for its spare parts; its ability to
operate without damage on the relatively low-quality diesel fuel typically
available in villages; its ease of operation, maintenance, and repair by local
artisans (blacksmiths, mechanics, carpenters); and the availability of a network
of sellers and servicers for it throughout much of Mali.
It is intended that the engine in a typical platform would power
various types of equipment, such as a cereal mill, husker, alternator, battery
charger, pump, welder, and carpentry machine. Thus the platforms would reduce
many rural women’s burdensome tasks (fetching water, grinding cereal);
offer them income-generating opportunities and management experience; and, as
they become more economically independent, help them improve their social
status. Because so many activities would be supported by the platforms, their
economic and social benefits would be felt at multiple levels, resulting in an
overall empowerment of women. In the pilot phase of the project (1996-98),
during which 45 platforms with 14 water or electricity networks were installed,
the platforms’ availability stimulated the creation, development, and
modernisation of artisanal activities in participating villages. The platforms
are being operated and maintained on a cost-recovery basis by private
enterprise.
By design, the acquisition of a multipurpose platform is a
demand-driven process. The initial request has to be made by a recognised,
registered women’s association at the grassroots level. International
donors are subsidising equipment costs (including the engine, mill, de-huller,
alternator, battery charger, and building) at up to $1,500 per module. In
situations where the supply of electricity and running water is requested, the
contribution of the international donor can be increased by up to $10,000 per
module. An equity contribution of at least 50 percent is required of the
women’s associations. Operation and maintenance costs are borne entirely by
beneficiaries.
The mechanical work provided by the engines costs about $0.25
per kilowatt-hour (see table). Notably, more than 70 percent of the cost is for
diesel fuel and lubricating oil, which must be imported into the region. If the
mechanical work were converted to electricity, the added cost associated with
the generator and conversion losses would increase the electricity cost to at
least $0.30 per kilowatt-hour. If liquid biofuels produced in the region
eventually could be substituted for imported oil, the region’s balance of
payments would be improved, although costs would probably not be reduced much or
at all, because liquid biofuels tend to be more costly than petroleum fuels.
Although this project is interesting in revealing consumer
wants, it is in its initial phase of implementation, and only experience will
supply information on real costs. Nevertheless, the project shows that there are
attractive alternatives to grid extension, that rural electrification does not
necessarily mean grid electrification, that decentralised electrification is a
serious option, and that entrepreneur-driven participatory development is
crucial. |
|
Cost of mechanical work for a diesel engine, Mali
multipurpose platform |
|
Cost |
Dollars per year |
Dollars per kilowatt- hour |
|
Capitala |
131 |
0.018 |
|
Fuelb |
1,140 |
0.138 |
|
Maintenance |
|
|
|
Every 100 hours |
|
|
|
|
Lubricating oil |
158 |
0.022 |
|
|
Other |
36 |
0.005 |
|
Every 500 hours |
179 |
0.025 |
|
Every 1,000 hours |
104 |
0.015 |
|
Every 1,500 hours |
74 |
0.010 |
|
Total |
1,820 |
0.233 |
|
a. For an 8-horsepower (6-kilowatt) Indian Lister diesel engine
with a 7-year plant life costing $600 (excluding the cost of a generator) and
operated 1,500 hours a year at 80 percent of rated capacity, on average, so that
the annual average capacity factor is 13.7 percent. Assuming a 12 percent
discount rate, the capital recovery factor is 21.9 percent a year.
b. For a diesel fuel price of $0.44 a litre and an engine
efficiency of 30 percent (higher heating value basis). |
Source: Mali and UNDP, 1999.
Still another approach to reach a greater portion of low-income
rural people was adopted by Soluz. This company developed a system to lease
small photovoltaic battery systems to provide high-quality electric services at
an affordable price while offering a positive financial return to its investors.
In 1993, with assistance from the Rockefeller Foundation, Soluz conducted a
pre-feasibility study for a solar electricity delivery company and construction
of a company prototype for 200 rural homes in the Dominican Republic. The
company installs standalone photovoltaic battery systems on or near rural homes
yet retains ownership of the systems. The photovoltaic systems provide lighting
and access to information services (through radio and television). Users make
regular payments, as determined in the lease agreement, and the company is
responsible for maintaining the systems.
In Central America customers pay a monthly fee of $15-20,
depending on the size of the photovoltaic system leased. The company has an
on-time collection rate exceeding 90 percent. Many customers are small
businesses, for whom the provision of high-quality energy services contributes
to increased profitability.
But even where appropriate financing is made available, the
poorest households often cannot afford photovoltaic systems (box 10.4). In
considering measures to support photovoltaic programmes for rural areas, it is
important to pay particular attention to the poorest households and to
strategies to make the technology available to them.
Although significant in improving the quality of life in rural
areas, without major cost reductions, photovoltaic technology will be limited
mainly to remote household and other small-scale applications and will not be
able to compete in the provision of electricity for manufacturing or even most
cottage industrial applications.
|
BOX 10.4. EQUITY ISSUES RELATING TO PHOTOVOLTAIC TECHNOLOGY
FOR RURAL AREAS IN INDIA
Of the 79 million rural households in India without electricity
(out of a total of 114 million rural households), 7, 17, and 75 percent of
households could afford, respectively, 37-watt (four-light), 20-watt
(two-light), and 10-watt (one-light) photovoltaic systems with Grameen-type
financing (five-year loans at 12 percent interest with a 15 percent down
payment; see box 10.7). Thus it appears that the poorest 25 percent of
households cannot afford any photovoltaic purchase, even with financing.
But such findings, which are based on willingness-to-pay
considerations, might be overly simplistic. The availability of lighting might
be exploited to earn extra income that could make a photo-voltaic system
affordable for even the poorest household. If, for example, a poor Indian
household could weave two extra baskets a night by the light made available by a
10-watt photovoltaic system, the technology would become affordable. |
Source: Reddy, 1999; Hande,
1999.
|
Household-scale
wind turbines (of about 100 watts)
offer
benefits to wind-rich regions
similar to those offered by
domestic
photovoltaic
systems. |
Wind. There are two promising ways to exploit wind power
to meet rural energy needs. The first is household units that provide
electricity at. scales where neither grid power nor mini-grid power from diesel
units is cost-effective. The second is village-scale wind-battery-diesel hybrid
systems (using wind turbines with capacities typically of 5-100 kilowatts).
Household-scale wind turbines (of about 100 watts) offer
benefits to wind-rich regions similar to those offered by domestic photovoltaic
systems. Such turbines have been developed, produced, and deployed, for example,
in China, mostly in the Inner Mongolian Autonomous Region. The dispersion of
houses in this region of low population density (18 people per square kilometre)
makes household wind systems a viable option for providing electricity. In Inner
Mongolia an estimated 130,000 small-scale (mostly 50-200 watt) wind energy
systems have been installed, providing electricity for lighting, radios,
television, and small appliances to more than 500,000 people, mostly rural
herdsmen (about one-third of the population). About 89,000 of these systems are
operating routinely, producing from 8.7 megawatts of installed capacity about
15.7 gigawatt-hours a year (Wu, 1995).
The success of the Chinese programme was achieved through
careful planning and the creation of an effective regional and local
infrastructure for manufacturing, sales, maintenance, and training. This
included the development of a market for individual household systems through
various subsidy mechanisms. The government of Inner Mongolia also recognised and
allowed for the long gestation period and sustained support needed to create a
thriving local industry. The project has also led to technology transfers at
many levels-between Inner Mongolia and local, regional, and national
organisations within China, as well as with other countries. Replicating the
programme would require enough institutional capacity to support such ventures.
Where rural households are clustered in villages far from
electric grids that are served instead by diesel-engine generator sets, an
alternative option is to deploy wind turbines in wind-diesel or
wind-battery-diesel hybrid configurations, which have been installed in many
parts of the world (Baring-Gould and others, 1999). In regions where diesel fuel
is costly, these hybrid systems can lead to lower electricity costs and less air
pollution than conventional diesel-engine generator sets.
Unlike the household-scale wind turbines being developed in
China, however, many components of these hybrid systems are based on technology
developed in industrialised countries, and costs of imported systems are often
prohibitive. But if these systems can be mass produced in developing countries
under arrangements-such as international industrial joint ventures-that are
conducive to technology transfer, substantial cost reductions are possible (see
chapter 7 for an example).
Small-scale biopower using producer gas. Biomass-derived
producer gas (see above) can be used to make electricity at scales comparable to
those associated with diesel-engine generator sets. The potential benefits are:
· The capacity to
use locally available biomass as fuel instead of oil imported into the region.
· Lower electricity generation
costs than with diesel.
· Increased rural income
generation, and possibly rural industrialisation, as a result of the lower
electricity cost.
The reciprocating compression-ignition (diesel) engine is the
main commercially viable engine available for these applications.8
When producer gas is used with such engines, it must be supplemented with
a pilot oil to assist ignition because mixtures of producer gas and air do not
auto-ignite at the pressures and temperatures realised when the gas is
compressed. As a result producer gas can typically displace about 70 percent of
diesel fuel consumption. When operated with producer gas in the dual-fuel mode,
diesel-engine generators have somewhat lower efficiencies and rated capacities
(typically about 20 percent lower than when operating on pure diesel fuel).
Producer gas must meet far higher standards for reciprocating
engine operation than for cooking or heating (domestic or industrial)
applications. The main problem is the propensity of tars formed in the gasifier
to condense on downstream surfaces, causing problems such as the sticking of
engine gas intake valves. Most early gasifiers generated so much tar that
adequate gas clean-up for engine operation was impractical, and tar removal
would significantly reduce the potential for power generation from a given
amount of biomass feedstock. But in recent years, gasifiers have been developed
(notably in India) that generate tars at levels that make engine operation on
producer gas acceptable (Kartha and Larson, 2000).
Biomass-derived technology for producer gas,
reciprocating-engine generators is commercially ready. In India, for example,
the Ministry of Non-Conventional Energy Sources has supported development
efforts that have led to technically sound gasifier-engine systems and trial
implementation of more than 1,600 such systems with a total installed capacity
of more than 28 megawatts (Kartha and Larson, 2000). For engines operated on
producer gas and pilot oil, fuel costs are typically much lower than for
conventional diesel systems. But capital, operation, and maintenance costs are
higher (see table A10.1).
In fact, the savings derived from diesel replacement have to pay
for the extra initial capital cost as well as the extra operation and
maintenance costs incurred for the gasifier. The technology can be
cost-effective, either where diesel fuel costs are very high (for example,
$0.35-0.40 a litre or more, as is often the case for extremely remote regions)
or, with efficient capital utilisation, in regions where diesel fuel prices are
more moderate. If the diesel fuel price is $0.25 a litre, a typical system must
be operated at full capacity for 3,000 hours a year to break even with a
conventional diesel system. About 6,000 hours of annual operation are needed to
realise a cost savings of 25 percent (see table A10.1). It is desirable to seek
opportunities for such high rates of capacity utilisation because consumers are
likely to be more motivated to adopt the technology if they can realise
substantial cost savings. Unfortunately, achieving high rates of capital
utilisation is often difficult because local electricity. demand is typically
low and sporadic but peaky, with very little electric load diversity.
|
Historically, electric utilities have
discouraged
independent power producers from selling
electricity into
grids, but this situation
is changing as electricity markets
are becoming
more
competitive. |
A promising strategy for launching a producer gas,
engine-generator technology industry would be to focus initially on market
opportunities where the technology could be deployed in large numbers in
baseload configurations. This requires that two conditions be satisfied. Biomass
supplies have to be adequate for fuelling baseload plants, and the demand for
electricity has to be adequate to justify baseload operation. Strong candidate
regions for doing this are agricultural regions of China where crop residues are
abundant and where grid connections exist (87 percent of the rural population in
China is grid-connected), so that electricity generated in excess of local needs
can be sold into the grid (Li, Bai, and Overend, 1998). Historically, electric
utilities have discouraged independent power producers from selling electricity
into grids, but this situation is changing as electricity markets are becoming
more competitive (chapter 12).
New technologies that might be commercialised in the near term
(5-10 years) offer the potential for electricity generation at costs
significantly lower than with current technology. One promising new technology
is the microturbine, which might be deployed with essentially the same gasifiers
that have been developed to provide producer gas for use with diesel dual-fuel
engine generator sets.
Microturbines are gas turbines designed for operation at scales
of 50-250 kilowatts of electricity, with electric efficiencies (lower heating
value) of 25-30 percent for larger units. Microturbines were originally
developed for military and aerospace applications and are now offered by several
companies for applications in distributed power and cogeneration markets, mainly
for use with natural gas or diesel fuel. Developers expect microturbine use to
grow rapidly for such applications in regions where there is competition in
electricity markets (chapter 8). The technology appears to be readily adaptable
for use with biomass-derived producer gas (Henderick, 2000).
Microturbines are less complex (some variants have only one
moving part) than reciprocating engines. They can be fuelled with producer gas
without de-rating and without loss of efficiency relative to operation on
natural gas or diesel fuel. Most important, they need no costly pilot oil
(Henderick, 2000). In regions where crop residues or other low-cost biomass
feedstocks are readily available, there are reasonably good prospects that the
technology could become widely competitive in grid-connected applications
(Henderick and Williams, 2000). Case 2 in the annex describes a potential
application of the technology to the trigeneration of cooking gas, electricity,
and space heating through district heating in a hypothetical village in northern
China.
To illustrate the aggregate potential of this technology,
consider that in China, 376 million tonnes of crop residues a year are
potentially available for energy purposes.9 Committing these residues
to trigeneration (case 2 in the annex) could provide enough cooking gas for 230
million people (27 percent of China’s rural population) plus 270
terawatt-hours a year of electricity (equivalent to 30 percent of coal power
generation in China in 1997) plus hot water for space heating in regions where
it is needed (for example, in regions with cold winters).
Several public policy initiatives could facilitate the creation
of a viable industry for small-scale biopower technologies. One important
measure would be to eliminate or phase out diesel fuel subsidies that exist in
many regions. Another would be market reforms that facilitate the sale of
electricity into electric grids, coupled with incentives to encourage the
extension of electric grids to more rural areas. Notably, the commercial
availability of competitive baseload biopower technology could profoundly
influence the economics of extending electric grids to rural areas. In contrast
to the poor capacity utilisation (and hence poor economics) of
transmission-distribution lines sending electrons from centralised power plants
to rural areas, high capacity factors (and thus more favourable economics) could
be realised if electrons instead flowed to urban centres from baseload
village-scale biopower plants.
Finally, demonstration projects are needed to prove the
viability of new technological concepts for biopower. Projects are needed for
biopower systems based on gasification of alternative crop residue feedstocks,
for which tar production rates are higher than for wood chips (Henderick and
Williams, 2000). Such projects could involve the use of commercially established
diesel dual-fuel engine technologies. Demonstrations are also needed of
microturbines in producer gas applications. If carried out together with the
above institutional reforms, these projects could lead to commercially viable
microturbine-based products for biopower applications in the near term
(2005-10).
Leapfrogging to new rungs on the energy ladder
The previous sections have shown that existing and near-term
energy technologies have great potential for improving the quality of life in
rural areas. But advanced technologies have residual problems that might need to
be addressed. For instance, fuels such as LPG are highly desirable for cooking,
but making LPG widely available requires considerable infrastructure for
distribution, and finding ways to make LPG affordable to the poorest households
is a major challenge. Moreover, because LPG is derived from petroleum-a
commodity for which price swings can be substantial, as recent experience has
shown-price spikes are likely to be burdensome for lower-income households that
depend on LPG for their cooking needs.
Local manufacture of clean cooking fuels (such as biogas and
producer gas derived from biomass feedstocks) is a strategy for addressing the
fuel-infrastructure challenges and price volatility concerns posed by exclusive
reliance on LPG. This strategy also provides opportunities for addressing the
needs of the very poorest households, because the need to gather typically
dispersed biomass feedstocks (such as dung for biogas or crop residues for
producer gas) and deliver them to the conversion facility can sometimes make it
possible for the poor to monetise their labour and thereby earn income to help
pay for these clean cooking fuels (case 2 in the annex).
But today’s available gaseous cooking fuel technologies
have limitations. Biogas technologies, though well suited for use with dung
feedstocks, are not easily applied to crop residues, which tend to be much more
abundant. And a persistent concern about producer gas is that it contains carbon
monoxide, accidental leaks of which might lead to fatalities. Odourants added to
producer gas could greatly reduce the risk of poisoning, but accidents are
difficult to avoid completely.
Advanced technologies can make it possible to manufacture
synthetic cooking fuels from biomass that are non-toxic as well as clean. A
promising approach is to adapt to biomass some of the technologies being
developed for fossil fuels-specifically, syngas-based fluid fuels (chapter 8).
Strong candidates are synthetic LPG (SLPG) and dimethyl ether (DME), which can
be made from any carbonaceous feedstock by catalytic synthesis from syngas (a
gaseous mixture consisting largely of carbon monoxide and hydrogen). SLPG (like
petroleum-derived LPG, a mixture of propane and butane) and DME are superclean,
non-toxic cooking fuels that are gaseous at ambient conditions but can be stored
and delivered to consumers as liquids in moderately pressurised canisters. These
fuels can be produced from crop residues or other biomass feedstocks through
thermochemical gasification to produce the needed syngas. (Case 3 in the annex
discusses the potential offered by such technologies for rural regions of China
rich in crop residues.)
In addition to the toxicity advantages offered by SLPG and DME,
both fuels could be readily transported in canisters by truck or donkey cart to
remote, scattered households. Producer gas, by contrast, is a viable option
primarily for villages in which houses are clustered closely enough to make pipe
transport economically viable. Thus SLPG and DME extend the scope of the cooking
fuel markets that could be served relative to producer gas. DME is also a
potentially strong low-polluting synthetic fuel for diesel-engine vehicle
applications (chapter 8) and might be used as tractor fuel, thereby facilitating
the mechanisation of agriculture.
Neither SLPG nor DME is currently produced for fuel
applications, but either fuel derived from biomass feedstocks could probably be
brought to market readiness by 2010-15 if there were sufficient market interest
and a focused development effort. Because neither SLPG nor DME is currently on
the market anywhere in the world, a shift from the use of current low-quality
fuels to either might be described as jumping to entirely new rungs at the top
of the energy ladder (technological
leapfrogging).
The time horizon for technological options
Chapters 6-8 and this chapter show that there are abundant
opportunities for technological change relating to rural energy. Technological
change is desirable to the extent that it serves development needs. Rural
development planners can help shape the course of technological change for
desirable options, taking into account the time horizons required for
development and implementation-demanding more of the longer-term options in
addressing societal needs. Options that warrant focussed attention in the near
term (that is, implementation in the next 5 years) as alternatives to current
technology should offer the potential for immediate improvement. For the medium
term (5-15 years), planners should emphasise technologies that can potentially
achieve dramatic improvements relative to current technology. To the extent that
technologies realisable in the medium term fall short of performance consistent
with sustainable development goals, policy-makers should also encourage for the
long-term (15-30 years) technologies that are fully consistent with sustainable
development goals.
It is also wise to have a balanced portfolio with a combination
of near-, medium-, and long-term options, to ensure a continuing flow of
improved technologies into rural energy markets. Successes with near-term
improvements can help win political support for the development of longer-term
options. Some important technological options for rural energy in the near,
medium, and long terms are summarised in table
10.3.
Accelerating rural energy development
The preceding sections show that there are many technological
opportunities for implementing the goals set forth at the start of this chapter:
providing clean liquid or gaseous fuels for cooking and electricity for lighting
and other basic household amenities, and making bulk electricity available at
low cost for mechanising rural agriculture and promoting rural
industrialisation.
Both centralised and decentralised energy technologies and
strategies can make contributions to reaching these ends. But new strategies and
policies are needed to increase access to these modern energy services and to
make modern energy services widely affordable. Coordinated efforts that include
the active participation of rural people can accelerate the
process.
Integrated rural development
Making modern energy services more readily available is a
necessary but insufficient condition for rural development. To be most
effective, certain forms of energy (such as grid-based electricity) should be
introduced into rural areas only after, or along with, other development inputs
or infrastructure components. To achieve this integration, it is essential that
there be horizontal communication among all agencies involved in rural
development.
Many rural development activities-agriculture, transport, water
supply, education, income generation, health care-have energy requirements. Yet
the ministries and departments responsible for these activities rarely
coordinate or cooperate with the ministry of energy, or with one another, to
arrive at the most rational, integrated solution to their energy needs.
Decentralisation of rural energy planning may help achieve this. But optimising
the allocation of development resources requires attention at the central
government planning level as well. In the many places where integrated rural
development has been pursued, the availability of affordable modern energy
supplies has proven to be a catalyst for economic and social transformation.
TABLE 10.3. SOME NEAR-, MEDIUM-, AND LONG-TERM
TECHNOLOGICAL OPTIONS FOR RURAL ENERGY
|
Energy source or task |
Present |
Near term |
Medium term |
Long term |
|
Source |
|
|
|
|
|
Electricity |
Grid or no electricity |
Natural gas combined cycles, biomass-based generation using
gasifiers coupled to internal combustion engines, photovoltaic, small wind,
small hydroelectric for applications remote from grids |
Biomass-based generation using gasifiers coupled to
micro-turbines and integrated gasifier combined cycles, mini grids involving
various combinations of photovoltaic, wind, small hydroelectric, batteries |
Grid-connected photovoltaic and solar thermal, biomass-based
generation using gasifiers coupled to fuel cells and fuel cell/turbine hybrids
|
|
Fuel |
Wood, charcoal, dung, crop residues |
Natural gas, LPG, producer gas, biogas |
Syngas, DME |
Biomass-derived DME with electricity coproduct |
|
Cogeneration (combined heat and power) |
|
Internal combustion engines, turbines |
Microturbines and integrated gasifier combined cycles |
Fuel cells, fuel cell/turbine hybrids |
|
Task |
|
Cooking |
Woodstoves |
Improved woodstoves, |
Producer gas, natural gas and DME stoves |
Electric stoves, catalytic burners |
|
Lighting |
Oil and kerosene lamps |
Electric lights |
Fluorescent and compact fluorescent lamps |
Improved fluorescent and compact fluorescent lamps |
|
Motive power |
Human and animal powered devices |
Internal combustion engines, electric motors |
Biofueled prime movers, improved motors |
Fuel cells |
|
Process heat |
Wood, biomass |
Electric furnaces, cogeneration, producer gas, NG/solar thermal
furnaces |
Induction furnaces, biomass/solar thermal furnaces |
Solar thermal furnaces with heat storage |
The provision of affordable financial services for rural people
has long been a prime component of rural development strategies. Originally,
these strategies focussed on concessional loans to farmers. More recently,
however, this approach has been replaced by much wider financing for rural
activities, with lower transaction costs. By creating rural financial markets
and integrating them with general financial markets, it may be possible to
mobilise substantial domestic savings as the main capital resource for rural
people-and to reduce their dependence on concessional outside funds. Where
urban-biased financial policies have inhibited the creation of effective rural
financial institutions, new policies and strategies should seek to integrate
rural and urban financial services and thus promote the greatest financial
efficiency and lowest credit costs for rural
people.
Involving rural people (particularly women) in decision-making
Above all, planning for rural energy development should have a
decentralised component and should involve rural people-the customers-in
planning and decision-making. And special attention should be devoted to
involving women, because they bear the burden of traditional energy systems and
are likely to be the greatest beneficiaries of improved systems. A major driving
force for the move towards decentralisation has been the recognition of the
limited extent to which benefits have flowed to rural people from the
investments already made. More active involvement of rural people (particularly
women) and their institutions in identifying rural energy problems, and in
formulating and implementing plans to overcome them, would result in more
efficient, rational use of resources and more equitable sharing of the benefits
of development.
Decentralisation of rural energy planning is wise for other
reasons as well. Rural energy systems are based primarily on biomass, a local
energy resource. Although historically this has involved direct combustion of
biomass for cooking or heating (as this chapter has shown), clean, convenient,
modern energy carriers can also be derived from biomass. Consequently, an
assessment of the demand and supply flows and of desirable interventions must
all also occur on the same geographic scale. Through their superior knowledge of
the local situation, local people-women in particular-can be integral parts of
the
solution.
Strategies for expanding access to modern energy services
Often, policies ensuring that supplies-even from centralised
production sources-are reliable and stable can promote the use of modern energy
carriers. The Hyderabad, India, example (see above) shows that by the simple
expedient of stabilising LPG supplies, the local government was able to
encourage many households to shift from biomass to LPG for cooking.
|
Where integrated rural development has
been pursued, the
availability of
affordable modern energy supplies
has proven to be a
catalyst for
economic and social
transformation. |
For rural electrification through grid extension, rural
cooperatives seem to be a viable alternative to grid extension by the large
parastatals that have dominated power generation in developing countries. In
Bangladesh financial and technical failures of public power utilities in 1980
led to a government-supported take-over of its parastatals by rural
electrification cooperatives. Now numbering 45, the cooperatives have engineered
a rapid expansion of grid-based rural electricity supply that serves 1.6 million
consumers-as many as the public sector in urban areas. Power outages have fallen
dramatically, while revenue collection has improved from 91 to 98 percent,
despite higher tariffs. Most important, the cooperatives have fostered an
alternative structure to meet a demand that was previously unexpected in such a
poor country. They have also demonstrated that consumers have considerable
interest in getting access to electricity and are willing to pay for reliable
service.
More effective electric grid extension measures can also help
promote the wider availability of electricity from local biomass sources by
making village-scale biopower-generating technology more attractive to
investors. Grid access would make it possible to operate biopower plants as
baseload units, thereby increasing capacity utilisation and reducing generation
costs per kilowatt-hour. Grid access would enable rural populations to sell into
the grid electricity produced in excess of local needs-until local rural
industrial capacity could be increased to more fully use the electricity
produced this way (case 2 in the annex). Thus a promising new approach would be
to couple grid extension in regions rich in crop residues (or other suitable
biomass resources) to measures that encourage village-scale biopower generation.
This strategy would also make investments in grid extension more
attractive. The availability of baseload biopower on these grids would enhance
grid capacity utilisation and make transmission costs per kilowatt-hour much
lower than when electrons instead flow from large central power plants to rural
areas to serve small, scattered, peaky rural electrical loads.
Policies that make grid access possible are needed to facilitate
the launch of such baseload biopower technologies on the market. Policies
promoting increasing competition in electricity generation would be helpful. But
consideration also has to be given to the fact that, when any new technology is
introduced, its cost is higher than that of the established technology it would
replace. That remains the case until enough new plants have been built to buy
down the cost of the new technology along its learning curve to prospective
market-clearing price levels (chapter 12).
One way to pursue technology cost buy down in a competitive
electricity market is to require that each electricity provider include in its
portfolio a small but growing fraction provided by biopower or other renewable
energy supplies. This requirement would be imposed during a transitional period
as new renewable energy industries are being launched on the market. Power
generators could either produce this renewable electricity themselves or
purchase renewable energy credits that are sold in a credit trading market.
Experiments with this mechanism are being conducted in the United States (where
it is called a renewable portfolio standard) and in Europe (where it is called
green certificate markets). The concept has great promise for developing
countries.
A major challenge in extending energy services to rural areas is
to find and pursue the least costly mix of energy options (centralised and
decentralised, fossil and renewable, end-use efficiency improvements) for a
particular region. This might be achieved, for example, through concessions for
both cooking fuels and electricity. Concessions grant the exclusive right to
provide energy services in exchange for the obligation to serve all customers in
the region. They offer the advantage of being able to reduce transaction costs
greatly in serving large numbers of small customers, relative to other
mechanisms. Concessionaires ought to have the flexibility to choose the least
costly combinations of technologies in meeting their obligations. The rural
energy concessions recently introduced in Argentina illustrate how the concept
might work (box 10.5).
|
BOX 10.5. A CONCESSION SCHEME FOR RURAL ENERGY DEVELOPMENT IN
ARGENTINA
Argentina recently began implementing an innovative rural energy
plan to encourage private sector involvement in rural energy services. To begin
with, the programme targets eight provinces with 1.4 million people and 6,000
facilities without access. In each province, private companies bid for the right
to provide electricity to the people and to the schools, medical centres,
drinking water facilities, and other public facilities without access. Solar
photovoltaic panels, small wind turbines, micro hydropower, and diesel-driven
generators compete on a least-cost basis.
Preliminary analyses show that in most cases renewable
technologies will be competitive with diesel generators. A large share of
household supply will be through solar photovoltaic home systems. Total
investment for all provinces amounts to $314 million, with a 55 percent subsidy
from provincial, federal, and World Bank funds to cover initial capital
investments. The winning bids will be those seeking the lowest government
subsidy per energy hook-up.
In 1996 two concessions were awarded in Jujuy and Salta
provinces. In Jujuy, after solving some initial problems with the tariff
structure proposed in the bidding papers, 500 of 2,000 new users are now served
through renewable sources, and a programme to supply 550 additional users
through solar home systems is in progress. By 1998 solar systems were installed
in 220 schools in Salta province, which aims to achieve full coverage of public
service electrification (including schools and first-aid medical centres) in
2000.
In April 1999 a $30 million loan from the World Bank and a $10
million subsidy from the Global Environment Facility were approved. These funds
will help finance the national government’s share of subsidies for the
first eight provinces to adopt the programme, as well as overcome barriers to
the use of renewable energies. Concessions to provide electric power to
significant portions of the population within three years were granted in the
next six provinces to adopt the programme in late 1999 and early 2000.
Eventually, all rural Argentine provinces will participate in the programme.
|
Source: Covarrubias and Reiche,
2000.
Strategies for making modern energy services affordable
Although policies aimed at widening access to modern energy
services are necessary, they are often insufficient to deliver modern energy
services to all rural residents. Modern energy technologies are useful only to
those who can afford to adopt them. Even the more affluent rural households
typically cannot afford to purchase photovoltaic systems, which may be the only
plausible electrification option for scattered rural households. Moreover, the
very poorest households are unable to pay for even less capital-intensive modern
energy options. And such households are the majority in the poorest countries:
37 of the countries listed in the World Bank’s World Development Report
1998/99 had a 1997 GDP per capita below $500 (unadjusted for purchasing
power parity).
Historically, energy price subsidies have been used extensively
to promote wider use of modern energy carriers. But energy price subsidies are
problematic. The welfare objective embodied in such subsidies is often not
realised because of their diversion to unintended uses. Typically, there is a
disproportionate exploitation of the subsidies by the more affluent, who could
afford to pay unsubsidised prices. Such subsidies help explain the poor
financial conditions of many parastatal energy companies, and have made
continued expansion of energy supplies difficult (chapter 12). Energy price
subsidies should be a policy of last resort to deliver modern energy services to
rural areas.
When attempting to increase the level of energy services
provided, a central question is: what is affordable? There is frequent mention
of affordability, but there has been no rigorous quantification of this concept.
One might argue that a consumer’s current energy expenditures-for example,
on kerosene for lighting-are a good indicator of what that consumer is prepared
to spend for electric lighting. In some cases, however, the consumer is prepared
to spend more for a new technology if it is safer or more convenient.
Policy reforms to make capital resources more readily available
for small-scale rural energy investments would be especially helpful in making
modern energy affordable to small rural consumers. Various microfinance schemes
are being tried (box 10.6), and some are proving quite successful. When the poor
have access to microfinance, they are no longer beneficiaries of government and
donor largesse but clients with assets, whose preferences and needs must be
respected. Microfinance has demonstrated success not only in providing access to
energy services for poor households, but also in generating income and
alternative economic activities. Microfinance is facilitating access to
affordable modern energy technologies for which many people are willing to pay
the full cost.
Poor Indian households that currently buy kerosene for lighting
could afford electric lighting if energy-efficient fluorescent bulbs were used
(Reddy, 1999). An appropriate microfinance scheme could make investment in
fluorescent lights a viable option, even for poor households, if total spending
on electricity plus debt servicing was less than maximum household spending on
energy (about 15 percent). The combination of modern technology and microfinance
can thus widen the window of opportunity. Because of the capital-intensive
nature of photovoltaic and other renewable energy technologies, microfinance
schemes are especially important to promote their widespread dissemination (box
10.7).
|
BOX 10.6. ALTERNATIVE APPROACHES FOR FINANCING SMALL-SCALE
RURAL ENERGY TECHNOLOGIES
At the smallest scales, many sustainable energy technologies
(including small-scale wind and hydropower supplies and photovoltaics for homes)
cost a few hundred dollars. Buying them outright is impossible for most rural
households in developing countries. But an important minority of households,
communities, and small businesses can afford to buy them with credit. The main
obstacle to serving this crucial market is the reluctance of banks to manage
numerous small loans and to lend without collateral or other guarantees against
loan defaults. A variety of innovative approaches are being used to overcome
this obstacle:
· Financing
through dealers. Banks transfer the collateral problem from the end user to
dealers by lending to dealers, who in turn lend to purchasers using payment
schemes compatible with their income. Dealers must bear the financial risk along
with technical risks. This system is best suited to large, relatively
high-income rural markets.
· Financing through energy
service companies. These companies can replace dealers as the financing
intermediary. Companies typically require greater efforts to establish higher
funding levels, because they provide a more comprehensive installation and
back-up service to clients.
· Revolving funds (with grant
support). A bank takes on the risk of operating a revolving loan fund,
usually with start-up capital provided by a grant.
· Loan aggregation through
cooperatives. To avoid the high costs of servicing many small loans,
prospective borrowers form a community association (or enlarge the functions of
an existing village or farmer cooperative). Banks lend to the cooperative or
lease the energy systems but retain ownership of the equipment in case of
payment defaults.
· Concessional funding for
public sector objectives. The government contracts and pays a local company
to provide energy services that meet development objectives, such as
photovoltaic lighting for schools. This provides entry capital for the company
to offer credit and expand its business to other local markets, such as
photovoltaics for households, health clinics, and community centres.
· Payment for energy
services. Payment for outputs, such as irrigation and drinking water, have
been used to fund the recurrent operation and maintenance costs of small-scale
energy systems. These cost streams are usually hard to fund, or remain unfunded,
when loans target the capital cost.
Most of these approaches demand high levels of local
participation and so take time to mature. Participation must start at the
concept development stage, so that local people can decide which schemes and
parameters are most appropriate. |
Source: EC and UNDP, 1999.
Microfinance by itself is no panacea, however. Two other factors
limit the affordability of energy services: the high costs of imported energy
products (including high inherent costs and inefficient procurement of small
quantities) and the low incomes of the very poorest households. But
international industrial joint ventures that manufacture modern energy
technology with gradually increasing domestic content can, over time, reduce
costs relative to the cost of the same technology if imported (Weise and others,
1995; see also the case study of wind-diesel hybrid technology in China in
chapter 7). Such cost reductions lead to expanded market opportunities, which
lead to further cost reductions resulting from higher production volumes. The
keys to success in creating this kind of virtuous cycle of cost reduction and
market expansion are policies that facilitate the formation of such joint
ventures and steer them towards the provision of energy services for rural areas
(chapter 12).
|
BOX 10.7. THE GRAMEEN SHAKTI PHOTOVOLTAIC PROGRAMME IN
BANGLADESH
In 1996 the Grameen Bank of Bangladesh, a microlending agency
with more than 1,000 branches and 2 million members, initiated a programme of
loans for photovoltaic home systems to serve those without access to
electricity. The loans are administered by a nonprofit rural energy company,
Grameen Shakti, and call for a small down payment.
Grameen Shakti’s first initiative has been a 1,000-unit
project to understand better a number of important issues concerning household
photovoltaic systems. These include:
· Technical
performance of these systems in rural Bangladesh.
· Acceptance of the systems by
the poor.
· Income-generating potential of
light in the evening.
· Affordability, factoring in
technical improvements and economies of scale.
· The training, monitoring, and
evaluation expertise that would be required to replicate this project if it
proves successful.
Grameen Shakti expects that 100,000 photovoltaic systems will be
operating in rural Bangladeshi homes in 2000. The bank plans to expand this
service by offering small loans for wind power and biogas plants. Demonstration
projects are under way to determine the most appropriate financing packages for
these technologies. |
The very poorest households may need higher incomes as well as
microfinance to afford modern energy supplies and end-use devices. Increasing
the incomes of the rural poor through macroeconomic policies is an especially
daunting challenge and takes a long time. But energy policies that facilitate
the introduction of low-cost electricity generation for rural industrialisation
could effectively promote income generation.
Especially promising are the possibilities for electricity
generation from low-cost crop residues in agriculture-intensive regions.
Moreover, village-scale, crop-residue-based biopower technologies offer the
possibility of near-term income from gathering biomass and delivering it to
conversion facilities. This could help the poor pay for modern energy supplies
without having to wait for rural industrialisation opportunities to materialise
(case 2 in the annex). A key to making such income-generating activities viable
seems to be the opportunity to sell into the grid electricity produced in excess
of local needs (see the section above on small-scale biopower).
Pursuing all the above strategies might still leave the very
poorest households in some areas unable to afford convenient energy services. If
so, subsidies may still be needed. As noted, to stimulate the use of new
technologies (such as fluorescent light bulbs), one-time equipment subsidies are
preferable to continued price subsidies.
To sum up, sustainable development implies that modern energy
carriers need to be made affordable to satisfy the basic needs of all rural
residents. Policies are needed that will make pursuing this objective
profitable. If a subsidy is needed, it might be provided as an integral part of
a new social contract that creates highly competitive conditions in the energy
sector (a key element of ongoing energy reforms), complemented by the
establishment of a public benefits fund financed with wire and pipe charges
imposed on electricity, oil, and gas providers to protect the public interest
under new competitive market conditions (see chapter 12 for a discussion of
public benefits funds). Specifically, some fund revenues could subsidise the
basic energy needs.
This public benefits fund strategy could be made entirely
consistent with a shift to greater reliance on market forces to more efficiently
allocate resources. If, for example, an energy concession proved to be the
preferred way to deliver modern energy services to a particular rural area, and
if the concession was awarded competitively, market forces would be brought into
play to find the least costly mix of energy technologies with the least amount
of subsidy to satisfy the concessionaire’s obligation to provide modern
energy services to
all.
Conclusion
Between 1970 and 1990 rural electrification from grids brought
electricity to 800 million additional people. In addition, in the past 20-30
years a number of innovative schemes have been developed to commercialise
improved cooking stove, biogas, and producer gas systems; photovoltaics; wind;
and so on-with the result that several hundred million people have improved
their access to energy. Perhaps as many as 600 million people have benefited
from these innovations. Yet despite these efforts to improve energy services to
rural areas, the population without access to such services has stayed about the
same: 2 billion.
The task is daunting but not hopeless. Technologies can be
deployed immediately or in the near term to improve energy services for rural
areas. These technologies will lead to dramatic advances in the quality of life
for rural populations. These advances can be achieved at costs that are within
the means of governments and beneficiaries. They also require quite modest
increases in the magnitudes of total energy supplied to the countries involved.
They offer attractive options for decision-makers seeking quick political
pay-offs before the next popular judgement of their performance. Even more
exciting is the possibility of interesting new technologies that might be
developed and exploited. All such possibilities would enable rural populations
to climb up the energy ladder, leapfrog to higher rungs on the ladder, or even
reach new rungs that could be added near the top of the ladder.
|
Through their superior
knowledge of the local
situation,
local people - women in
particular - can be integral
parts
of the solution. |
New policies are needed to bring the top of the energy ladder
within reach of all rural people. Past efforts to deliver modern energy to rural
areas have often been ineffective and inefficient. Some recent programmes are
showing good results, but more promising new approaches need to be tested to
determine if they can address poverty, equity, environmental, and public health
concerns in the context of the ongoing global restructuring of energy
industries. Much can be done towards these ends without resorting to large
subsidies if competitive market conditions are fostered and complemented by
measures to protect the public interest. Subsidies should be reserved for
situations in which new strategies alone cannot make modern energy widely
available. Even then, fuel price subsidies should be avoided if basic needs can
be addressed by alternatives, such as subsidised purchases of energy-efficient
equipment. Sound policies to accelerate the wide availability of modern energy
services in rural areas could lead to even more dramatic improvements in the
rural quality of life without creating large demands on public
treasuries.
Annex. Case studies of crop-residue-derived modern energy carriers in China
In densely populated countries that are largely self-sufficient
in food production and are prolific generators of crop residues, thermochemical
gasification of crop residues can provide an attractive means of providing both
clean cooking fuel and electricity or combined heat and power (CHP) to satisfy
basic human needs and generate additional electricity in support of income
generation and rural industrialisation. Prospects in this regard are here
illustrated by three case studies for China that illustrate the prospects for
providing:
· With existing
technology, residue-derived producer gas as a clean cooking fuel at the
village scale.
· With
medium-term (5-10 year) technology, cooking gas plus CHP at the village
scale, with residue-derived producer gas.
· With long-term (10-20 year)
technology, both electricity suitable for rural industrialisation and a
synthetic fluid fuel for cooking (synthetic LPG or DME derived from synthesis
gas; see chapter 8) that is safe as well as clean.
There are three reasons to focus on China in studying this
approach to making modern energy carriers widely available in rural areas.
First, China satisfies the criteria of being densely populated, self-sufficient
in food, and a prolific generator of crop residues. About 376 million tonnes a
year (about half the total residue generation rate) are potentially available
for energy; the rest is used for paper-making, forage, or returned to the fields
to sustain soil quality (Li, Bai, and Overend, 1998). The energy content of
these residues is equivalent to 15 percent of the coal energy use in China in
1998.
Second, China has a severe new air pollution problem caused by
the burning of crop residues in the field at harvest time, a consequence of the
rising affluence of farmers. Traditionally, in poor agricultural communities of
China, residues were fully utilised for heating, cooking, and other purposes.
But as incomes have risen, growing numbers of farmers have become less willing
to gather residues from the fields and store them for use throughout the
year-preferring instead to buy coal briquettes or LPG as needed. As a result,
excess crop residues that do not readily decay (because they dry out too
quickly)for incorporation into the soils have been burned off in the fields to
avoid insect infestation problems. The resulting air pollution has been
severe-often even closing airports near harvest time. As a response, the
government in 1999 banned burning crop residues near airports, railroads, and
highways. The ban will be difficult to enforce, however, unless alternative
productive uses of residues can be found.
Third, a key to providing low-cost electricity from crop
residues as a coproduct of cooking gas is being able to produce baseload
electricity and to sell electricity produced in excess of local needs into the
electric grid. In most developing countries, this is not yet feasible because
few rural communities are hooked up to grids. But in China, 87 percent of rural
households are connected, in comparison with an average of about 33 percent for
all other developing countries. Thus China stands out as a strong candidate
country for launching small-scale biopower technologies in the market.
Case 1. Cooking with producer gas generated at the village
scale
With technology currently available in China, it is feasible to
provide clean cooking gas derived from crop residues at the village scale
through partial oxidation in air, as illustrated by recent experience in
Shangdong Province.10 In May 1996 a village-scale crop residue
gasification system serving village households with producer gas for cooking
went into operation in Tengzhai village (216 households, 800 people), Huantai
County, Shangdong Province (the second village-scale gasification system
installed in the province), using an atmospheric pressure, air-blown, downdraft
gasifier developed by the Energy Research Institute of the Shangdong Academy of
Sciences. Researchers at the institute also carried out detailed socio-economic
studies of the implications of the technology and of costs in relation to
benefits.
The gasifier requires 0.25 tonnes of crop residue per capita to
meet the annual cooking needs of villagers. About 12 percent of the residues
generated by the village’s wheat and corn crops are adequate to meet all
its cooking energy requirements. Researchers estimated that, with the producer
gas cooking system, cooking time for housewives is reduced from 3.0 to 1.5 hours
a day.
In a survey of 30 randomly selected households, the researchers
found that this technology was regarded as being as good as or better than coal
or LPG (the major technologies displaced) with regard to price, convenience,
reliability of supply, environmental impact, and working intensity of housewives
(all the issues investigated in the survey) by 97.5 percent or more of all
households surveyed for each issue.
The total capital cost for the entire project (with an expected
10-year project life) was 378,000 yuan ($47,000, or $220 a household), a third
of which was provided by a government subsidy. The producer gas is sold to
villagers at a price that is a third of the market price for LPG on an
equivalent-cooking-service-provided basis.11 At this selling price,
the project is not cost-effective, even with the capital subsidy. However, if
the gas selling price were raised to two-thirds of the equivalent market price
for LPG, the technology would be cost-effective without any capital subsidy,
generating an internal rate of return of 17 percent. At this higher gas price,
the annual cost of cooking fuel per household would be 360 yuan ($45) a year,
about 25 percent less than the fuel cost for cooking with coal.
Case 2. Combined heat and power systems using producer gas
generated at the village scale
Although desirable as a way to make an affordable, clean,
convenient cooking fuel available to villagers, the strategy described above
will not solve the air pollution problem caused by burning excess residues.
However, using residues in excess of what are needed to make cooking gas power
generation or CHP could solve the problem.
This case discusses the prospects for improving village living
conditions through the ‘trigeneration’ of cooking gas, hot water for
space heating, and electricity from a village-scale gasifier that converts crop
residues (corn stalks) into producer gas (Henderick and Williams, 2000). The
system is designed to satisfy all cooking needs in the village with a clean gas,
plus meet all village electricity needs, plus generate much more electricity for
sale into the grid, plus generate hot water through waste heat recovery at the
biopower plant for distribution to village households through a district heating
system that would satisfy all space-heating needs (especially important in Jilin
Province, where winters are very cold). For specificity, the analysis is for a
hypothetical 100-household village (400 residents) in Jilin Province, where
about half the residue generated could potentially be exploited for energy
purposes at a rate of about 6.5 tonnes a household per year (Cao and others,
1998).
With currently available biopower technology, electricity could
be produced at the least cost with diesel-engine generator sets operated in
dual-fuel mode, using producer gas as the primary fuel, plus pilot diesel fuel
for ignition purposes (see the section in the main text of the chapter on
small-scale biopower using producer gas). Because this technology is more
capital-intensive than conventional diesel technology (table A10.1), a high
level of capital utilisation (high capacity factor) is often required to reach
economically attractive generation costs. Local electricity demand in poor rural
areas is often inadequate to make the required high capacity factors feasible.
If electricity could be sold into the electric grid, high capacity factors could
often be realised.
A microturbine providing 75 kilowatts of electricity, a
second-generation small-scale biopower technology (see the section on
small-scale biopower using producer gas), was selected for the detailed design
of a village trigeneration system. The microturbine is a technology for which
the potential generating cost using low-cost residues is low enough (see table
A10.1) to make the technology quite attractive for selling electricity into the
grid. The energy balance for the village trigeneration system based on the use
of this micro-turbine is shown in figure A10.1.
The estimated initial investment (base case) for the system is
$1,800 a household, a third of which is for gas and for infrastructure to pipe
hot water. It is assumed that the infrastructure investment is covered by a loan
from the government at 6 percent interest, and that the rest of the investment
is covered by equity capital provided either by an independent power producer or
by a villager-owned corporation. (Village corporation financing is plausible
because the required capital is equivalent to less than three years of the
average savings rate-38 percent of income in 1998-for Jilin’s rural
population.) For the village corporation option, the average net cash flow to
villagers (income from crop residue sales plus revenues to the corporation minus
expenses of the corporation) is adequate to cover all expenditures on energy by
the villagers for the 20-year life of the system.12
TABLE A10.1 COSTS OF ELECTRICITY WITH ALTERNATIVE
ENGINE-GENERATORS FUELLED WITH DIESEL OIL AND/OR PRODUCER GAS DERIVED FROM CROP
RESIDUES
|
System typea |
Diesel engine |
Spark-ignition engine |
Microturbine |
|
Diesel only |
Dual-fuelb |
|
|
|
Engine-generator set |
|
Equipment lifetime (years)c |
6 |
6 |
6 |
10 |
|
Rated power output (kilowatts) |
80 |
100 |
160 |
80 |
|
De-rated power output (kilowatts)d |
80 |
80 |
80 |
80 |
|
Thermal efficiency, lower heating value (percent)e
|
34 |
27 |
21 |
28 |
|
Installed equipment cost (dollars per rated
kilowatt)f |
181 |
181 |
362 |
350 |
|
Installed equipment cost (dollars per de-rated kilowatt) |
181 |
226 |
724 |
350 |
|
Present value of lifecycle capital investment for the
engine-generator set (dollars per de-rated kilowatt)g |
330 |
413 |
1,320 |
463 |
|
Total system (including building plus gasifier plus gas
clean-up)h |
|
Initial cost (dollars per de-rated kilowatt)i |
243 |
680 |
1,280 |
850 |
|
Present value of lifecycle capital investment for the total
system (dollars per de-rated kilowatt)j |
392 |
960 |
1,970 |
1,070 |
|
Operating costs |
|
Diesel fuel (dollars per hour, at full power output)k
|
5.48 |
1.65 |
0 |
0 |
|
Crop residues (dollars per hour, at full power
output)l |
0 |
0.39 |
0.66 |
0.50 |
|
Lubricating oil (dollars per hour, at full power
output)m |
0.21 |
0.42 |
0.42 |
0 |
|
Labour (dollars per hour during operation, at full power
output)n |
0.12 |
0.23 |
0.23 |
0.23 |
|
System maintenance (dollars per year)o |
1,500 |
2,800 |
2,800 |
3,300 |
|
Levelised life-cycle electricity generation cost (cents per
kilowatt-hour) |
|
Total capital cost |
0.92 |
2.26 |
4.63 |
2.51 |
|
Diesel fuel |
6.85 |
2.06 |
0 |
0 |
|
Biomass |
0 |
0.49 |
0.83 |
0.62 |
|
Lubricating oil |
0.26 |
0.53 |
0.53 |
0 |
|
Maintenance |
0.34 |
0.62 |
0.62 |
0.73 |
|
Labour |
0.16 |
0.33 |
0.33 |
0.33 |
|
Total (cents per kilowatt-hour) |
8.5 |
6.3 |
6.9 |
4.2 |
a. All costs are in 1998 U.S. dollars. All systems
are designed for an electrical output capacity of 80 kilowatts of electricity,
and operation at 65 percent average capacity factor, so that annual electricity
generation is 456,000 kilowatt-hours. Costs are calculated for a 12 percent real
discount rate and a system lifetime of 20 years, so that the capital recovery
factor is 0.134. b. Dual fuel refers to operation on producer gas plus pilot
oil. It is assumed that producer gas displaces 70 percent of the diesel fuel
required for standard operation on diesel fuel only. c. It is assumed that
reciprocating internal combustion engines have 6-year (34,000-hour) lifetimes.
The 10-year (57,000-hour) lifetime for the microturbine is an estimate by
Honeywell. d. Relative to operation on diesel fuel, a diesel engine operated on
producer gas plus pilot oil is typically de-rated 20 percent. For spark-ignited
engines operated on producer gas, a 50 percent de-rating relative to operation
on gasoline is typical. There is no de-rating penalty for microturbines operated
on producer gas (Henderick, 2000). e. The assumed efficiencies (producer gas to
electricity) for internal combustion engines converted to run on producer gas
(21 percent for spark-ignition engines and 27 percent for diesel engines) are
representative (Reed and Das, 1988). For the microturbine, 28 percent is
representative of Honeywell’s 75-kilowatt model (their target is 30
percent). The overall conversion efficiency (crop residue to electricity) is
obtained by multiplying these efficiencies by the 70 percent gasifier
efficiency. f. The diesel engine capital cost is from Mukunda and others (1993).
The spark-ignition engine is assumed to be an industrial gas engine, for which
the capital cost is typically twice that of a diesel (McKeon, 1998). Honeywell
product literature (1998) estimates year 2003 installed equipment cost at
$350-450 a kilowatt for its 75-kilowatt microturbine. g. Present value of the
life-cycle capital investment includes the installed equipment cost plus future
replacements during the 20-year life cycle, less equipment salvage value at 20
years. h. On the basis of Mukunda and others (1993), capital costs for
gasification and gas clean-up are assumed to be $1,160 for the gasifier, $8,700
for the cooling and cleaning system, $11,600 for a control system, and $5,800
for a building ($1,740 if diesel only). For the microturbine, an additional fine
filtration cleaning unit costing $20 a kilowatt is assumed. i. The total initial
cost includes a 20 percent increment over the installed equipment cost to allow
for engineering and contingencies. j. During the 20-year life cycle, the
gasifier is replaced three times (6-year life), and the clean-up and control
systems are replaced once (10-year life), while the building requires no
replacement (Mukunda and others, 1993). k. The cost of diesel fuel is assumed to
be $0.25 a litre. l. For rural Jilin Province, China, the cost of gathering corn
stalks from the field and delivering them to the trigeneration facility modelled
in Henderick and Williams (2000) is estimated to be 45 yuan a tonne ($0.33 a
gigajoule), on the basis of data for the province provided by Cao and others
(1998). m. On the basis of Mukunda and others (1993), lubricating oil
requirements are assumed to be 1.36 grams a kilowatt-hour for dual-fuel engines;
for spark-ignition engines the same value is assumed, and half this rate is
assumed for conventional diesel engines; microturbines require no lubricating
oil. Also on the basis of Mukunda and others (1993), the lubricating oil cost is
assumed to be $3.50 a litre ($3.87 a kilogram). n. On the basis of Mukunda and
others (1993) for rural India, during the 65 percent of the time the engine is
assumed to be operating at full output, labour costs are $0.23 an hour (4 rupees
an hour) for two workers for dual-fuel systems-assumed to be the same for
spark-ignition engines and microturbines. Labour costs at half this rate are
assumed for conventional diesel engines. In addition, it is assumed that these
labour cost rates are applicable for 14 hours a week during downtime, for
maintenance, preparation, and so on. o. On the basis of Mukunda and others
(1993), annual maintenance costs are estimated as fixed percentages of installed
building and equipment costs (not including engineering and contingencies) for
the diesel, dual-fuel, and microturbine cases. The assumed percentage for diesel
and dual-fuel engines is 10 percent; that for microturbines is assumed to be 8
percent. The assumed percentage for the building, gasifier, and gas clean-up is
5 percent; for the control system, 2 percent. It is assumed that the maintenance
costs for the spark-ignited engine case are the same as for the dual-fuel engine
case.
Source: Based on Henderick and Williams,
2000.
The low-interest government loan for piping infrastructure might
be justified as a cost-effective measure for avoiding the health costs of indoor
air pollution associated with burning solid fuels for cooking and heating. For
the hypothetical village, the annual health damage costs avoided would be $4,800
(assuming the average per capita value for all rural China; World Bank, 1997),
more than three times the cost savings to the villagers, as a result of having
debt instead of equity financing for piping.
Poor households that own no crop residues might earn income to
cover energy expenditures by being paid by rich farmers to remove crop residues
from their fields (for example, to enable them to comply with the ban on field
burning of residues); residue recovery from the farmland of less than five
average households would enable a poor household to earn enough income to cover
all energy expenditures.
Case 3. Coproduction at industrial-scale of synthetic liquid
petroleum gas and electricity from crop residues
The trigeneration technology described above could be improved
if the cooking fuel provided were safe as well as clean (for example, producer
gas contains carbon monoxide, so the risk of leaks poses a danger). This might
be realised through the coproduction, at industrial scales, of electricity and
synthetic liquid petroleum gas (SLPG) or dimethyl ether (DME)-synthetic fuels
well suited for cooking, the use of which would involve no risk of carbon
monoxide poisoning.
A preliminary design of a plant that would convert grain crop
residues into SLPG and electricity using a once-through Fischer-Tropsch liquids
plant coupled to a biomass integrated gasifier combined cycle (IGCC) plant has
been carried out (Larson and Jin, 1999) at plant scales appropriate for Jilin
Province, the corn belt of China, which produced 15 million tonnes of corn in
1995 (13 percent of the country’s total). The technology would build on
advances that are being made for liquid-phase syngas reactors that are being
developed for the coproduction of synthetic liquid fuels and electricity from
fossil fuel feedstocks (chapter 8).
The design involves 10-megawatt-electric biomass IGCC plants
producing SLPG as a coproduct (250 barrels of crude oil equivalent a day). For
the corn crop residue densities characteristic of Jilin, residues would have to
be gathered from cornfields within a 11-kilometre radius to meet feedstock needs
at the plant. Such plants could convert 15 percent of the biomass feedstock to
electricity and 28 percent to LPG. Preliminary estimates are that the SLPG
produced this way in rural Jilin might be competitive with conventional LPG,
once biomass IGCC technology is established in the market (Larson and Jin,
1999). As discussed in chapter 7, biomass IGCC technology has advanced to the
point where it is now being demonstrated in various parts of the world, building
on the experience that has already brought coal IGCC technology to commercial
readiness (chapter 8).13
If the technology could be used with all the 376 million tonnes
of crop residues per year potentially available for energy purposes in China, it
could provide 1.4 exajoules a year of SLPG along with 210 terawatt-hours a year
of electricity. This much LPG could meet-in the form of a super-clean fuel-the
cooking needs of 560 million people (about 70 percent of the rural population
projected for 2010), while generating electricity at a rate equivalent to the
output of 2.5 Three Gorges power plants (the Three Gorges plant’s output is
18 gigawatts of electricity). And whereas the electricity from the Three Gorges
plant would have to be transmitted long distances to most customers, this
residue-generated electricity would be produced in 3,400 power plants (each with
output of 10 megawatts of electricity), which would typically be located close
to the consumers they serve.
FIGURE A10.1. ENERGY BALANCE FOR A
TRIGENERATION SYSTEM BASED ON THE USE OF PRODUCER GAS DERIVED FROM CROP RESIDUES
IN A HYPOTHETICAL 100-HOUSEHOLD VILLAGE, JILIN PROVINCE, CHINA
Source: Henderick and Williams, 2000.
As in the case of the village-scale trigeneration system
described above, with this technology the very poorest households could pay
enough for electricity and clean cooking fuel to satisfy their basic needs by
gathering residues from the fields of rich farmers and delivering the residues
to the energy conversion plants, thereby monetising their labour.
DME, which is expected to be easier to manufacture as a
synthetic fuel than SLPG, would have similar properties as a cooking fuel.
Although the technology for making DME is not as far advanced as that for SLPG,
either option could probably be commercially ready by 2010-15 with a concerted
development effort. The Institute of Coal Chemistry at the Chinese Academy of
Sciences is investigating prospects for making DME from coal for cooking fuel
applications (Niu, 2000).
Notes
1. The amount of time varies widely depending on the
availability of biomass. Surveys have shown that in some regions, women spend
close to an hour a day collecting firewood, and could spend more than two hours
a day in areas where fuels are scarce (World Bank, 1996).
2. As discussed in the next section, many of the technologies
associated with the intermediate rungs on the ladder pose greater development
challenges than technologies associated with the top rungs.
3. For a family of five, 0.08 kilowatts per capita consumption
for cooking is equivalent to 21 kilograms of LPG per month. Assuming that 30
percent of the 0.02 kilowatts per capita of electricity is consumed to support
community activities, the remaining electricity would be adequate to support six
compact fluorescent light bulbs used for four hours a day in addition to a
television for two hours a day plus a refrigerator-freezer with the average
energy efficiency projected for new U.S. units in 2001.
4. For example, in China the energy content of crop residues is
twice that of animal excrement on large and medium-size farms, and the fraction
of crop residues recoverable for energy purposes (about half the total
generation rate) is equivalent in terms of contained energy to about 20 percent
of China’s coal consumption rate (Li and others, 1998; Su and others,
1998).
5. Gasifiers are about 70 percent efficient in converting
biomass energy into gas energy, and producer gas stoves are about 50 percent
efficient. Thus the overall efficiency of converting biomass into heat energy
used in cooking is about 35 percent, which is double or more the efficiency of
typical biomass stoves.
6. In China the number without access to electricity in 1996 was
only 110 million, less than 13 percent of China’s rural population (Dai,
Liu, and Lu, 1998).
7. Lubricating oil can contribute as much to the generation cost
as natural gas fuel contributes to the generation costs of a modern large
combined-cycle power plant-compare tables 10.3 and 8.4.
8. If spark-ignited instead of compression-ignited engines were
used for power generation, the need for diesel fuel could be eliminated
entirely. But such engines are less efficient and more capital intensive than
diesel engines, and they must be de-rated more (about 50 percent relative to
operation on gasoline) than compression-ignition engines. As a result or are
often not competitive (Henderick and Williams, 2000).
9. This is about half the total residue generation rate. The
rest is used for paper-making, forage, or returned to the fields to sustain soil
quality (Li, Bai, and Overend, 1998).
10. This case is based on Dai and Lu (1998), Dai and Sun (1998),
and Dai, Liu, and Lu (1998).
11. The market price for LPG in the village is 3.3 yuan per
kilogram ($8.30 per gigajoule).
12. It is assumed that villagers are paid $0.33 a gigajoule for
residues delivered to the conversion facility. It is also assumed that gas is
sold for $6 a gigajoule (somewhat less than the LPG price) and hot water is sold
for $5 a gigajoule (lower than the gas price to discourage gas burning for
heat), and that electricity is sold to villagers for $0.10 a kilowatt-hour (the
price they would otherwise pay for grid electricity) and to the grid for $0.05 a
kilowatt-hour.
13. Demonstration projects include a Global Environment
Facility-sponsored, 30-megawatt-electric IGCC project in northeast Brazil
(chapter 7).
References
Baldwin, S.F. 1987. “Biomass Stoves: Engineering Design,
Development, and Administration.” Arlington, Va.: Volunteers in Technical
Assistance.
Baring-Gould, E.I, C.D. Barley, L. Flowers, P. Lilienthal, and
M. Shirazi. 1999. “Diesel Minigrid Retrofits: Technical and Economic
Aspects.” National Renewable Energy Laboratory, Golden, Colo.
Barnes, D.F., K. Openshaw, K.R. Smith, and R. van der Plas.
1993. “The Design and Diffusion of Improved Cookstoves.” The World
Bank Research Observer 8(2): 119-41.
Barnes, D.F., K. Openshaw, K.R. Smith, and R. van der Plas.
1994. What Makes People Cook with Improved Biomass Stoves? A Comparative
International Review of Stove Programmes. World Bank Technical Paper 242.
Washington, D.C.
Cao, J., and others (Planning Committee of Jilin Province).
1998. “Evaluation of Biomass Energy Supply and Utilization Technology
Prospect in Jilin Province.” In Proceedings of Workshop on Small-Scale
Power Generation from Biomass. Beijing: Working Group on Energy Strategies
and Technologies, China Council for International Cooperation on Environment and
Development.
Covarrubias, A. and K. Reiche. 2000. “A Case Study on
Exclusive Concession for Rural Off-Grid Service in Argentina.” In Energy
Services for the World’s Poor. Energy Sector and Development Report
2000. World Bank, Washington, D. C.
Dai, L., and Z. Lu. 1998. “Biomass Gasification System for
Central Gas Supply.” In L. Dai, J. Li, and R. Overend, eds., Biomass
Energy Conversion Technologies in China: Development and Evaluation. Report
prepared by the Energy Research Institute of the State Development Planning
Commission of China and National Renewable Energy Laboratory of the United
States. Beijing: China Environmental Science Press.
Dai, L., and L. Sun. 1998. “The Development and Assessment
of Biomass Gasification Conversion Technology Fed by Crop Straw.” In L.
Dai, J. Li, and R. Overend, eds., Biomass Energy Conversion Technologies in
China: Development and Evaluation. Report prepared by the Energy Research
Institute of the State Development Planning Commission of China and National
Renewable Energy Laboratory of the United States. Beijing: China Environmental
Science Press.
Dai, L., X. Liu, and Z. Lu. 1998. “Analysis of Users of
Biomass Gasification System of Central Gas Supply.” In L. Dai, J. Li, and
R. Overend, eds., Biomass Energy Conversion Technologies in China:
Development and Evaluation. Report prepared by the Energy Research Institute
of the State Development Planning Commission of China and the National Renewable
Energy Laboratory of the United States. Beijing: China Environmental Science
Press.
Davis, M. 1995. “Institutional Frameworks for Electricity
Supply to Rural Communities: A Literature Review.” Energy and Development
Research Centre, University of Cape Town, Cape Town, South Africa.
Deng, K., S. Gu, and W. Liu. 1996. “Rural Energy
Development in China.” Energy for Sustainable Development 3
(September): 31-36.
EC (European Commission) and UNDP (United Nations Development
Programme). 1999. Energy As a Tool for Sustainable Development for African,
Caribbean and Pacific Countries. Brussels.
Hande, H. 1999. Personal communication. Solar Electric Light
Company.
Henderick, P.M. 2000. “An Assessment of Biomass-Powered
Microturbines and the Potential for Applications in Rural China.” Report
322. Princeton University, Center for the Energy and Environmental Studies,
Princeton, N.J.
Henderick, P.M., and R.H. Williams. 2000. “Trigeneration
Using Crop Residues for a Northern Chinese Village.” Energy for
Sustainable Development 4 (October).
Kammen, D. M. 1999. “Bringing Power to the People.”
Environment 41 (5): 10-41.
Karekezi, S., and T. Ranja. 1997. Renewable Energy
Technologies in Africa. London: African Energy Policy Research Network and
Stockholm: Environment Institute and Zed Books. Stockholm.
Kartha, S., and E.D. Larson. 2000. A Bioenergy Primer: Roles
for Modernized Biomass Energy Systems in Promoting Sustainable Development.
Report prepared for the Energy and Atmosphere Programme, Sustainable Energy and
Environment Division. New York: United Nations Development Programme.
Kashyap, A. 2000. Personal communication. Rockefeller
Foundation, New York.
Larson, E.D., and H. Jin. 1999. “A Preliminary Assessment
of Biomass Conversion to Fischer-Tropsch Cooking Fuels for Rural China.” In
R.P. Overend and E. Chornet, eds., Biomass-A Growth Opportunity in Green
Energy and Value-Added Products. Volume 1 of the Proceedings of the 4th
Biomass Conference of the Americas. Oxford: Pergamon.
Li, J., J. Bai, and R. Overend, eds. 1998. Assessment of
Biomass Resource Availability in China. Report prepared by the Energy
Research Institute of the State Development Planning Commission of China and
National Renewable Energy Laboratory of the United States. Beijing: China
Environmental Science Press.
Li, J., A. Zhou, J. Bai, and Z. Su. 1998. “Study on the
Availability of Straw and Stalk Resources in China.” In J. Li, J. Bai, and
R. Overend, eds., Assessment of Biomass Resource Availability in China.
Report prepared by the Energy Research Institute of the State Development
Planning Commission of China and National Renewable Energy Laboratory of the
United States. Beijing: China Environmental Science Press.
Mali, Republic of, Ministry of Industry, Trade, and Handicraft;
and UNDP (United Nations Development Programme). 1999. “Overcoming Rural
Women’s Poverty with the Multipurpose Platform.” Bamako and New York.
McKeon, M. 1998. Personal communication. Dealership
representative, Catapillar Inc.
Mendis, Matthew S. 1999. Personal communication. Alternative
Energy Development, Inc.
Moreira, J.R., and A.D. Poole. 1993. “Hydropower and Its
Constraints.” In T.B. Johannson, H. Kelly, A.K.N. Reddy, and R.H. Williams,
eds., Renewable Energy: Sources for Fuels and Electricity. Washington,
D.C.: Island Press.
Mukunda, H.S., S. Dasappa, and U. Shrinivasa. 1993.
“Open-Top Wood Gasifiers.” In T.B. Johannson, H. Kelly, A.K.N. Reddy,
and R.H. Williams, eds., Renewable Energy: Sources for Fuels and
Electricity. Washington, D.C.: Island Press.
Natarajan, I. 1999. “Social Cost Benefit Analysis of the
National Programme on Improved Chulha in India.” Paper presented at the
United Nations Food and Agriculture Organization’s Regional Wood Energy
Development Program meeting on Wood Energy, Climate, and Health, October,
Phuket, Thailand.
Niu, Y. 2000. “Dimethyl Ether: Clean Fuel in the 21st
Century.” Paper presented at the Workshop on Polygeneration Strategies
Based on Oxygen-Blown Gasification, convened by the Working Group on Energy
Strategies and Technologies, China Council for International Cooperation on
Environment and Development, 11-12 May, Beijing.
Qui, D., L. Yan, and H. Zhang. 1996. “Status Review of
Sources and End-uses of Energy in China.” Energy for Sustainable
Development 3 (September): 7-13.
Ramakrishna, J. 1991a. “India Country Review.” Report
of the East-West Center Global Review of Improved Cookstoves. Prepared for the
World Bank’s Energy Sector Management Assistance Program, Washington, D.C.
Ramakrishna, J. 1991b. “Results and Analyses of the Global
Survey of Improved Cookstoves.” Report of the East-West Center Global
Review of Improved Cookstoves. Prepared for the World Bank’s Energy Sector
Management Assistance Program, Washington, D.C.
Reddy, A.K.N. 1999. “Goals, Strategies, and Policies for
Rural Energy.” Economic and Political Weekly 34 (49): 3435-45.
Reed, T.B., and A. Das. 1988. Handbook of Biomass Downdraft
Gasifier Engine Systems. SERI/SP-271-3022. Solar Energy Research Institute,
Golden, Colo.
Smith, K.R., S. Gu, K. Huang, and D. Qiu. 1993. “100
Million Improved Stoves in China: How Was It Done?” World Development
21(6): 941-61.
Stassen, H.E. 1995. Small-Scale Biomass Gasifiers for Heat
and Power: A Global Review. World Bank Technical Paper 296. Washington, D.C.
Su, Z., J. Li, J. Bai, and Z. Huang. 1998. “Research on
Availability of Excrement Resources on Large and Medium-Size Domestic Animal
Farms in China.” In J. Li, J. Bai, and R. Overend, eds., Assessment of
Biomass Resource Availability in China. Report prepared by the Energy
Research Institute of the State Development Planning Commission of China and
National Renewable Energy Laboratory of the United States. Beijing: China
Environmental Science Press.
WEC-FAO (World Energy Council and United Nations Food and
Agriculture Organization). 1999. The Challenge of Rural Energy Poverty in
Developing Countries. London.
Weise, E., R. Klockner, R. Kniehl, Ma Shenghong, and Qin
Jianping. 1995. “Remote Power Supply Using Wind and Solar Energy: A
Sino-German Technical Cooperation Project.” In Proceedings of the
Beijing International Conference on Wind Energy. Beijing: Organizing
Committee of the Beijing International Conference on Wind Energy ‘95.
World Bank. 1996. Rural Energy and Development: Improving
Energy Supplies for Two Billion People. Washington, D.C.
World Bank. 1997. Clear Water, Blue Skies: China’s
Environment in the New Century. China 2020 series. Washington, D.C.
World Bank. 1999. World Development Report 1998/99: Knowledge
for Development. New York: Oxford University Press.
Wu, L. 1995. “Inner Mongolia: One of the Pioneers of
Chinese Wind Power Development.” In Proceedings of the Beijing
International Conference on Wind Energy. Beijing: Organizing Committee of
the Beijing International Conference on Wind Energy ‘95.
Yao, X. 1999. “Wood: Biomass Use and Emissions in
China.” Paper presented at the United Nations Food and Agriculture
Organization’s Regional Wood Energy Development Program meeting on Wood
Energy, Climate, and Health, October, Phuket,
Thailand.