Back to Home
Page of CD3WD Project or Back to list of CD3WD Publications
 |  |  | World Energy Assessment - Energy and the Challenge of Sustainability (UNDESA - UNDP - WEA - WEC, 2000, 517 p.) |  |  | PART II. ENERGY RESOURCES AND TECHNOLOGY OPTIONS | | | Chapter 5. Energy Resources | |  | (introduction...) | | | Definitions and units | | | Oil reserves and resources | | | (introduction...) | | | Ultimately recoverable resources - the static or geologists’ view | | | Available resources - the dynamic or economists’ view | | | Reconciling the two views | | | Gas reserves and resources | | | (introduction...) | | | Conventional gas | | | Unconventional gas | | | Coal reserves and resources | | | (introduction...) | | | Current resources and reserves | | | Additional resources | | | Summary of fossil resources | | | Reserves and resources of fissile materials | | | (introduction...) | | | Uranium reserves | | | Uranium resources | | | Thorium reserves and resources | | | Hydroelectric resources | | | (introduction...) | | | Theoretical potential | | | Technical potential | | | Economic potential | | | Major constraints to hydroelectricity expansion | | | Biomass resources | | | (introduction...) | | | Sources | | | Perceptions and problems | | | Technical potential of biomass energy plantations | | | Energy balances and biomass productivity | | | Agricultural and forestry residues and municipal waste | | | Environmental implications of biomass production | | | Environmentally motivated responses to biomass production | | | Economics | | | Solar energy resources | | | Wind energy resources | | | Geothermal energy resources | | | Ocean energy resources | | | Conclusion | | | Chapter 6. Energy End-Use Efficiency | | | (introduction...) | | | Recent trends in energy intensity in countries and regions | | | (introduction...) | | | OECD countries | | | Eastern Europe and the Commonwealth of Independent States | | | Developing Asia, Africa, and Latin America | | | Potential benefits of technology transfer | | | (introduction...) | | | Transition economies | | | Developing countries | | | Types of potential for increased energy efficiency | | | The economic potential of energy efficiency by region and sector | | | (introduction...) | | | Western Europe | | | North America | | | Japan and Southeast Asia | | | Eastern Europe | | | Russia and other members of the Commonwealth of Independent States | | | India | | | China | | | Latin America | | | Africa | | | The economic potential of energy efficiency - a systemic perspective | | | Technical and theoretical potentials for rational energy use after 2020 | | | Obstacles, market imperfections, and disincentives for efficient energy use | | | (introduction...) | | | General obstacles | | | Target group-specific and technology-specific obstacles | | | National and international policies to exploit the economic potential of energy efficiency in end-use sectors | | | (introduction...) | | | General policy measures | | | Sector- and technology-specific policy measures | | | International policy measures | | | Conclusion | | | Chapter 7. Renewable Energy Technologies | | | (introduction...) | | | Biomass energy | | | (introduction...) | | | The potential of biomass energy | | | Biomass energy conversion technologies | | | Environmental impacts of biomass energy systems | | | Economics of biomass energy systems | | | Implementation issues | | | Conclusion | | | Wind energy | | | (introduction...) | | | The potential of wind energy | | | Development of installed wind power | | | Technology developments | | | System aspects | | | Environmental aspects | | | Economic aspects | | | Implementation issues | | | Conclusion | | | Photovoltaic solar energy | | | (introduction...) | | | Characteristics of the source | | | The potential of photovoltaic solar energy | | | Photovoltaic market developments | | | Current status and future development of photovoltaic solar cells and modules | | | System aspects | | | Environmental aspects | | | Economic aspects | | | Implementation issues | | | Space-based solar energy | | | Conclusion | | | Solar thermal electricity | | | (introduction...) | | | The potential of solar thermal electricity | | | Solar thermal electricity market developments | | | Solar thermal electricity technologies | | | Economic aspects | | | Environmental and social aspects | | | Conclusion | | | Low-temperature solar energy | | | (introduction...) | | | Low-temperature solar energy potential and market developments | | | Low-temperature solar energy technologies and systems | | | Implementation issues | | | Conclusion | | | Hydroelectricity | | | (introduction...) | | | The potential of hydroelectricity | | | Hydroelectric technology development | | | System aspects | | | Environmental and social impacts | | | Economic and financial aspects | | | Conclusion | | | Geothermal energy | | | (introduction...) | | | The potential of geothermal energy | | | Recent developments | | | Potential market developments | | | Environmental aspects | | | Conclusion | | | Marine energy technologies | | | (introduction...) | | | The potential and technology of marine energy | | | Economic aspects | | | Environmental aspects | | | Implementation issues | | | Conclusion | | | System aspects | | | (introduction...) | | | Trends in the energy sector | | | Characteristics of renewable energy systems | | | Electrical system design | | | Grid integration of intermittent renewables | | | Intermittent renewables and energy storage | | | Value of renewables | | | Conclusion | | | Policies and instruments | | | (introduction...) | | | Cost of competing conventional energy | | | Financing and fiscal policy | | | Regulation | | | Getting new technologies started | | | Conclusion | | | Chapter 8. Advanced Energy Supply Technologies | | | (introduction...) | | | Advanced fossil energy technologies | | | Fossil fuel supply considerations as a context for fossil energy innovation | | | Setting goals for advanced fossil energy technologies | | | Technologies and strategies for moving towards near-zero emissions | | | Other near-term advanced fossil energy technologies | | | Conclusion | | | Advanced nuclear energy technologies | | | (introduction...) | | | Rationale for reconsidering the nuclear option | | | The need for advanced technologies | | | Advanced nuclear generating options for the immediate future | | | Nuclear energy for the long term | | | The outlook for addressing the challenges |
|
World Energy Assessment - Energy and the Challenge of Sustainability (UNDESA - UNDP - WEA - WEC, 2000, 517 p.)
PART II. ENERGY RESOURCES AND TECHNOLOGY OPTIONS
Chapter 5. Energy Resources
Hans-Holger Rogner (Germany)
LEAD AUTHORS: Fritz Barthel (Germany), Maritess Cabrera
(Philippines), Andre Faaij (Netherlands), Marc Giroux (France), David Hall
(United Kingdom), Vladimir Kagramanian (Russian Federation), Serguei Kononov
(Russian Federation), Thierry Lefevre (France), Roberto Moreira (Brazil), R.
N�tstaller (Austria), Peter Odell (United Kingdom), and Martin Taylor (United
States and United Kingdom)
|
ABSTRACT
A comprehensive account of the world’s energy resource
endowment is essential for any long-term energy assessment. Energy resources
exist in different forms - some exist as stocks and so are exhaustible, others
exist as flows and are inexhaustible, and a third form is based on exhaustible
stocks that can be leveraged to resemble renewables. Most important, energy
resources evolve dynamically as a function of human engineering ingenuity,
driven by the desire to supply affordable and convenient energy services.
Although the term stocks suggests finiteness (which is ultimately correct), the
accessible portion depends on technology and on the future demand for that
resource. Resources not demanded by the market are ‘neutral stuff’.
Demand plus advances in technology and knowledge turn neutral stuff into
reserves that are replenished upon use by further advances in technology and
knowledge, enabling humans to tap into resources previously beyond reach. But
for stocks there will eventually be a limit. In contrast, resources based on
annually recurring flows are distinctly different from stocks: harvested
prudently, they are renewable. But resources are not an end in themselves, and
their attractiveness must be seen in the context of societies’ energy
service needs, of the technologies that convert resources into energy services,
and of the economics associated with their use. This chapter assesses whether
long-term energy resource availability could impede sustainable development and,
based on a dynamic technology concept, provides a comprehensive account of the
world’s energy resource endowment. |
This chapter reviews fossil, nuclear, and renewable
energy resources. The reserve and resource volumes presented here cover the
ranges considered robust by most of the lead authors. The main controversy yet
to be resolved concerns the different views on the roles of technology and
demand in the long-term availability of a particular resource. Subject to debate
is the extent to which reserves can be converted from additional conventional
resources with lower geological assurance and from unconventional resources
lacking economic attractiveness given current markets and technologies. Natural
flows are immense for renewable resources, but the level of their future use
will depend on the technological and economic performance of technologies
feeding on these flows as well as on possible constraints on their use. The
long-term availability of energy resources will likely become more an issue of
the degree to which future societies want to balance environmental and economic
tradeoffs, control greenhouse gas emissions, and internalise externalities, or
of the technological and economic performance of different clean energy
conversion technologies, than a question of resource existence.
This chapter examines long-term energy resource availability
primarily from the perspectives of theoretical maximums, or ultimately
recoverable resources. Admittedly, it can be argued that an analysis based on
ultimately recoverable resources is irrelevant - hydrocarbon occurrences or
natural flows become resources only if there is demand for them and appropriate
technology has been developed for their conversion and use. Indeed, energy
resources generally should not be scrutinised without reference to the chain
extending from the extraction of resources to the supply of energy services -
that is, along all the conversion steps to the point of what consumers really
want: transportation, communication, air conditioning, and so on. But the
assessment in this volume has been structured so that each link of the chain is
explored separately. Energy conversion technologies are discussed in chapters 7
(renewable energy technologies) and 8 (advanced fossil and nuclear energy
technologies), as well as in chapter 6 (energy efficiency).
|
Hydrocarbon occurrences
become resources only if there
is
demand for them and appropriate
technology has been developed
for
their conversion
and use. |
Definitions and units
A variety of terms are used to describe energy reserves, and
different authors and institutions have different meanings for the same terms.
Meanings also vary for different energy sources. The World Energy Council
defines resources as "the occurrences of material in recognisable form" (WEC,
1998). For oil, it is essentially the amount of oil in the ground. Reserves
represent a portion of resources and is the term used by the extraction
industry. British Petroleum notes that proven reserves of oil are "generally
taken to be those quantities that geological and engineering information
indicates with reasonable certainty can be recovered in the future from known
reservoirs under existing economic and operating conditions" (BP, 1999). Other
common terms include probable reserves, indicated reserves, and inferred
reserves - that is, hydrocarbon occurrences that do not meet the criteria of
proven reserves. Undiscovered resources are what remains and, by definition, one
can only speculate on their existence. Ultimately recoverable resources are the
sum of identified reserves and the possibly recoverable fraction of undiscovered
resources and generally also include production to date. Then there is the
difference between conventional and unconventional occurrences (oil shale, tar
sands, coalbed methane, clathrates, uranium in black shale or dissolved in sea
water), especially the rate at which unconventional resources can be converted
into conventional reserves.
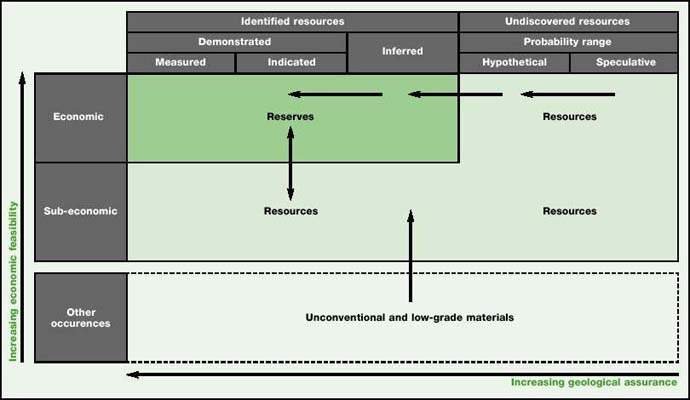
FIGURE 5.1. PRINCIPLES OF RESOURCE
CLASSIFICATION
Source: Based on McKelvey, 1967.
To the extent possible, this chapter uses the McKelvey box,
which presents resource categories in a matrix with increasing degrees of
geological assurance and economic feasibility (figure 5.1). This scheme,
developed by the U.S. Bureau of Mines and the U.S. Geological Survey (USGS,
1980), is to some extent also reflected in the international classification
system recently proposed by the United Nations.
In this classification system, resources are defined as
concentrations of naturally occurring solid, liquid, or gaseous material in or
on the Earth’s crust in such form that economic extraction is potentially
feasible. The geologic dimension is divided into identified and undiscovered
resources. Identified resources are deposits that have known location, grade,
quality, and quantity or that can be estimated from geologic evidence.
Identified resources are further subdivided into demonstrated (measured plus
indicated) and inferred resources, to reflect varying degrees of geological
assurance. Reserves are identified resources that are economically recoverable
at the time of assessment (see the British Petroleum definition, above).
Undiscovered resources are quantities expected or postulated to
exist under analogous geologic conditions. Other occurrences are materials that
are too low-grade or for other reasons not considered technically or
economically extractable. For the most part, unconventional resources are
included in ‘other occurrences’.
The boundary between reserves, resources, and occurrences is
current or expected profitability of exploitation, governed by the ratio of
market price to cost of production. Production costs of reserves are usually
supported by actual production experience and feasibility analyses, while cost
estimates for resources are often inferred from current production experience
adjusted for specific geological and geographic conditions.
|
Technological improvements
are continuously pushing
resources
into the reserve category by
advancing knowledge and
lowering
extraction costs. |
For several reasons, reserve and resource quantities and related
supply-cost curves are subject to continuous revision. Production inevitably
depletes reserves and eventually exhausts deposits, while successful exploration
and prospecting add new reserves and resources. Price increases and cost
reductions expand reserves by moving resources into the reserve category and
vice versa. The dynamic nature of the reserve-resource relationship is
illustrated by the arrows in figure 5.1. Technology is the most important force
in this process. Technological improvements are continuously pushing resources
into the reserve category by advancing knowledge and lowering extraction costs.
The outer boundary of resources and the interface to other
occurrences is less clearly defined and often subject to a much wider margin of
interpretation and judgement. Other occurrences are not considered to have
economic potential at the time of classification. But over the very long term,
technological progress may upgrade significant portions to resources.
In 1992 the United Nations Economic Commission on Europe (UNECE)
launched an effort to define a generally applicable resource classification
scheme with a higher resolution of technical and economic feasibility than the
McKelvey box. By adding a third dimension - the level of actual feasibility of
extraction based on geological engineering assessments - this new classification
provides a more accurate picture of the accessibility of resources. In 1997 the
United Nations International Framework Classification for Reserves/Resources -
Solid Fuels and Mineral Commodities (UNFC) was completed and recommended by the
Economic and Social Council (ECOSOC) for world-wide application. But it will
take time for the UNFC to be universally adopted by public and private
institutions and for fossil reserves and resources to be consistently reported
in compliance with the UNFC.
For renewable energy sources, the concepts of reserves,
resources, and occurrences need to be modified. Renewables represent annual
flows available, in principle, on an indefinite sustainable basis. Fossil energy
reserves and resources, although expanding over time, are fundamentally finite
quantities. In this context the annual natural flows of solar, wind, hydro, and
geothermal energy and quantities grown by nature in the form of biomass (often
referred to as theoretical potentials) would correspond to occurrences. The
concept of technical potentials can be used as a proxy for energy resources,
while economic potentials correspond to reserves. The distinction between
theoretical and technical potentials reflects the degree of use determined by
thermodynamic or technological limitations without consideration of practical
feasibility or costs. Thus the economic potential is the portion of the
technical potential that could be used cost-effectively. In terms of reserves,
resources, and occurrences of hydrocarbons, economic and technical potentials
are dynamically moving targets in response to market conditions and technology
availability and performance.
This chapter reports oil resources in gigatonnes (1 Gt =
109 tonnes) and exajoules (1 EJ = 1018 joules) using the
energy equivalent of 42 gigajoules per tonne of oil equivalent (GJ per toe). Gas
resources are reported in tera cubic metres (1 Tm3 = 1012
cubic metres) and converted to EJ using 37 gigajoules per 1,000 cubic
metres (GJ per 1,000 m3). Coal resources are usually reported in
natural units, although the energy content of coal may vary considerably within
and between different coal categories. The Bundesanstalt f�r Geowissenschaften
und Rohstoffe (Federal Institute for Geosciences and Natural Resources, referred
to here as the BGR) in Hannover (Germany) is the only institution that converts
regional coal occurrences into tonnes of coal equivalent (1 tce = 29
gigajoules). Thus coal resource data come from the BGR. Uranium and other
nuclear materials are usually reported in tonnes of metal. The thermal energy
equivalent of 1 tonne of uranium in average once-through fuel cycles is about
589 terajoules (IPCC,
1996a).
Oil reserves and resources
Views on the long-term availability of oil and natural gas
continue to spark controversy and debate. One school of thought believes that
the best oil fields have already been discovered and that the amount of oil
still to be discovered is somewhat limited. The other school regards oil
reserves as a dynamic quantity, driven by demand and technological advances. The
second school is more optimistic about future hydrocarbon
availability.
Ultimately recoverable resources - the static or geologists’ view
For many years, world oil reserves have experienced small but
steady increases, which implies that the discovery or delineation of new
reserves has at least kept pace with production. But many geologists focus on
the concept of a quasi-fixed stock of hydrocarbon occurrences that, once
production commences, can only decrease. For oil, they argue that few new oil
fields have been discovered since the mid-1970s, and that most reserve increases
have come from revisions of previously underestimated existing reserves
(Hatfield, 1997; Campbell and Laherrere, 1998) and improved recovery techniques.
Peak production lags behind peak discovery (of the mid-1960s) by several
decades. Larger and more obvious fields are found first, leading to an early
peak in discovery and diminishing returns in exploration: the more that is
found, the less is left to find. Fields that are smaller and harder to find and
to exploit follow, but eventually the fixed stock will be exhausted. Some 90
percent of current global oil production comes from fields more than 20 years
old.
TABLE 5.1. ESTIMATED OIL RESERVES
|
Region |
Identified reserves (Masters and others, 1994) |
Identified reserves plus 95%a (Masters and
others, 1994) |
Identified reserves plus modeb (Masters and
others, 1994) |
Identified reserves plus 5%c (Masters and
others, 1994) |
Proven recoverable reserves (WEC, 1998) |
Proven reserves (BP, 1999) |
Total resources from enhanced oil recoveryd
|
|
Gigatonnes |
Exajoules |
Gigatonnes |
Exajoules |
Gigatonnes |
Exajoules |
Gigatonnes |
Exajoules |
Gigatonnes |
Exajoules |
Gigatonnes |
Exajoules |
Gigatonnes |
Exajoules |
|
North America |
8.5 |
356 |
14.3 |
599 |
17.0 |
712 |
23.7 |
992 |
4.6 |
193 |
4.6 |
193 |
13.6 |
569 |
|
Latin America and Caribbean |
17.3 |
724 |
22.6 |
946 |
26.2 |
1,097 |
41.6 |
1,742 |
19.2 |
804 |
19.9 |
833 |
23.8 |
996 |
|
Western Europe |
5.6 |
234 |
6.8 |
285 |
7.7 |
322 |
11.2 |
469 |
2.5 |
105 |
2.5 |
105 |
3.9 |
163 |
|
Central and Eastern Europe |
0.3 |
13 |
0.4 |
17 |
0.5 |
21 |
1.1 |
46 |
0.3 |
13 |
0.2 |
8 |
0.5 |
21 |
|
Former Soviet Union |
17.0 |
712 |
25.1 |
1,051 |
30.6 |
1,281 |
49.9 |
2,089 |
8.0 |
335 |
9.1 |
381 |
11.2 |
469 |
|
Middle East and North Africa |
87.6 |
3,668 |
97.0 |
4,061 |
104.6 |
4,379 |
126.4 |
5,292 |
99.6 |
4,170 |
96.8 |
4,053 |
59.2 |
2,479 |
|
Sub-Saharan Africa |
4.0 |
167 |
5.9 |
247 |
7.3 |
306 |
12.3 |
515 |
4.0 |
167 |
4.5 |
188 |
3.3 |
138 |
|
Pacific Asia |
3.1 |
130 |
4.1 |
172 |
4.8 |
201 |
7.3 |
306 |
1.5 |
63 |
1.5 |
63 |
2.1 |
88 |
|
South Asia |
1.0 |
42 |
1.1 |
46 |
1.3 |
54 |
1.8 |
75 |
0.8 |
33 |
0.5 |
21 |
0.6 |
25 |
|
Centrally planned Asia |
5.1 |
214 |
7.8 |
327 |
9.8 |
410 |
17.9 |
749 |
5.4 |
226 |
3.4 |
142 |
3.7 |
155 |
|
Pacific OECD |
0.4 |
17 |
0.6 |
25 |
0.7 |
29 |
1.3 |
54 |
0.4 |
17 |
0.4 |
17 |
0.5 |
21 |
|
Totale |
150 |
6,277 |
186 |
7,776 |
210 |
8,812 |
295 |
12,329 |
146 |
6,126 |
143 |
6,004 |
123 |
5,124 |
Note: Excludes cumulative production to the date of
assessment. a. Identified reserves plus estimates of undiscovered resources with
a 95 percent probability of discovery. b. Identified reserves plus estimates of
undiscovered resources with a 50 percent probability of discovery. c. Identified
reserves plus estimates of undiscovered resources with a 5 percent probability
of discovery. d. Includes enhanced recovery of past and future oil production.
e. Totals rounded.
Cumulative production is a good proxy for geological knowledge
gained through exploration experience. All these facts leave no room for any
conclusion other than that peak production is being approached rapidly. In the
1960s ultimately recoverable resources became a popular concept for quantifying
the fixed stock of hydrocarbon occurrences. Ultimately recoverable resources
include cumulative production, proven reserves at the time of estimation, and
oil remaining to be discovered - in other words, the ultimate oil wealth
available to humans. For the past 40 years most estimates of ultimately
recoverable resources for conventional oil have ranged from 200 - 400
gigatonnes. More recently, Campbell and Laherrere (1998) put ultimately
recoverable reserves at about 250 gigatonnes, Hiller (1999) at 350 gigatonnes,
Edwards (1997) at 385 gigatonnes, Masters and others (1994) at 281 - 390
gigatonnes, and Odell (1997) at 410 gigatonnes. All these estimates include
production to the date of estimation (96 - 110 gigatonnes).
The debate on the size of ultimately recoverable resources and
the time horizon when the depletion midpoint will be reached includes only
conventional oil occurrences. Shale oil, tar sands (natural bitumen), and heavy
crude oil are considered unconventional oil resources, defined as occurrences
that cannot be tapped with conventional production methods for technical or
economic reasons or both (Rogner, 1997; Gregory and Rogner, 1998). These
resources form a large part of the vast store of hydrocarbons in the
Earth’s crust and, in the case of oil, have been assessed to be at least as
large as conventional oil resources (see below). The existence of unconventional
oil and gas is acknowledged by ‘fixed stock’ analysts, but they are
less sanguine about the future technological potential for bringing these
resources to market. Technological pessimism and an exclusive focus on
conventional oil largely explain the geologists’ view that global oil
production will reach its peak and mid-depletion point in the near future.
Conventional oil. Table 5.1 reports recent estimates,
excluding cumulative production to date, of identified or proven oil reserves
and natural gas liquids. All these estimates report reserves at around 1,000
billion barrels of oil (143 - 150 gigatonnes).
Masters and others (1994) estimate identified reserves on 1
January 1993 to be 150 gigatonnes (6,277 exajoules), only slightly higher than
British Petroleum and World Energy Council estimates of proven reserves at the
end of 1997.1 Masters and others also estimate undiscovered oil
resources based on a modified Delphi technique and geological analogies. Their
low estimate (95 percent probability of discovery) brings their total for
recoverable conventional oil reserves to 186 gigatonnes (7,771 exajoules). If
cumulative production until 1994 of 95 gigatonnes (3,990 exajoules) is added,
the total for ultimately recoverable resources is 281 gigatonnes (11,800
exajoules). The medium (mode) estimate of undiscovered resources brings total
recoverable oil reserves to 210 gigatonnes (8,812 exajoules) and ultimately
recoverable resources to 305 gigatonnes (12,810 exajoules). The high (5 percent
probability) estimate of undiscovered resources brings total recoverable oil
reserves to 295 gigatonnes (12,329 exajoules) and ultimately recoverable
resources to 390 gigatonnes (16,380 exajoules).
TABLE 5.2. ESTIMATED UNCONVENTIONAL OIL RESERVES AND
RESOURCES
|
Region |
Oil shale |
Heavy crude oil |
Tar sands (natural bitumen) |
|
Identified resources(BGR, 1998) |
Total resources(BGR, 1998) |
Proven recoverable and estimated additional reserves(WEC,
1998) |
Oil in place(BGR, 1998) |
Reserves and resources(BGR, 1998) |
Future potential recovery(Meyer, 1997) |
Oil in place(BGR, 1998) |
Reserves and resources(BGR, 1998) |
Proven recoverable and estimated additional reserves(WEC,
1998) |
|
Gigatonnes |
Exajoules |
Gigatonnes |
Exajoules |
Gigatonnes |
Exajoules |
Gigatonnes |
Exajoules |
Gigatonnes |
Exajoules |
Gigatonnes |
Exajoules |
Gigatonnes |
Exajoules |
Gigatonnes |
Exajoules |
Gigatonnes |
Exajoules |
|
North America |
1.1 |
48 |
351.6 |
14,767 |
217.0 |
9,114 |
15.7 |
659 |
2.3 |
96 |
2.0 |
82 |
233 |
9,786 |
40.7 |
1,710 |
51.7 |
2,173 |
|
Latin America and Caribbean |
0.3 |
14 |
19.4 |
814 |
9.6 |
405 |
229.3 |
9,631 |
59.7 |
2,509 |
51.2 |
2,152 |
190 |
7,980 |
33.2 |
1,395 |
1.2 |
49 |
|
Western Europe |
0.5 |
22 |
8.9 |
374 |
0.0 |
1 |
9.8 |
412 |
3.7 |
155 |
3.2 |
133 |
0 |
0 |
0.0 |
0 |
0.0 |
0 |
|
Central and Eastern Europe |
1.1 |
45 |
2.8 |
116 |
0.0 |
0 |
0.1 |
4 |
0.1 |
5 |
0.1 |
5 |
0 |
0 |
0.0 |
0 |
0.0 |
0 |
|
Former Soviet Union |
4.2 |
178 |
9.6 |
405 |
6.5 |
273 |
0.1 |
4 |
19.2 |
805 |
16.4 |
690 |
232 |
9,744 |
40.5 |
1,703 |
0.0 |
0 |
|
Middle East and North Africa |
7.6 |
319 |
8.1 |
340 |
28.0 |
1,175 |
45.2 |
1,898 |
20.2 |
847 |
17.3 |
726 |
0 |
0 |
0.0 |
0 |
0.0 |
0 |
|
Sub-Saharan Africa |
0.0 |
0 |
16.4 |
690 |
0.0 |
0 |
1.4 |
59 |
0.9 |
39 |
0.6 |
27 |
3 |
126 |
0.5 |
22 |
0.0 |
0 |
|
Pacific Asia |
1.0 |
40 |
1.0 |
40 |
1.7 |
71 |
1.1 |
46 |
1.5 |
62 |
1.4 |
59 |
0 |
0 |
0.0 |
0 |
0.0 |
0 |
|
South Asia |
0.0 |
0 |
0.0 |
0 |
0.0 |
0 |
1.0 |
42 |
0.0 |
2 |
0.0 |
1 |
0 |
0 |
0.0 |
0 |
0.0 |
0 |
|
Centrally planned Asia |
0.6 |
25 |
20.0 |
840 |
0.0 |
0 |
10.8 |
454 |
2.6 |
111 |
2.3 |
95 |
0 |
0 |
0.0 |
0 |
0.0 |
0 |
|
Pacific OECD |
3.8 |
160 |
44.5 |
1,870 |
36.0 |
1,513 |
0.0 |
0 |
0.0 |
1 |
0.0 |
1 |
0 |
0 |
0.0 |
0 |
0.0 |
0 |
|
Total |
20.3 |
851 |
482.3 |
20,256 |
298.9 |
12,552 |
314.5 |
13,209 |
110.3 |
4,632 |
94.5 |
3,971 |
658 |
27,636 |
115.0 |
4,830 |
52.9 |
2,222 |
In its 1998 survey the World Energy Council reported proven
recoverable oil reserves of 146 gigatonnes (6,126 exajoules) and estimates
additional recoverable reserves (excluding speculative occurrences) of 28
gigatonnes (1,192 exajoules), for a total of 174 gigatonnes (7,318 exajoules).
This compares well with the Masters and others estimate of identified reserves
plus 95 percent probability of undiscovered resources of 186 gigatonnes. The oil
reserve estimates in table 5.1 reflect the views of geologists on the
availability of conventional oil and are consistent with the ultimately
recoverable resource estimates presented earlier.
Today only about 35 percent of the oil in place is recovered by
primary and secondary production methods. With enhanced oil recovery methods,
this rate can be increased to as much as 65 percent of the original oil in place
in a reservoir, though at higher extraction costs (BGR, 1995). Thus the
application of enhanced oil recovery methods in abandoned fields and new
developments increases conventional oil resources.
Table 5.1 shows the potential resources resulting from the use
of enhanced oil recovery techniques. Resources are calculated based on an
average recovery rate of 35 percent achieved in historical production and used
in the delineation of proven recoverable reserves, and an enhanced oil recovery
rate of 15 percent, for an overall recovery rate of 50 percent.
Unconventional oil. The vast amounts of unconventional
oil occurrences include oil shale, heavy crude oil, and tar sands.
Unconventional oil is already economic to exploit in some places, so some is
defined as reserves. Further development may depend on higher oil prices,
technological developments, and long-term demand for liquid fuels. According to
BGR (1998), reserves of unconventional oil could be as high as 245 gigatonnes,
substantially exceeding proven reserves of conventional oil (table 5.2).
Oil shale is a sedimentary rock rich in organic matter
containing more than 10 percent kerogen. It can be used directly as a fuel in
power plants or processed to produce synthetic petroleum products. The kerogen
content of oil shale varies widely. According to BGR (1995), only about 1
percent of world resources contains more than 100 litres of oil per cubic metre
rock, while 85 percent have less than 40 litres per cubic metre.
Data on oil shale resources are presented in table 5.2. The most
recent BGR (1998) estimate of oil shale resources is 482 gigatonnes, down from
920 gigatonnes in the 1995 estimate. WEC (1998) estimates recoverable and
estimated additional reserves at 299 gigatonnes. Major oil shale resources are
in China, Estonia, the United States, Australia, and Jordan. The large regional
differences between the BGR and WEC estimates are likely the result of different
definitions.
Because of the high costs of mining and processing, oil shale is
produced only in small quantities in China and Estonia. Estonia is the only
country with an economy dominated by oil shale as a source of energy and for
more than 70 years has been the largest user of oil shale in power generation.
Recent production totalled 20 million tonnes of oil shale a year (Hobbs, 1995).
Heavy crude oil is defined as high-viscosity crude oil
with a density equal to or less than 20° API (934 kilograms per cubic
metre). Extra heavy oil is crude oil with a density equal to or less than
10° API (1,000 kilograms per cubic metre). Unlike tar sands, the viscosity
of these hydrocarbons is below 10,000 millipoise (see below). Heavy oil is
formed by the degradation of conventional oil in shallow reservoirs.
Recent estimates of heavy oil resources are summarised in table
5.2. BGR (1995) estimates oil in place to be 315 gigatonnes. In BGR (1998), 33
of these are considered reserves and 77 are considered resources, for a total of
110 gigatonnes - well within the range of future potential recovery given by
Meyer (1997). About half of heavy oil resources are in Venezuela; the former
Soviet Union, Kuwait, Iraq, Mexico, and China account for most of the rest.
Meyer (1997) uses the term unproved reserves because his
estimates include some probable and possible reserves. Quantities stated under
undiscovered potential recovery include all resources based on geological and
engineering judgement, using a recovery factor of 10 percent.
Some 8 percent of world oil production come from heavy oil
reservoirs, with Venezuela, the United States, Canada, Iraq, Mexico, and the
former Soviet Union being major producers (BGR, 1998). Due to the nature of
heavy oil, enhanced oil recovery methods such as steam flooding and hot water,
polymer, and carbon dioxide injection are generally required for its extraction.
Tar sands (natural bitumen) and extra heavy oil
are sands or sandstones that contain a large portion of tarry hydrocarbons
with a viscosity exceeding 10,000 millipoise. They are formed by thermal
metamorphism and biodegradation of conventional oil deposits. The high viscosity
of these hydrocarbons requires unconventional extraction methods such as mining
with bucket-wheel excavators or in truck and shovel operations. Natural bitumen
typically contains large portions of sulphur and trace elements, including
vanadium and nickel.
BGR (1998) estimates that 115 of the 658 gigatonnes of tar sands
qualify as possible reserves (see table 5.2). Commercial production is limited
to the Athabasca tar sand deposits of Alberta (Canada), with a volume of 25
million tonnes in 1998 (WEC, 1998). To reduce the environmental disturbance
caused by surface mining, in situ techniques are increasingly used (box 5.1). In
addition, new extraction technologies, such as steam-assisted gravity drainage,
are being developed to reduce oil viscosity through steam injection (George,
1998). The use of extra heavy oil has commenced in the Orinoco oil belt of
Venezuela (BGR,
1998).
Available resources - the dynamic or economists’ view
Unlike geologists, who tend to treat resources as an innate
component of the physical world, economists view what exists in the Earth’s
crust as ‘neutral stuff’ (Odell, 1998) that becomes a resource only if
there is a market demand for it. Put differently, "there are huge amounts of
hydrocarbons in the earth’s crust� (Adelman and Lynch, 1997), and
"estimates of declining reserves and production are incurably wrong because they
treat as a quantity what is really a dynamic process driven by growing
knowledge" (Nehring, 1998). Improvements in technology - such as
three-dimensional seismic surveys and extended-reach drilling - have allowed
higher recovery rates from existing reservoirs and the profitable development of
fields once considered uneconomic or technically beyond reach, expanding the
boundary of reserves and shifting resources into the reserve category.
|
BOX 5.1. ENVIRONMENTAL OBSTACLES TO EXTRACTING
UNCONVENTIONAL OIL
The production of unconventional oil and the necessary upgrade
to marketable fuels can hurt local environments. Mining, conversion, and
upgrading to synthetic crude oil can produce toxic heavy metals and large
quantities of solid and acidic liquid and gaseous wastes that need to be
contained, cleaned, and disposed ofin an environmentally benign manner. This may
require stringent environmental controls and new policies for toxic waste
disposal. Extracting hydrocarbons from unconventional oils such as tar sands,
heavy oils, and oil shale involves very large surface (open-pit or strip) mining
and underground mining (room and pillar technique), steam soaking, steam
flooding, or in situ combustion. Here the production of tar sand and its
upgrading to synthetic crude oil are used to show the potential environmental
constraints of large-scale unconventional oil production.
The production of synthetic crude oil from Alberta,
Canada’s tar sand deposits involves open-pit mining and handling of 5
tonnes of tar sands and overburden per barrel of oil produced (Penner and
others, 1982), milling to separate the bitumen from the sand, and upgrading it
to commercial quality. Syncrude, a Canadian company, processes 510,000 tonnes of
tar sands a day and recovers about one barrel of heavy oil for every 2 tonnes of
tar sands processed (Stosur and others, 1998). A hot water process is the most
common for extracting oil from the sand. The process is energy-intensive and
requires large quantities of hot water. Syncrude operations require 1,400 tonnes
an hour of water heated to nearly 500 degrees Celsius. Water is recycled to the
maximum extent (90 percent). The remaining materials (tailings) after the
bitumen has been extracted (extraction rate some 90 percent)are liquids and
sand. Most of the tailings are the excavated overburden rock and rejected sand;
both can be stockpiled and used as backfill with little threat to the
environment (Stosur and others, 1998).
Things are different for the liquid tailings, which are
contaminated with organic and inorganic compounds (sulphur, porphyrins, salts of
organic acids) and can seriously damage nearby aquatic ecosystems. The liquid is
stored in settling ponds, allowing water to clarify before it is recycled. These
ponds are designed as ‘zero discharge’ basins, and no process-affected
water is discharged in running waters. But while tailings sand settles out
quickly, the fine-grained materials (silts and clays) and residual bitumen
consolidate slowly and can pose a long-term problem and liability. Tailings
ponds must be constructed to last several decades and must be guarded against
erosion, breaching, and foundation creep until better disposal practices become
available (Stosur and others, 1998). New processes such as dry retorting - which
generates dry tailings - are expected to minimise the risk of acid drainage from
tar sand tailings. Other methods include faster consolidation of fine tailings,
detoxification of tailing pond water, and reprocessing of fine tailings
(including co-production of minerals and metals).
Spent tar sand (mainly sand, silt, and clay contaminated with
the remaining bitumen and caustic compounds) is put in specially designed
storage areas to avoid acid drainage or used as fill material in mine
reclamation efforts. While the disrupted land area can be considerable, land
reclamation is usually imposed on mine operators to limit permanent
environmental damage and to return land to a stable, biologically
self-sustaining state.
Upgrading operations are the primary source of airborne
emissions. Sulphur dioxide, particulates, hydrocarbons, vanadium, and nickel
were originally of major concern. In addition, bitumen contains several
carcinogenic polycyclic aromatic hydrocarbons (WHO, 1982). Hydrotreaters remove
sulphur and nitrogen and produce elemental sulphur as a by-product. Nitrogen is
removed as ammonia and used as an under-boiler fuel or for chemical feedstock.
Hydrogen sulphide is removed from the by-product fuel gas that fuels parts of
the upgrading operations. The synthetic crude oil produced from Alberta’s
tar sand deposits is 32 - 33o API with 0.1 - 0.2 percent sulphur. It
contains no residue, while typical conventional crudes have about 8 percent
residue.
Stosur and others (1998) estimate that only 15 percent of tar
sand resources are suitable for surface mining. The rest would have to be
extracted by in situ methods, which minimise land disturbance through multiwell
pads and horizontal drilling (Sadler and Houlihan, 1998). To reduce odour and
greenhouse gas emissions, care must be taken to collect and reuse or flare the
gases generated by the process.
Alberta’s tar sand operations indicate that environmental
protection is the result of effective environmental regulation and controls,
including a balance of resource development and resource conservation and of
environmental and socioeconomic policies. |
In addition, economists argue, a distinction between
conventional and unconventional occurrences is irrelevant. Today most
unconventional occurrences are neutral stuff and will become resources and
reserves if there is sufficient demand. In fact, certain unconventional
occurrences - heavy oil, tar sands, coalbed methane and gas from aquifers - have
already started to ‘come in from the margin’. Conventional discoveries
previously regarded as uneconomic can now be developed profitably, and
recoverable reserves can be increased in fields being developed or under
production. In short, economists view oil and gas reserves as a portion of the
total hydrocarbon occurrences contained in the Earth’s crust, where volumes
depend on exploration know-how to locate and evaluate a play (delineated
deposit) and on the capability of technology to extract it at an acceptable cost
given sufficient demand.
The question of long-term hydrocarbon resource availability,
then, is viewed from the perspective of anticipated demand in competitive
markets - taking into account technological change and growing knowledge. In the
presence of sufficiently large conventional oil reserves there is, at present,
no demand for the large-scale use of abundant unconventional oil occurrences
(see above). This explains the absence of any significant motivation for a
comprehensive and systematic evaluation of these resources or for the
development of technology for their economic and environmentally acceptable
recovery.
Economists take proven conventional oil reserves of 150
gigatonnes as a point of departure that, based on their definition, can be
brought to the market at post-1986 price levels. In addition, economists point
to industry expectations that proven reserves will grow 50-70 gigatonnes by 2020
(Shell, 1996). They point out that the oil industry has historically responded
to demand by finding and developing reserves, even given the long lead time for
this process: since World War II it has taken more than 40 years to move from
identifying reserves to producing resources. This is seen as a clear indication
that the process of stock replenishment is working effectively.
A bigger role for unconventional oil. Economists also
argue that unconventional oil should be viewed as an important element of the
oil resource base - and after 2030 it will be a critical complement to
conventional oil production in keeping the oil supply curve moving upwards. This
long process of the changing supply pattern will be seamless from the viewpoint
of oil producers. From the point of view of users the process will be
unimportant, because no essential difference will arise for them merely because
of the changing nature of exploitation of oil habitats in the Earth’s
surface. In precisely the same way, today’s oil consumers do not need to
consider whether their supply is from shallow or deep horizons, or from onshore
or offshore locations.
|
The oil industry has historically
responded to demand by
finding
and developing reserves, even
given the long lead time
for this
process. |
The ultimate resource base of unconventional oil is irrelevant
to the 21st century’s energy supply. Occurrences of such oil that are
already known and under exploitation can provide the global supply likely to be
required in the 21st century. On the other hand, economic or environmental
considerations - or both - could convert unconventional resources back to
neutral stuff, as has occurred in recent decades with previously designated coal
resources.
Costs and technological developments. New technologies
for exploring and extracting oil have lowered exploration, development, and
production costs while expanding the oil resource base. Further advances in
technology must also be expected, resulting in additional reductions in cost.
Part of these productivity gains will be offset by the use of more remote,
harder-to-access, and smaller deposits. Still, it appears plausible that
technological progress will continue to keep production costs in check.2
The technology learning curve for synthetic crude oil production from tar
sands in Alberta is a good example of the impact of technology on production
costs. In 1978 a barrel of synthetic crude oil cost about $26 a barrel. By 1996
breakthroughs in the technology for producing and refining bitumen as well as
better operating procedures had lowered these costs to $9.60 a barrel (Polikar
and Cyr, 1998).
Two developments will likely put upward pressure on prices. The
first is the increasing volume of energy that will be demanded in the first half
of the 21st century. The second is the significantly increased cash flows
required by the international oil industry to sustain enhanced investment in the
initial large-scale exploitation of rapidly increasing volumes of unconventional
oil and gas. In the 1950s the ability of consumers to secure large volumes of
international oil depended on the super-normal profits that the industry was
able to generate. More recent breakthroughs for gas in Europe and elsewhere were
likewise achieved because of super-normal profitability in the industry. After
2030, following the introduction to global markets of large-scale unconventional
hydrocarbons, prices should fall back as the long-run supply prices of the two
commodities once again start to decline under conditions of advancing technology
and increasing economies of scale (Odell,
1998).
Reconciling the two views
The differences between geologists’ (static) and
economists’ (dynamic) views of oil resources can be partly explained by the
way the different schools view unconventional oil. Geologists draw a strict line
between conventional oil (the oil they look for) and unconventional oil (the oil
that does not fit their template). Although some unconventional oil is being
exploited economically, geologists take a conservative view of its long-term
commercial viability. In contrast, economists consider irrelevant the dividing
line between conventional and unconventional oil. They anticipate a seamless
transition from one to the other as long as demand and market prices allow for a
profitable return on investment. In that case, unconventional occurrences
estimated to exist in the Earth’s crust (see table 5.2) would extend the
oil age well beyond the mid-21st century. Without demand, the issue of resource
availability becomes meaningless and unconventional oil occurrences remain
neutral stuff.
A historical review of the most popular guideline for the
industry, the ratio of reserves to production, puts into perspective the two
schools of thought. This ratio compares known reserves and current production
and so measures the temporal reach of exhaustible energy reserves. These ratios
typically fluctuate between 20 and 40 years.
But the notion of a reserve-to-production ratio is seriously
flawed and, in the past, has led to aberrant conclusions (MacKenzie, 1996). The
most erroneous conclusion is that the world will be running out of reserves by
the time suggested by the ratio.3 For oil, ratios of 20 - 40 years
have existed since the early 20th century (figure 5.2). According to this ratio,
the world should have run out of oil a long time ago. Instead, driven by
economics (in essence, demand for oil), advances in geoscience, and
technological progress in upstream production, reserves have been continuously
replenished from previously unknown sources (new discoveries) or technologically
or economically inaccessible occurrences. Although reserve additions have
shifted to more difficult and potentially more costly locations, technological
progress has outbalanced potentially diminishing returns.
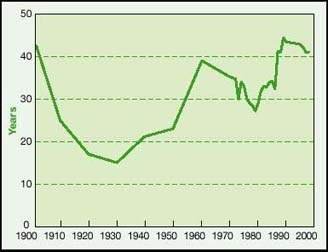
FIGURE 5.2. RATIO OF RESERVES TO
PRODUCTION FOR CONVENTIONAL CRUDE OIL, 1900 - 98
Source: Adapted from BP, 1998.
|
New technologies for exploring and
extracting oil have
lowered exploration,
development, and production
costs while expanding
the
oil resource base. |
Gas reserves and resources
Unlike oil, gas is not subject to controversy on estimates of
ultimately recoverable reserves. Proven reserves are comparable to those of oil
but high relative to current and cumulative production. Still, natural gas is
often viewed as the poor stepsister of oil. The development of natural gas
fields requires large investments in transmission and distribution
infrastructure.4 As a result gas discoveries, especially in
developing countries, are often not reported. But this does not imply a lack of
gas occurrence - in fact, over the 21st century there is enormous potential for
major gas
discoveries.
Conventional gas
The most recent estimates of conventional gas reserves come from
WEC (1998) for the end of 1996 and BP (1998) for the end of 1998. WEC gives
total reserves as 177 Tm3 (6,534 exajoules) at the end of 1996, 147
Tm3 (5,450 exajoules) of which were proven recoverable reserves
(table 5.3). The rest were additional recoverable reserves. The International
Gas Union (IGU, 2000) reports total potentially recoverable reserves as high as
502 Tm3 (18,390 exajoules).
Reserves have generally increased from survey to survey,
reflecting dramatic changes in the economics of gas exploration and recovery.
Reservoirs are being added in areas previously thought to have been exhausted,
and new reservoirs that were previously overlooked or ignored are now being
developed. Over the past 10 years reserve additions averaged 3.7 Tm3
(134 exajoules) a year, much higher than the 1997 production of 2.2
Tm3. Ivanhoe and Leckie (1993) note that fewer gas than oil fields
are reported in developing regions, probably because gas has a lower economic
and utility value, not because there are fewer gas fields.
Enhanced gas recovery using advanced recovery methods - notably
hydraulic fracturing aimed at improving the permeability of reservoir rock - can
substantially increase natural gas recovery in abandoned fields and newly
developed reservoirs. Another, more innovative technique, horizontal air
drilling, can also increase gas recovery in depleted gas zones (Elrod, 1997).
Estimates of potential reserves of natural gas resulting from
enhanced gas recovery are based on a historical average gas recovery rate of 50
percent and an enhanced recovery rate of 30 percent, for a total recovery factor
of 80 percent. Schollnberger (1998) uses similar assumptions in an assessment of
possible reserve development through 2100. Global cumulative natural gas
production through 1998 totalled 62 Tm3 (2,276 exajoules). Applying
an average recovery factor of 50 percent leads to an original amount of 124
Tm3. Enhanced gas recovery of 30 percent then enlarges reserves by 37
Tm3. Likewise, enhanced gas recovery reserves from future production
are estimated at 106 Tm3 using WEC (1998) total recoverable reserves
of 177 Tm3 (see table 5.3). Thus total potential natural gas reserves
available from enhanced oil recovery methods are estimated at 143 Tm3
(5,290 exajoules), an amount only slightly lower than proven natural gas
reserves and almost identical to the potential crude oil reserves expected from
enhanced recovery
methods.
Unconventional gas
BGR (1995) defines unconventional gas as natural gas derived
from reservoirs not exploitable by conventional recovery techniques.
Unconventional gas types include coalbed methane, tight formation gas, gas
hydrates (clathrates), and aquifer (geopressured) gas. Regional estimates of
unconventional gas occurrences in place are provided in table 5.4. The total
resource potential exceeds 25,000 Tm3 (960,000 exajoules).
Coalbed methane. Coalbed methane is a natural gas mixture
containing more than 90 percent methane. It occurs primarily in high-rank coal
seams from where it can migrate into the surrounding rock strata. Methane
contents in coal seams can range from traces to 25 cubic metres per tonne of
coal (Davidson, 1995). Regional resources of coalbed methane are genetically
associated with the geographic distribution of bituminous coal and anthracite
deposits. The former Soviet Union accounts for nearly 50 percent of recoverable
resources, centrally planned Asia (including China) has about 20 percent, and
North America has 15 percent.
Coalbed methane can be a by-product of underground coal mining
or be produced for the methane exclusively. In fact, coalbed methane is an
explosive hazard in underground mining operations and for safety reasons has
traditionally been vented with mines’ fresh air circulation. Since the
1970s methane captured from underground mining has increasingly been used to
supplement local gas supplies. Thus methane capture and use can significantly
mitigate greenhouse gas emissions because it avoids the release of methane - a
potent greenhouse gas - and may replace fossil fuels with a higher carbon
content. For long-term and stable methane supplies from coalbeds, however,
dedicated drilling in coalbeds is more important than the methane from active
underground coal mines.
Commercial coalbed methane production occurs only in the United
States, contributing about 5 percent to natural gas production (BGR, 1998). But
pilot projects are under way in a number of other countries, including
Australia, China, India, Poland, Russia, Ukraine, and the United Kingdom.
Estimates of methane resources range from 85 - 262 Tm3 (BGR, 1995,
1998; Rice, Law, and Clayton, 1993). This assessment uses the BGR (1995)
estimate of 233 Tm3 (see table 5.4).
Tight formation gas. Tight formation gas is natural gas
trapped in low-permeability reservoirs with in situ permeability of less than
0.1 millidarcy (mD), regardless of the type of the reservoir rock (Law and
Spencer, 1993). Production of tight gas requires artificial stimulation
techniques - such as massive hydraulic fracturing - to improve reservoir
permeability. An advanced technique is horizontal drilling to develop tight gas
formations, often in combination with massive hydraulic fracturing. These
stimulation methods can achieve gas flow rates two to three times those of
conventional vertical wells. In recent years about 3 percent of natural gas
production has come from tight gas reservoirs.
TABLE 5.3. ESTIMATED NATURAL GAS RESERVES
|
Region |
Proven recoverable reserves(WEC, 1998) |
Total recoverable reserves(WEC, 1998) |
Proven and additional reserves(IGU, 2000) |
Proven reserves(BP, 1999) |
Enhanced gas recovery |
|
Exajoules |
Tm3 |
Exajoules |
Tm3 |
Exajoules |
Tm3 |
Exajoules |
Tm3 |
Exajoules |
Tm3 |
|
North America |
252 |
6.8 |
389 |
10.5 |
2,307 |
63.0 |
244 |
6.6 |
884 |
23.9 |
|
Latin America and Caribbean |
303 |
8.2 |
426 |
11.5 |
1,556 |
42.5 |
298 |
8.0 |
306 |
8.3 |
|
Western Europe |
181 |
4.9 |
300 |
8.1 |
436 |
11.9 |
177 |
4.8 |
306 |
8.3 |
|
Central and Eastern Europe |
26 |
0.7 |
26 |
0.7 |
77 |
2.1 |
17 |
0.5 |
45 |
1.2 |
|
Former Soviet Union |
2,087 |
56.4 |
2,583 |
69.8 |
5,767 |
157.5 |
2,112 |
56.7 |
1,923 |
52.0 |
|
Middle East and North Africa |
2,076 |
56.1 |
2,250 |
60.8 |
5,343 |
149.5 |
2,065 |
55.4 |
1,421 |
38.4 |
|
Sub-Saharan Africa |
155 |
4.2 |
155 |
4.2 |
238 |
6.5 |
161 |
4.3 |
93 |
2.5 |
|
Pacific Asia |
207 |
5.6 |
207 |
5.6 |
798 |
21.8 |
196 |
5.3 |
158 |
4.3 |
|
South Asia |
63 |
1.7 |
63 |
1.7 |
377 |
10.3 |
54 |
1.5 |
50 |
1.4 |
|
Centrally planned Asia |
48 |
1.3 |
48 |
1.3 |
641 |
17.5 |
82 |
2.2 |
41 |
1.1 |
|
Pacific OECD |
56 |
1.5 |
89 |
2.4 |
850 |
23.2 |
47 |
1.3 |
62 |
1.7 |
|
Total |
5,450 |
147.3 |
6,534 |
176.6 |
18,390 |
502.2 |
5,454 |
146.4 |
5,290 |
143.0 |
TABLE 5.4. ESTIMATED UNCONVENTIONAL NATURAL GAS RESOURCE
POTENTIAL IN PLACE
|
Region |
Coalbed methane |
Tight formation gas |
Gas hydrates |
Geopressured gas |
Total unconventional gas |
|
|
Exajoules |
Tm3 |
Exajoules |
Tm3 |
Exajoules |
Tm3 |
Exajoules |
Tm3 |
Exajoules |
Tm3 |
|
North America |
2,898 |
78 |
518 |
14 |
80,575 |
2,178 |
109,964 |
2,972 |
193,955 |
5,242 |
|
Latin America and Caribbean |
0 |
0 |
222 |
6 |
57,331 |
1,549 |
103,341 |
2,793 |
160,894 |
4,348 |
|
Western Europe |
168 |
5 |
222 |
6 |
19,806 |
535 |
27,861 |
753 |
48,057 |
1,299 |
|
Central and Eastern Europe |
126 |
3 |
37 |
1 |
0 |
0 |
6,623 |
179 |
6,786 |
183 |
|
Former Soviet Union |
2,646 |
72 |
1,665 |
45 |
151,533 |
4,095 |
73,667 |
1,991 |
229,511 |
6,203 |
|
Middle East and North Africa |
0 |
0 |
925 |
25 |
4,788 |
129 |
67,784 |
1,832 |
73,497 |
1,986 |
|
Sub-Saharan Africa |
42 |
1 |
111 |
3 |
4,788 |
129 |
63,677 |
1,721 |
68,618 |
1,854 |
|
Pacific Asia |
210 |
6 |
148 |
4 |
0 |
0 |
45,103 |
1,219 |
45,461 |
1,229 |
|
South Asia |
42 |
1 |
37 |
1 |
4,788 |
129 |
17,427 |
471 |
22,294 |
602 |
|
Centrally planned Asia |
2,058 |
56 |
333 |
9 |
0 |
0 |
27,824 |
752 |
30,215 |
817 |
|
Pacific OECD |
420 |
11 |
37 |
1 |
23,857 |
645 |
56,166 |
1,518 |
80,480 |
2,175 |
|
Total |
8,610 |
233 |
4,255 |
114 |
347,467 |
9,391 |
599,437 |
16,201 |
959,769 |
25,940 |
Source: BGR, 1995, 1998; Rogner,
1997.
Although tight gas reservoirs exist in many regions, only the
tight gas resources in the United States have been assessed. The U.S. potential
of tight gas resources from tight sandstone and Devonian shale reservoirs is
13.4 Tm3 (BGR, 1995). BGR (1998) applies these U.S. estimates to
extrapolate tight gas resource potential for other countries and regions,
arriving at a global potential of 114 Tm3 (see table 5.4).
Gas hydrates. IGU (1997) includes some unconventional gas
in its definition of additional recoverable reserves - those that are at least
of foreseeable economic interest and that may prove technically and economically
recoverable with a reasonable level of confidence. This definition appears to
exclude gas hydrates (clathrates). IGU (1997) notes that:
Current scientific inquiries around the world are
considering gas hydrates as a potential future supply of natural gas. The
hydrates are frozen ice-like deposits that probably cover a significant portion
of the ocean floor. The extent of their coverage and the high methane content of
gas hydrates motivate speculation about the gigantic quantities of methane that
could become available. At the present time there has been no attractive
proposal for a technique to allow this methane to be recovered. Nor has there
been any scientific confirmation of the quantities of methane that might be
involved. Nevertheless, such investigations might bear fruit at some stage and
radically alter current ideas regarding natural gas availability.
The existence of gas hydrates has been confirmed by direct
evidence through sampling and by indirect evidence through geochemical and
geophysical investigations. Samples have been recovered in 14 parts of the
world; indirect evidence has been found in 30 others. Many oceanic occurrences
have been inferred based on a special geophysical exploration technique -
bottom-stimulating reflection. Resource estimates for gas hydrates are highly
uncertain. BGR (1998) reports global clathrate occurrences of more than 9,000
Tm3 (see table 5.4). Other estimates report clathrates as high as
20,000 Tm3 (MacDonald, 1990a, b; Collet, 1993).
There are no economically attractive technological proposals for
recovering methane hydrates (box 5.2). But given their enormous resource
potential, it is plausible to expect that extraction methods will eventually be
developed if long-term global gas demand warrants clathrate recovery. Research
projects are under way in India, Japan, and the United States to examine the
viability of gas hydrate recovery (Collet and Kuuskraa, 1998; BGR, 1998).
Aquifer (geopressured) gas. In many parts of the world,
natural gas is found dissolved in aquifers under normal hydrostatic pressure,
primarily in the form of methane (Marsden, 1993). This unconventional gas is
also referred to as hydropressured gas or brine gas. The amount of gas dissolved
in underground liquids increases substantially with depth. At depths up to 4,000
metres, 0.5 - 1.5 cubic metre of gas is dissolved per metre of water in
aquifers. This gas factor jumps to 7 - 20 at depths of 7,000 - 8,000 metres
(BGR, 1995).
Aquifer gas is expected to occur in nearly all sedimentary
basins (Marsden, 1993). While no detailed assessment of aquifer gas resources is
available, BGR (1998) derives potential aquifer gas in place from the
groundwater volume contained in high-permeability sand stones in the
hydrosphere. This approach leads to an estimate of 2,400 - 30,000 Tm3
of geopressured gas in place, with a mean estimate of 16,200
Tm3. In the absence of a more detailed assessment, a practical
approach had to be taken in delineating regional resource quantities. The
regional breakdown in table 5.4 was obtained by weighting the global mean
estimate of gas occurrence in place with regional shares of total sedimentary
area.
While these estimates of aquifer gas occurrences are highly
speculative, the potential quantities are staggering. Even a future recovery
factor of 5 percent implies a resource volume five times the conventional
reserves estimates of BP. Aquifer gas is already produced in small quantities
from shallow reservoirs in Italy, Japan, and the United States. But in all cases
aquifer gas recovery has been motivated by the production of trace elements
(such as iodine) rather than by the gas
itself.
Coal reserves and resources
Coal deposits can be found in sedimentary basins of various
geological ages. Mineable coal deposits require a minimum seam thickness over a
sufficiently large area. Coal production occurs in open-pit extraction or
underground mining. Coal resource estimates are generally based on drill-hole
tests and geological observations. Coal is subdivided into several broadly
defined types according to their caloric values. Generally, the types are
bituminous coal (including anthracite), sub-bituminous coal, and lignite. For
practical purposes, the subdivision is based on energy content, with the value
of 16,500 kilojoules per kilogram as demarcation between hard coal (bituminous
and high-energy sub-bituminous coals) and soft brown coal (lignite and
low-energy sub-bituminous coals).
For almost 200 years coal has provided the basis for energy
production as well as iron and steel manufacturing. It also fuelled the
industrial revolution of the 19th century. In the 20th century - mainly after
World War II - coal lost its leading position to crude oil. But the welfare and
economic development of many countries continue to be based on coal. Coal
provides about 22 percent of the world energy supply and is the most important
fuel for electricity generation. About 40 percent of global electricity is
produced in coal-fuelled power stations.
|
The differences between static and
dynamic views of oil
resources can be
partly explained by the way the
different schools
view
unconventional oil. |
Coal will likely contribute substantially to the future world
energy supply. Assuming no intervention policies targeted at preventing climate
change, projections by IEA (1998c) and Nakicenovic, Gr�bler, and McDonald (1998)
show global coal production increasing from 2.4 gigatonnes of oil equivalent
(Gtoe) in 1995 to 4.0 Gtoe by 2020. Given its enormous proven reserves, the
current rate of coal production could continue well into the future.
The size of coal resources is not a restraining factor to its
use throughout the 21st century. Rather, continued coal use will depend on the
timely development of production facilities and related infrastructure, given
lead times of up to five years for open-cast operations and drift mines.
Nevertheless, there is considerable potential for a significant increase in coal
production capacity in the short to medium term. Although environmental
considerations may limit coal use with current combustion technologies, advanced
conversion technology - with carbon abatement and disposal - may create new
market opportunities (see chapter
8).
Current resources and reserves
World coal resources in place are estimated at more than 7,400
billion tonnes of coal, or about 4,470 Gtoe (WEC 1998). The recoverable portion
is estimated at roughly 500 Gtoe, which corresponds to the amount generally
labelled reserves. About 85 percent of the resources in place are classified as
bituminous or sub-bituminous (hard) coal; the rest is lignite (soft brown) coal.
(Similar proportions apply to reserves.)
|
BOX 5.2. ARE GAS HYDRATES AN EXPLOITABLE ENERGY
RESOURCE?
A gas hydrate is a crystalline cage of water molecules that can
trap various gases. Hydrates can form under conditions of high pressure and low
temperatures. Methane hydrates exist in polar permafrost and in sediments below
the ocean floor where conditions are appropriate. Hydrates will not exist below
a depth where the reservoir temperature is too high for their stability. But
solid hydrate layers can provide top seals for reservoirs of free methane that
can accumulate beneath. Offshore methane hydrate deposits have been identified
near the coasts of many countries - including countries (such as Japan)
otherwise poor in fossil fuels.
The amount of methane associated with hydrates is highly
uncertain, but the quantities are probably far greater than conventional oil and
gas resources combined. Estimates of global methane hydrate resources range from
0.1 - 300 million exajoules (Collet and Kuuskraa, 1998; Max, Pellanbarg, and
Hurdle, 1997). How much can be practically and affordably recovered is also
highly uncertain (USDOE, 1998). An emerging view is that free gas trapped
beneath solid hydrate layers will be easier to recover than gas in hydrates
(Max, Pellanbarg, and Hurdle, 1997). Free gas recovery would depressurise the
reservoir, leading to hydrate melting at the hydrate - free gas interface and
thus to free gas replenishment. The process could continue as long as the
hydrate layer remains thick enough to cap the free gas below. Preliminary
(though dated) estimates for recovering methane at favourable sites suggest that
it might not be significantly more costly than recovering conventional natural
gas (Holder, Kamath, and Godbole, 1984). But even if this proves accurate,
getting the gas to major markets could often be quite costly because of high
transport costs, since hydrate deposits are often far from such markets. |
Three-quarters of global coal reserves are in Australia, China,
India, South Africa, and the United States. Among regions, North America has the
largest coal reserves (table 5.5). Substantial reserves are also available in
the former Soviet Union and in South Asia. The European share has to be viewed
with caution because reserves may soon be declassified to resources (neutral
stuff) as production subsidies are eliminated and industry begins to close
unprofitable operations.
In 1997 global coal production totalled 2,310 Gtoe, 91 percent
of which was hard coal. China was the largest producer of hard coal (31 percent
of the world total), followed by the United States (26 percent), India (7
percent), Australia (6 percent), and South Africa (6 percent). All other
producers hold shares of less than 5 percent.
Almost 90 percent of world coal production is used domestically.
In 1997 the 10 largest coal exporters traded about 500 million tonnes of hard
coal. The largest exporter was Australia with a traded share of about 30
percent, followed by the United States with 15 percent.
TABLE 5.5. ESTIMATED COAL RESERVES (MILLIONS OF TONNES)
|
Region |
Bituminous (incl. anthracite) |
Sub-bituminous |
Lignite |
Total (exajoules) |
|
North America |
115,600 |
103,300 |
36,200 |
6,065 |
|
Latin America and Caribbean |
8,700 |
13,900 |
200 |
533 |
|
Western Europe |
26,300 |
600 |
47,700 |
1,178 |
|
Central and Eastern Europe |
15,400 |
5,500 |
10,700 |
744 |
|
Former Soviet Union |
97,500 |
113,500 |
36,700 |
4,981 |
|
Middle East and North Africa |
200 |
20 |
0 |
6 |
|
Sub-Saharan Africa |
61,000 |
200 |
< 100 |
1,465 |
|
Pacific Asia |
900 |
1,600 |
5,100 |
10 |
|
South Asia |
72,800 |
3,000 |
2,000 |
1,611 |
|
Centrally planned Asia |
62,700 |
34,000 |
18,600 |
2,344 |
|
Pacific OECD |
48,100 |
2,000 |
41,600 |
1,729 |
|
Total |
509,200 |
277,600 |
198,900 |
20,666 |
Source: WEC, 1998.
|
Projections show
global coal production
increasing from
2.4 Gtoe
in 1995 to 4.0 Gtoe
by 2020. |
Additional resources
WEC (1998) also provides information on coal resources by type.
But because of incomplete country coverage, no regional or global aggregates are
given. BGR (1995) estimated global coal resources at 5,000 Gtoe, of which 4,600
Gtoe are hard coal. In a 1998 update, BGR revised the estimate for additional
coal resources in place to 4,300 Gtoe billion, of which about 3,500 Gtoe are
additional hard coal resources. The Russian Federation has the largest share -
about 2,100 Gtoe of hard coal. About 80 percent of the additional resources in
the Russian Federation are in remote areas of Siberia. Large investments for
infrastructure and development limit the conversion of these resources into
reserves. Because of the large reserves, there is no immediate need for
additional investigation of the resource potential world-wide. Estimates of the
regional distribution of world total resources (including reserves) are shown in
table
5.6.
Summary of fossil resources
Fossil fuel reserves, resources, and additional occurrences are
shown relative to cumulative consumption and current (1998) use in table 5.7.
For an analysis that extends well into the 21st century and explores the
long-term availability of fossil resources, the fossil resource base is the
relevant yardstick. The resource base for conventional and unconventional oil
and gas is large enough to last comfortably for another 50 - 100 years - and
possibly much longer - essentially at prices not much different from today. This
projection assumes that past hydrocarbon productivity gains in the upstream
sector can be maintained and that these resources remain in demand.
Tapping into the vast fossil resource base may eventually become
a transportation challenge. For one thing, fossil resources are not evenly
distributed around the globe. For another, the location of many unconventional
oil and, more important, gas occurrences is far from the centres of energy
demand. In China and India coal delivery costs (for rail transport) already
approach production costs. Transportation logistics and costs may affect the
economic attractiveness of remote resource sites. Long-distance and
trans-boundary energy transport raises concerns about the security of energy
supply (see chapter 4).
The fossil resource data in table 5.7 are also shown in terms of
their carbon content. Since the onset of the industrial revolution, 296
gigatonnes of carbon contained in fossil fuels have been oxidised and released
to the atmosphere. The resource base represents a carbon volume of some 6,500
gigatonnes of carbon. The 296 gigatonnes of carbon emitted to the atmosphere
already raise concerns about climate stability - and humankind has the means to
add several times that amount during the 21st century. Fossil resource scarcity
will not come to the rescue. Nakicenovic, Gr�bler, and McDonald (1998) indicate
that between 1990 and 2100 emissions under the A2 scenario (see chapter 9) of
some 1,600 gigatonnes of carbon - roughly the carbon content of conventional
fossil reserves (see table 5.7) - could raise the atmospheric concentration of
carbon dioxide to 750 parts per million by volume (ppmv). (Before the industrial
revolution, carbon dioxide concentrations were 280 ppmv; today they are 360
ppmv.) The corresponding increase in global mean temperature could be 2.0-4.5
Kelvin.5
Since 1973 the tradable price of oil (the ‘marker’ for
competing fuels) has been much higher than the marginal cost of the highest-cost
producer, reflecting geopolitics and a lack of competing fuels. Today the
highest marginal cost of production is less than $10 a barrel - and in the Gulf
it is just $2-3 a barrel (Rogner, 1997; Odell, 1998). Economic rent accounts for
the rest of the tradable price. This rent could be reduced if competing fuels -
unconventional oil, synliquids from gas or coal, renewable or nuclear energy -
could equal the marginal cost of production. Thus the true cost of oil for the
entrance of competitors is less than $10 a barrel. This cost level has already
been achieved by some producers of unconventional oil and gas - tar sands in
Alberta (Chadwick, 1998), heavy oil in Venezuela (Aalund, 1998), coalbed methane
in the United States (BGR, 1998). The question then is, can technological
advances balance the higher costs of more difficult production? Experience
suggests that the answer is probably yes in the long run. But in the Gulf,
marginal costs are unlikely to exceed $5 - $10 a barrel even in the long term.
One question of interest to many upstream investment planners
is, when will the call on unconventional fossil occurrences commence? To some
extent it is already here. Alberta’s tar sand production started more than
30 years ago and, after some difficulties in the wake of the oil price collapse
of 1986, it is now competitive in today’s markets. Venezuela’s heavy
oil has also been produced for many years. Still, the share of unconventional
oil - and, for that matter, natural gas - is only about 6 percent of world
production.
The future production profile of unconventional oil will be a
function of the demand for oil products, the price and availability of
conventional oil, and the cost and availability of oil substitutes. So what are
the prospects for future conventional oil production? The answer is by no means
conclusive. The February 1998 issue of the Explorer, the journal of the
American Association of Petroleum Geologists, writes that "it is not comforting
that experts disagree on almost every aspect of the world outlook, from annual
production to current reserves to projected energy demand...One majority opinion
emerges: Sometime in the coming century, world-wide production of petroleum
liquids will reach a peak and then begin to decline...[but] there is little
agreement about when this will happen, and how steep or gradual the decline will
be".
TABLE 5.6. ESTIMATED COAL RESOURCES (BILLIONS OF TONNES OF
COAL EQUIVALENT)
|
Region |
Hard coal |
Soft coal/ lignite |
Total (exajoules) |
|
North America |
674 |
201 |
25,638 |
|
Latin America and Caribbean |
37 |
2 |
1,143 |
|
Western Europe |
337 |
11 |
10,196 |
|
Central and Eastern Europe |
106 |
14 |
3,516 |
|
Former Soviet Union |
3,025 |
751 |
110,637 |
|
Middle East and North Africa |
1 |
1 |
58 |
|
Sub-Saharan Africa |
181 |
< 1 |
5,303 |
|
Pacific Asia |
7 |
5 |
352 |
|
South Asia |
84 |
1 |
2,491 |
|
Centrally planned Asia |
429 |
35 |
13,595 |
|
Pacific OECD |
139 |
67 |
6,030 |
|
Total |
5,021 |
1,089 |
178,959 |
Note: Includes reserves.
Source: BGR, 1998.
TABLE 5.7. AGGREGATE FOSSIL ENERGY OCCURRENCES
|
Type |
Consumption |
Reserves |
Resourcesa |
Resource baseb |
Additional occurrences |
|
1860 - 1998 |
1998 |
|
|
|
|
|
Exajoules |
Gigatonnes of carbon |
Exajoules |
Gigatonnes of carbon |
Exajoules |
Gigatonnes of carbon |
Exajoules |
Gigatonnes of carbon |
Exajoules |
Gigatonnes of carbon |
Exajoules |
Gigatonnes of carbon |
|
Oil |
|
|
|
|
|
|
|
|
|
|
|
|
|
Conventional |
4,854 |
97 |
132.7 |
2.65 |
6,004 |
120 |
6,071 |
121 |
12,074 |
241 |
|
|
|
Unconventional |
285 |
6 |
9.2 |
0.18 |
5,108 |
102 |
15,240 |
305 |
20,348 |
407 |
45,000 |
914 |
|
Natural gasc |
|
|
|
|
|
|
|
|
|
|
|
|
|
Conventional |
2,346 |
36 |
80.2 |
1.23 |
5,454 |
83 |
11,113 |
170 |
16,567 |
253 |
|
|
|
Unconventional |
33 |
1 |
4.2 |
0.06 |
9,424 |
144 |
23,814 |
364 |
33,238 |
509 |
930,000 |
14,176 |
|
Coal |
5,990 |
155 |
92.2 |
2.40 |
20,666 |
533 |
179,000 |
4,618 |
199,666 |
5,151 |
n.a. |
|
|
Total |
13,508 |
294 |
319.3 |
6.53 |
46,655 |
983 |
235,238 |
5,579 |
281,893 |
6,562 |
975,000 |
15,090 |
a. Reserves to be discovered or resources to be
developed as reserves. b. The sum of reserves and resources. c. Includes natural
gas liquids.
Source: Compiled by author from tables 5.1 -
5.6.
Assuming ultimately recoverable conventional oil resources of,
say, 400 gigatonnes and a demand development of about 1.5 percent a year,
conventional oil production will peak around 2030 (reach the depletion
mid-point) with an annual production of 4.4 gigatonnes, up from 3.5 gigatonnes
in 1998. Total oil demand, however, would run at 5.8 gigatonnes - implying that
unconventional oil will account for 1.4 gigatonnes (Odell, 1998). In other
words, unconventional sources will have to be tapped speedily during the first
decade of the 21st century. But experience with unconventional oil production
shows a long gestation period and high threshold costs of up to $30 a barrel.
Most oil price projections for 2010 (which have an extremely poor track record)
expect oil prices of $13 - $29 a barrel.
Thus accelerated expansion of unconventional oil production
(primarily tar sands in Alberta and extra heavy oil in Venezuela and Russia)
hinges on:
· Short-term
developments in oil prices.
· Actual
developments in demand.
· Technological
progress in field growth for conventional occurrences.
· Technological advances in the production of
unconventional occurrences.
· The risk
attitude of investors in unconventional production capacity.
TABLE 5.8. REASONABLY ASSURED URANIUM RESOURCES RECOVERABLE
AT LESS THAN $80 A KILOGRAM (RESERVES) AND AT $80 - 130 A KILOGRAM (TONNES OF
URANIUM)
|
Region |
< $80 a kilograma |
$80 - 130 a kilogram |
Total |
|
North America |
420,000 |
251,000 |
671,000 |
|
Latin America and Caribbean |
136,400 |
5,600 |
142,000 |
|
Western Europe |
37,300 |
53,500 |
90,800 |
|
Central and Eastern Europe |
14,000 |
25,800 |
39,800 |
|
Former Soviet Union |
564,300 |
210,200 |
774,500 |
|
Middle East and North Africa |
21,000 |
8,400 |
29,400 |
|
Sub-Saharan Africa |
453,600 |
96,000 |
549,600 |
|
Pacific Asia |
0 |
16,800 |
16,800 |
|
South Asia |
5,000 |
52,000 |
57,000 |
|
Centrally planned Asia |
49,300 |
65,300 |
114,600 |
|
Pacific OECD |
615,000 |
99,600 |
714,600 |
|
Total |
2,315,900 |
884,200 |
3,200,100 |
a. Adjusted for mining and milling losses and
production of 1997.
Source: NEA and IAEA, 1997.
|
Sometime in the coming century,
world-wide production
of
petroleum liquids will reach
a peak and then begin
to decline. |
Current market prospects for unconventional oil production
remain modest at best. But this may change drastically - for example, changing
geopolitics could raise oil prices high enough to facilitate investments in
unconventional oil. In general, most oil market outlooks project a steady
increase in OPEC’s share in global oil
production.
Reserves and resources of fissile materials
Naturally occurring fissile materials - natural uranium and
thorium - can be found in various types of geological deposits. Although they
may occur jointly, most uranium and thorium reside in separate deposits. Like
fossil occurrences, uranium and thorium are finite in the Earth’s crust,
and recoverable quantities depend on demand and market conditions, type of
deposit, and technology.
During the 1970s, when large increases in uranium demand before
the turn of the century were expected, the recovery of low-concentration uranium
from seawater was investigated. Although technically feasible, estimated
production costs appeared prohibitively high relative to alternatives. More
recent research and development indicate that the costs of recovering uranium
from seawater have fallen considerably, but are still too high given current and
expected market prices for uranium. With the declining demand for uranium,
recovery is concentrated on terrestrial deposits where uranium availability is
estimated according to different production cost categories - such as
recoverable at less than $40 a kilogram, less than $80 a kilogram, and less than
$130 a kilogram.
Due to the limited development of thorium-fuelled reactors,
little effort has been made to explore and delineate thorium. But reserves and
resources are known to exist in substantial quantities.
The resource outlook presented below is based on a
‘once-through fuel cycle’ of uranium in normal power reactors - that
is, ‘burner’ reactors. But the supply of raw material for reactor fuel
is determined not only by uranium presently mined but also by fissile material
initially produced for military purposes, which since the mid-1990s has become
available for civil use. Reprocessed uranium and plutonium are additional supply
sources with the capacity to displace up to 30 percent of the initial demand
through
recycling.
Uranium reserves
Uranium reserves are periodically estimated by the Organisation
for Economic Co-operation and Development’s Nuclear Energy Agency (NEA)
together with the International Atomic Energy Agency (IAEA), Uranium Institute
(UI), World Energy Council (WEC), and numerous national geological institutions.
Although these organisations use different reserve and resource definitions, the
differences between their estimates are usually insignificant.
Because NEA-IAEA estimates have the widest coverage, the
reserves reported in their latest survey are reported here (NEA-IAEA, 1997). The
two organisations define as reserves those deposits that could be produced
competitively in an expanding market. This category is called reasonably assured
resources and includes uranium occurrences that are recoverable at less than $80
a kilogram. (Because of declining market prospects, a number of countries have
begun to report estimates of reasonably assured uranium resources at less than
$40 a kilogram.6) Uranium reserves are estimated at 2.3 million
tonnes (table 5.8). These reserves are sufficient to meet the demand of existing
and planned nuclear power plants well into the 21st century.
The fission of 1 kilogram of natural uranium produces about 573
gigajoules of thermal energy - some 14,000 times as much as in 1 kilogram of
oil. But this is still only a small fraction of the energy potentially available
from the uranium; up to 100 times this amount can be derived in a fast neutron
reactor (a technology that is well developed but not commercially viable). In
today's plants, 22 tonnes of uranium are typically needed to produce 1
terawatt-hour of
electricity.
Uranium resources
Uranium resources are classified according to the degree of
their geological assurance and the economic feasibility of their recovery.
Resources that cost less than $80 a kilogram to recover (that is, reasonably
assured resources) are considered reserves. Under higher market price
assumptions, reasonably assured resources recoverable at less than $130 a
kilogram would also qualify as reserves. Resources beyond these categories have
been estimated, but with a lower degree of geological assurance. NEA-IAEA (1997)
define two categories of estimated additional resources, EAR-I and EAR-II.7
Another resource category, speculative resources, is also applied. While
reasonably assured resources and EAR-I include known or delineated resources,
EAR-II and speculative resources have yet to be discovered (table 5.9). Global
conventional uranium reserves and resources total about 20 million tonnes.
In addition, vast quantities of unconventional uranium resources
exist, essentially low-concentration occurrences that were of temporary interest
when medium-term demand expectations for uranium were thought to exceed known
conventional resources. Such unconventional resources include phosphate deposits
with uranium concentrations of 100 - 200 parts per million in sedimentary rocks,
and in exceptional conditions more than 1,000 parts per million in igneous
rocks. The uranium content of the world’s sedimentary phosphates is
estimated at nearly 15 million tonnes, more than half of them in Morocco. To
date the only way to extract uranium on an industrial basis, demonstrated mainly
in the United States, is through recovery from phosphoric acid. This
liquid-liquid separation process uses solvent to extract uranium, allowing for
the recovery of up to 70 percent of the uranium contained in the ore. Globally,
phosphoric acid plants have a theoretical capacity of supplying about 10,000
tonnes of uranium a year, provided economic conditions can be met.
TABLE 5.9. ESTIMATED ADDITIONAL AMOUNTS AND SPECULATIVE
RESOURCES OF URANIUM (TONNES OF URANIUM)
|
Region |
Estimated additional amounta |
Speculative resources |
|
North America |
2,559,000 |
2,040,000 |
|
Latin America and Caribbean |
277,300 |
920,000 |
|
Western Europe |
66,900 |
158,000 |
|
Central and Eastern Europe |
90,900 |
198,000 |
|
Former Soviet Union |
914,000 |
1,833,000 |
|
Middle East and North Africa |
12,000 |
40,000 |
|
Sub-Saharan Africa |
852,800 |
1,138,000 |
|
Pacific Asia |
5,000 |
0 |
|
South Asia |
46,000 |
17,000 |
|
Centrally planned Asia |
96,500 |
3,183,000 |
|
Pacific OECD |
180,000 |
2,600,00 |
|
Total |
5,100,400 |
12,127,000 |
a. Includes reasonably assured resources at
extraction costs of $130 - 260 a kilogram as well as estimated additional
resource categories I and II at less than $260 a kilogram.
Source: NEA and IAEA, 1997.
Other unconventional uranium resources that have been explored
are black shale deposits and granite rocks with elevated uranium concentrations.
Although their estimated theoretical resource potential is substantial,
exploration and extraction have been limited to experimental scales. The low
uranium content and potential environmental challenges associated with the
production of these occurrences have led to the termination of all efforts.
Another low-concentration source of uranium is the vast amount contained in
seawater - about 4.5 billion tonnes at 3 parts per billion, often seen as an
eventual ‘back-stop’ uranium resource (box 5.3).
|
BOX 5.3 URANIUM FROM SEAWATER
Seawater contains a low concentration of uranium - less than 3
parts per billion. But the quantity of contained uranium is vast - some 4.5
billion tonnes, or 700 times known terrestrial resources recoverable at less
than $130 a kilogram. It might be possible to extract uranium from seawater at
low cost. Early research in Japan suggested that it might be feasible to recover
uranium from seawater at a cost of $300 a kilogram of uranium (Nobukawa and
others, 1994). More recent work in France and Japan suggests that costs might be
as low as $80 - 100 a kilogram (Charpak and Garwin, 1998; Garwin, 1999). But
these estimates are based on methods used to recover gram quantities of uranium,
and unforeseen difficulties may arise in scaling up these methods a million-fold
or more. The implications of developing this uranium recovery technology are
discussed in chapter 8. |
Thorium reserves and resources
Thorium-fuelled burner and breeder reactors were developed in
the 1960s and 1970s but fell behind thereafter due to lower than expected market
penetration of nuclear power and to a focus on advancing uranium-fuelled nuclear
power technologies. Moreover, thorium is not readily useable in a nuclear
reactor because the number of neutrons released in each fission makes it
difficult to sustain the chain reaction. India has far more thorium than uranium
resources, and is attempting to develop the thorium fuel cycle. Important
commercial developments of reactors using thorium have not materialised
elsewhere. But high-temperature, gas-cooled reactors, like the one in South
Africa, could also use a thorium-based fuel cycle. Thorium resources are widely
available and could support a large-scale thorium fuel cycle. But given the
global availability of inexpensive uranium, thorium-fuelled reactors are
unlikely to be significant in resource terms in the next 50 years.
Monazite, a rare-earth and thorium phosphate mineral, is the
primary source of thorium. In the absence of demand for rare-earth elements,
monazite would probably not be recovered for its thorium content. Other ore
minerals with higher thorium contents, such as thorite, would be more likely
sources if demand increased significantly. But no thorium demand is expected. In
addition, world-wide demand for thorium-bearing rare-earth ores remains low.
Thorium disposal is the primary concern in obtaining mining permits for
thorium-containing ores. Reserves exist primarily in recent and ancient placer
deposits. Lesser quantities of thorium-bearing monazite reserves occur in vein
deposits and carbonatites.
TABLE 5.10. ESTIMATED THORIUM RESERVES AND ADDITIONAL
RESOURCES (TONNES OF THORIUM)
|
Region |
Reserves |
Additional resources |
|
North America |
258,000 |
402,000 |
|
Latin America and Caribbean |
608,000 |
702,000 |
|
Western Europe |
600,000 |
724,000 |
|
Central and Eastern Europe |
n.a. |
n.a. |
|
Former Soviet Union |
n.a. |
n.a. |
|
Middle East and North Africa |
15,000 |
310,000 |
|
Sub-Saharan Africa |
38,000 |
146,000 |
|
Pacific Asia |
24,000 |
26,000 |
|
South Asia |
319,000 |
4,000 |
|
Centrally planned Asia |
n.a. |
n.a. |
|
Pacific OECD |
300,000 |
40,000 |
|
Total |
2,162,000 |
2,354,000 |
n.a. Not available.
Source: BGR Data Bank.
|
Hydro energy
is not evenly accessible,
and sizeable
hydro
resources are often
remotely located. |
Thorium resources occur in provinces similar to those of
reserves. The largest share is contained in placer deposits. Resources of more
than 500,000 tonnes are contained in placer, vein, and carbonatite deposits.
Global thorium reserves and resources outside the former Soviet
Union and China are estimated at 4.5 million tonnes, of which about 2.2 million
tonnes are reserves (table 5.10). Large thorium deposits are found in Australia,
Brazil, Canada, Greenland, India, the Middle East and North Africa, South
Africa, and the United States. Disseminated deposits in other alkaline igneous
rocks contain additional resources of more than 2 million
tonnes.
Hydroelectric resources
Hydroelectricity, which depends on the natural evaporation of
water by solar energy, is by far the largest renewable resource used for
electricity generation. In 1997 hydroelectricity generation totalled 2,566
terawatt-hours (IEA, 1999). Water evaporation per unit of surface area is larger
for oceans than for land and, assisted by wind, is the principal cause of the
continuous transfer of water vapour from oceans to land through precipitation.
The maintenance of a global water balance requires that the water precipitated
on land eventually returns to the oceans as runoff through rivers.
As with all renewable resources, the amount of water runoff is
finite for a defined amount of time but, all else being equal, this finite
amount is forever available. By applying knowledge of the hydrological cycle,
the world-wide amount of runoff water can be assessed quite accurately.
Hydroelectricity is obtained by mechanical conversion of the potential energy of
water. An assessment of its energy potential requires detailed information on
the locational and geographical factors of runoff water (available head, flow
volumeper unit of time, and so on).
Because rainfall varies by region and even country, hydro energy
is not evenly accessible. Moreover, sizeable hydro resources are often remotely
located. As a result of advances in transmission technology and significant
capital spending, electricity is being delivered to places far from the
generation stations, making energy from water more affordable to more people.
Projects considering the connection of electric grids between countries,
regions, and even continents have been implemented or are planned (Moreira and
Poole, 1993).
Although hydroelectricity is generally considered a clean energy
source, it is not totally devoid of greenhouse gas emissions, ecosystem burdens,
or adverse socioeconomic impacts (see chapter 3). For comparable electricity
outputs, greenhouse gas emissions associated with hydropower are one or two
orders of magnitude lower than those from fossil-generated electricity.
Ecosystem impacts usually occur downstream and range from changes in fish
biodiversity and in the sediment load of the river to coastal erosion and
pollution (McCulley, 1996). Potentially adverse socio-economic aspects of
hydroelectricity include its capital intensity and social and environmental
impacts (McCulley, 1996). Capital-intensive projects with long construction and
amortisation periods become less attractive in privatising markets. Higher
education levels and increasing population densities along river beds
substantially raise the socioeconomic costs of relocation. Local environmental
issues require more thorough management than before because modern
communications and determined citizen groups can easily turn a remote or local
problem into a global issue that can influence international capital and
financing markets. Large hydropower projects increasingly encounter public
resistance and, as a result, face higher costs.
Integration aspects may increase the competitiveness of
hydroelectricity because of its quick response to fluctuations in demand. When
hydropower provides spinning reserve and peak supply, this ability allows
thermal electric plants to operate closer to their optimal efficiency, lowering
fuel costs and reducing emissions from burning fossil fuels. Pump storage might
absorb off-peak power or power from intermittent supplies for peak use at a
later
point.
Theoretical potential
The world’s annual water balance is shown in table 5.11. Of
the 577,000 cubic kilometres of water evaporating from ocean and land surfaces,
119,000 cubic kilometres precipitate on land. About two-thirds is absorbed in
about equal parts by vegetation and soil; the remaining third becomes runoff
water. Most of the fraction absorbed by vegetation and soil evaporates again and
amounts to 72,000 cubic kilometres. The difference of 47,000 cubic kilometres
is, in principle, available for energy purposes.
The amount of inland precipitation varies slightly by continent,
from 740 - 800 millimetres a year. The two exceptions are South America (1,600
millimetres a year) and Antarctica (165 millimetres). Thus runoff water per unit
of land area in South America is at least two times that elsewhere.
Convolution of runoff water volumes with average altitudes
allows for the evaluation of theoretical hydropower potential by region (table
5.12). Asia (including Pacific Asia, South Asia, and centrally planned Asia) has
the largest potential, because its average altitude of 950 metres is the highest
of all continents (except Antarctica, which has an average altitude of 2,040
metres). But average altitudes are insufficient for calculating theoretical
hydropower potential - runoff is not evenly distributed across a continent. In
addition, seasonal variations in runoff influence theoretical potentials.
Estimates of the global theoretical hydroelectricity potential range from 36,000
- 44,000 terawatt-hours a year (Raabe, 1985; Boiteux, 1989; Bloss and others,
1980; World Atlas and Industry Guide, 1998).
The global water balance and regional precipitation patterns may
change as a result of climate change. Current models suggest that global
precipitation will increase but that regional precipitation patterns will shift.
These changes will affect global hydropower
potential.
Technical potential
Appraisals of technical potential are based on simplified
engineering criteria with few, if any, environmental considerations. Although
the technical potential should exclude economic aspects, these appear to be
inherent in such appraisals. Evaluation criteria may differ substantially by
country and, especially in developing countries, may be quite unsophisticated.
Reported technical potentials could be inflated or, because of incomplete
assessments, seriously underestimated (Bloss and others, 1980; International
Water Power and Dam Construction, 1989; World Atlas and Industry Guide,
1998).
TABLE 5.11. ANNUAL WORLD WATER BALANCE
|
Region |
Surface area 106 km2 |
Precipitation |
Evaporation |
Runoffa |
|
|
Millimetres |
Thousands of cubic kilometres |
Millimetres |
Thousands of cubic kilometres |
Millimetres |
Thousands of cubic kilometres |
|
Europe |
10.5 |
790 |
8.3 |
507 |
5.3 |
283 |
3.0 |
|
Asia |
43.5 |
740 |
32.2 |
416 |
18.1 |
324 |
14.1 |
|
Africa |
30.1 |
740 |
22.3 |
587 |
17.7 |
153 |
4.6 |
|
North America |
24.2 |
756 |
18.3 |
418 |
10.1 |
339 |
8.2 |
|
South America |
17.8 |
1,600 |
28.4 |
910 |
16.2 |
685 |
12.2 |
|
Australia and Oceania |
8.9 |
791 |
7.1 |
511 |
4.6 |
280 |
2.5 |
|
Antarctica |
14.0 |
165 |
2.3 |
0 |
0.0 |
165 |
2.3 |
|
Total/average) |
149 |
800 |
119 |
485 |
72 |
315 |
47.0 |
|
Pacific Ocean |
178.7 |
1,460 |
260.0 |
1,510 |
269.7 |
-83 |
-14.8 |
|
Atlantic Ocean |
91.7 |
1,010 |
92.7 |
1,360 |
124.4 |
-226 |
-20.8 |
|
Indian Ocean |
76.2 |
1,320 |
100.4 |
1,420 |
108.0 |
-81 |
-6.1 |
|
Arctic Ocean |
14.7 |
361 |
5.3 |
220 |
8.2 |
-355 |
-5.2 |
|
Total/average |
361 |
1,270 |
458 |
1,400 |
505 |
-130 |
-47.0 |
|
Globe |
510 |
1,130 |
577 |
1,130 |
577 |
0 |
0 |
a. Outflow of water from continents into oceans.
Source: UNESC, 1997.
Most significant are the differences in theoretical, technical,
and economic potential by region, especially for Africa, North America, and the
former Soviet Union (figure 5.3).8 In general, total technical
potential has not been fully measured for most developing countries. In Brazil,
for example, hydroelectricity is responsible for 96 percent of electricity
generation. Of the 260 gigawatts of technical hydropower potential, more than
one-third is accounted as estimated. Of that, 32 gigawatts have never been
individually analysed (ANEEL, 1999).
Technological advances tend to increase the technical potential
and so broaden the prospects for hydropower meeting future electricity
requirements. Improvements in the efficiency and utility of turbines for
low-head and small hydro sites permit more effective use of a larger number of
sites in a less environmentally intrusive manner. Advances in adjustable-speed
generation and new large turbines enable the rehabilitation and expansion of
existing capacities (Churchill, 1997). Refurbishment of plants has shown that
advanced technologies can significantly increase the energy output at
essentially unchanged primary water flows (International Water Power
and Dam Construction, 1989; Taylor, 1989). In addition, technological
improvements enable the use of previously uneconomical potentials and new sites.
|
Large hydropower
projects increasingly
encounter public
resistance
and, as a result, face
higher costs. |
But hydroelectric generation is a mature technology for which
most components are nearing their practically achievable maximum. As a result
further improvements in performance are expected to be modest. Average
efficiencies of existing plants are about 85 percent; a 10 percentage point
increase would be a major
accomplishment.
Economic potential
The economic potential of hydropower is based on detailed
economic, social, environmental, geological, and technical evaluations.9
It is by far the most difficult potential to establish because the
financial, environmental, and social parameters that determine it are driven by
societal preferences that are inherently difficult to project.
One approach is to use the historically observed fraction of the
technical potential used in industrialised countries with extensive hydropower
developments. Western Europe has developed 65 percent of its technical
hydropower potential, and the United States has developed 76 percent (World
Atlas and Industry Guide, 1998). A utilisation rate of 40 - 60 percent of a
region’s technical potential is a reasonable assumption and leads to a
global economic hydroelectricity potential of 6,000 - 9,000 terawatt-hours a
year. More detailed analysis based on current technological and economic puts
the global economic potential at 8,100 terawatt-hours a year (see table 5.12).
TABLE 5.12. THEORETICAL, TECHNICAL, AND ECONOMIC
HYDROELECTRIC POTENTIALS, INSTALLED CAPACITIES, AND CAPACITIES UNDER
CONSTRUCTION, 1997 (TERAWATT-HOURS UNLESS OTHERWISE INDICATED)
|
Region |
Gross theoretical potential |
Technical potential |
Economic potential |
Installed hydro capacity (gigawatts) |
Hydropower production |
Hydro capacity under construction (megawatts) |
|
North America |
5,817 |
1,509 |
912 |
141 |
697 |
882 |
|
Latin America and Caribbean |
7,533 |
2,868 |
1,199 |
114 |
519 |
18,331 |
|
Western Europe |
3,294 |
1,822 |
809 |
16 |
48 |
2,464 |
|
Central and Eastern Europe |
195 |
216 |
128 |
9 |
27 |
7,749 |
|
Former Soviet Union |
3,258 |
1,235 |
770 |
147 |
498 |
6,707 |
|
Middle East and North Africa |
304 |
171 |
128 |
21 |
66 |
1,211 |
|
Sub-Saharan Africa |
3,583 |
1,992 |
1,288 |
66 |
225 |
16,613 |
|
Pacific Asiaa |
5,520 |
814 |
142 |
14 |
41 |
4,688 |
|
South Asiaa |
3,635 |
948 |
103 |
28 |
105 |
13,003 |
|
Centrally planned Asia |
6,511 |
2,159 |
1,302 |
64 |
226 |
51,672 |
|
Pacific OECD |
1,134 |
211 |
184 |
34 |
129 |
841 |
|
Total |
40,784 |
13,945 |
6,964 |
655 |
2,582 |
124,161 |
|
Totalb |
40,500 |
14,320 |
8,100 |
660 |
2,600 |
126,000 |
a. Several countries in Pacific Asia and South Asia
do not publicise their economic potential. As a result the reported economic
potentials for the regions are too low - and in South Asia the economic
potential is even lower than the electricity generated. b. These are the values
listed in the source. They differ from the total in the previous row due to
typographical errors and due to the inclusion of estimations for countries for
which data are not available.
Source: World Atlas and Industry Guide,
1998.
FIGURE 5.3 GLOBAL THEORETICAL,
TECHNICAL, AND ECONOMIC HYDROELECTRIC POTENTIALS (TERAWATT-HOURS A YEAR)
Source: World Atlas and Industry Guide,
1998.
Major constraints to hydroelectricity expansion
Physical constraints. Global water runoff is 47,000 cubic
kilometres a year, 28,000 cubic kilometres of which is surface runoff and 13,000
of which is stable underground flow into rivers (L’vovich, 1987). Only
about three-quarters of the stable underground flow (9,000 cubic kilometres) is
easily accessible and economically usable (WRI, 1998). In addition, 3,000 cubic
kilometres of useful capacity is available in form of human-made lakes and
reservoirs (L’vovich, 1987). Global anthropogenic water withdrawals are
about 27 percent of total availability, or 3,250 cubic kilometres a year.
Agriculture accounts for 65 percent of the diverted water, industries for 24
percent, and households and other municipal users for 7 percent, while 4 percent
is evaporated from reservoirs (Shiklomanov, 1993).
Water use in agriculture totals 2,300 cubic kilometres a year
and is expected to increase with growing food demand. The United Nations
projects a 50 - 100 percent increase in irrigation water by 2025 (Raskin and
others, 1997). Most of the projected increase in water demand will occur in
developing countries because of rapid growth in population, industry, and
agriculture. Water pollution adds enormously to local and regional water
scarcity by eliminating large volumes from the available supply. Many developing
countries undergoing rapid industrialisation face the full range of modern toxic
pollution problems - eutrophication, heavy metals, acidification, and persistent
organic pollutants (WHO, 1997).
Globally, water supplies are abundant. But they are unevenly
distributed among and within countries. In some areas water withdrawal has
reached such dimensions that surface water supplies are shrinking and
groundwater reserves are being depleted faster than they can be replenished by
precipitation (WHO, 1997). One-third of the world’s people live in
countries experiencing moderate to high water stress, and that share could rise
to two-thirds by 2025 (WRI, 1998). Since 1940 the amount of freshwater used by
humans has roughly quadrupled as the world population has doubled (Population
Action International, 1997). Another doubling of the world population by 2100
cannot be ruled out. Assuming an upper limit of usable renewable freshwater of
9,000 - 14,000 cubic kilometres a year, a second quadrupling of world water use
appears highly improbable.
In connection with the physical constraints to the use of water
for power generation listed above, it should be noted that electricity
generation - unlike, say, irrigation and domestic and industrial uses - is a
non-consumptive use of water. Under otherwise favourable conditions, such as
irrigation at low altitudes, water can be used first to generate power and then
for other purposes.
A physical factor needed to develop hydropower economically is
the availability of a suitable head. This limitation does not apply to other
water uses. This factor is critical in many water-rich but low-lying regions.
Environmental and social constraints. More than 400,000
cubic kilometres of land have been inundated by the construction of dams
(Shiklomanov, 1993). These dams generate 2,600 terawatt-hours a year of
electricity. Assuming that all flooded areas are used for hydroelectricity, the
energy density is 62 megawatt-hours a hectare per year. But hydroelectric plants
vary widely in this respect. Goodland (1996) reports on installed capacity,
flooded land, and relocated persons for 34 hydroelectric plants, mostly in
developing countries. These plants have an average energy density of 135
megawatt-hours a hectare per year. The most land-intensive of them yields 3.5
megawatt-hours a year per hectare of flooded land, but the least land-intensive
yields 1.48 million megawatt-hours a year per hectare.
Eleven of the thirty-four plants yield more than 1,800
megawatt-hours a hectare per year (0.205 kilowatt-years per year), the standard
for a fixed array photovoltaic plant in sunny areas (see below). Biomass from
forests (15 oven dry tonnes a hectare per year) and from crop plantation (10,000
litres of ethanol a hectare per year using sugarcane) have energy densities of
about 20 megawatt-hours a hectare per year. Thus hydroelectricity is
land-intensive - more so than photovoltaics but less so than biomass
plantations.
Hydroelectricity has sparked controversy when large dams with
energy densities as low as 0.2 megawatt-hours a hectare per year require
large-scale flooding and displace people. Some large dams involve the
resettlement of more than 100,000 people (Goodland, 1997). Mandatory
resettlement and the boom and bust effects of dam construction on local
economies have become contentious social and environmental issues. In the past,
resettlement was the responsibility of governments and public utilities involved
in the project. Despite enormous financial expenditures and compensation
packages, resettlement efforts have had modest success. If private utilities are
to finance hydro projects, they will have to take responsibility for dealing
with resettlement issues.
|
Biomass-derived fuels can substitute
for fossil fuels in
existing energy
supply infrastructure without
contributing to the build-up
of
greenhouse gases. |
National and international cooperation on the development of
environmental best practices (such as through working groups on hydropower and
the environment in partnership with nongovernmental organisations) may foster
public acceptance of hydropower projects. For example, the World Commission on
Dams, an independent international commission established in 1998, is reviewing
the development effectiveness of large dams and developing internationally
acceptable criteria for future decision-making on
dams.
Biomass resources
The world derives about 11 percent of its energy from biomass
(IEA, 1998b). In developing countries biomass is the most important energy
source, accounting for about 35 percent of the total (WEC, 1994). (In the
largest developing countries, China and India, biomass accounts for 19 percent
and 42 percent of the primary energy supply mix.) But in the world's poorest
countries, biomass accounts for up to 90 percent of the energy supply, mostly in
traditional or noncommercial forms.10 This explains why biomass is
often perceived as a fuel of the past - one that will be left behind as
countries industrialise and their technological base develops.
But biomass resources are abundant in most parts of the world,
and various commercially available conversion technologies could transform
current traditional and low-tech uses of biomass to modern energy. If dedicated
energy crops and advanced conversion technologies are introduced extensively
(see chapter 7), biomass could make a substantial contribution to the global
energy mix by 2100. Although most biomass is used in traditional ways (as fuel
for households and small industries) and not necessarily in a sustainable
manner, modern industrial-scale biomass applications have increasingly become
commercially available. In 1996 estimates of biomass consumption ranged from 33
- 55 exajoules (WEC, 1998; IEA, 1998a; Hall,
1997).
Sources
Biomass can be classified as plant biomass (woody, non-woody,
processed waste, or processed fuel; table 5.13) or animal biomass. Most woody
biomass is supplied by forestry plantations, natural forests, and natural
woodlands. Non-woody biomass and processed waste are products or by-products of
agroindustrial activities. Animal manure can be used as cooking fuel or as
feedstock for biogas generation. Municipal solid waste is also considered a
biomass resource.
The annual global primary production of biomatter totals 220
billion oven dry tonnes, or 4,500 exajoules. The theoretically harvestable
bioenergy potential is estimated to be 2,900 exajoules, of which 270 exajoules
could be considered technically available on a sustainable basis (Hall and
Rosillo-Calle, 1998). Hall and Rao (1994) conclude that the biomass challenge is
not availability but sustainable management, conversion, and delivery to the
market in the form of modern and affordable energy services. Biomass resources
can be converted to chemical fuels or electricity through several routes (see
chapter 7).
Two major studies have recently acknowledged the benefits of
sustainably produced biomass energy in future energy scenarios. The first is by
Shell International Petroleum Company (Shell, 1996), which assessed potential
major new sources of energy after 2020, when renewable energies are expected to
become competitive with fossil fuels. The Intergovernmental Panel on Climate
Change (IPCC, 1996a) has considered a range of options for mitigating climate
change, and increased use of biomass for energy features in all its scenarios.
The expected role of biomass in the future energy supply of
industrialised countries is based on two main considerations:
· The development of
competitive biomass production, collection, and conversion systems to create
biomass-derived fuels that can substitute for fossil fuels in existing energy
supply infrastructure without contributing to the build-up of greenhouse gases
in the atmosphere. Intermittent renewables, such as wind and solar energy, are
more challenging to fit into existing distribution and consumption schemes.
· The potential resource base is
generally considered substantial given the existence of land not needed or
unsuitable for food production, as well as agricultural food yields that
continue to rise faster than population growth.
In developing countries an assessment of potential bioenergy
development must first address issues ranging from land-use conflicts with food
production to health and environmental
problems.
Perceptions and problems
Biomass is often perceived as a fuel of the past because of its
low efficiency, high pollution, and associations with poverty.
· Biomass is the
fuel most closely associated with energy-related health problems in developing
countries. Exposure to particulates from biomass or coal burning causes
respiratory infections in children, and carbon monoxide is implicated in
problems in pregnancy (see chapter 3).
· Biomass fuels are bulky and
may have a high water content. Fuel quality may be unpredictable, and physical
handling of the material can be challenging. But technologies for biomass fuel
upgrading (into pellets or briquettes, for example) are advancing, and the
development of dedicated energy crops will also improve fuel standardisation.
· For biomass to become a major
fuel, energy crops and plantations will have to become a significant land-use
category. Land requirements will depend on energy crop yields, water
availability, and the efficiency of biomass conversion to usable fuels. Assuming
a 45 percent conversion efficiency to electricity and yields of 15 ovendry
tonnes a hectare per year, 2 square kilometres of plantation would be needed per
megawatt of electricity of installed capacity running 4,000 hours a year.
· The energy balance is not
always favourable. While woody biomass energy output is 10 - 30 times greater
than the energy input, the issue is less clear for liquid fuels derived from
biomass (Shapouri, Duffield, and Graboski, 1995). Nevertheless, the use of
sugarcane as a source of ethanol yields a very positive balance and is
responsible for a net abatement of 9 million tonnes of carbon a year in Brazil
(Moreira and Goldemberg, 1999). With the promising development of enzymatic
hydrolysis, cellulose can be transformed into ethanol with a very favourable
energy balance (PCAST, 1997).
· Large-scale production of
biomass can have considerable negative impacts on soil fertility, water and
agrochemical use, leaching of nutrients, and biodiversity and landscape. The
collection and transport of biomass will increase vehicle and infrastructure use
and air-borne
emissions.
Technical potential of biomass energy plantations
To estimate future technical biomass potentials, it is necessary
to know:
· The amount of land
available for biomass plantation.
· The
regional distribution of this land and distances to consumption
centres.
· The productivity of the land for
biomass production, including water availability.
· The environmental implications of biomass
production.
· The technical and economic
performance of conversion technologies and net energy balance.
TABLE 5.13. TYPES AND EXAMPLES OF PLANT BIOMASS
|
Woody biomass |
Non-woody biomass |
Processed waste |
Processed fuels |
|
· Trees
· Shrubs and scrub
·
Bushes such as coffee and tea
· Sweepings
from forest floor
· Bamboo
· Palms |
· Energy crops such as
sugarcane
· Cereal straw
· Cotton, cassava, tobacco stems and roots (partly
woody)
· Grass
· Bananas, plantains, and the like
· Soft stems such as pulses and potatoes
· Swamp and water plants |
· Cereal husks and
cobs
· Bagasse
· Wastes from pineapple and other fruits
· Nut shells, flesh, and the like
· Plant oil cake
·
Sawmill wastes
· Industrial wood bark and
logging wastes
· Black liquor from pulp
mills
· Municipal waste |
· Charcoal (wood and residues)
· Briquette/densified biomass
· Methanol/ethanol (wood alcohol)
· Plant oils from palm, rape, sunflower, and the
like
· Producer gas
· Biogas |
Source: Adapted from IEA, 1998a.
TABLE 5.14. CURRENT GLOBAL LAND-USE PATTERN
|
Cropland (arableland and permanent crops) |
Forests and woodland |
Permanent pastures |
Other land |
|
|
|
Total other land |
Land with rainfed cultivation potential |
|
Gha |
% of total |
Gha |
% of total |
Gha |
% of total |
Gha |
% of total |
Gha |
|
1.5 |
11 |
4.2 |
21 |
3.4 |
26 |
4.0 |
31 |
1.6 - 1.8 |
Note: Gha stands for billions of hectares. Total
land availability is 13.1 billion hectares.
Source: FAO, 1993, 1999; Fischer and Heilig, 1998; WRI,
1998.
TABLE 5.15. PROJECTED BIOMASS ENERGY POTENTIAL, 2050
(BILLIONS OF HECTARES UNLESS OTHERWISE INDICATED)
|
1 |
2 |
3 |
4 |
5 |
6a |
7b |
7c |
|
Region |
Population in 2050 (billions) |
Land with crop production potential in 1990 |
Cultivated land in 1990 |
Additional cultivated land required in 2050 |
Maximum additional area for biomass production |
Maximum additional amount of energy from biomass
(exajoules) |
|
Industrialised countriesd |
- |
- |
0.670 |
0.050 |
0.100 |
17 |
30 |
|
Latin America |
|
|
|
|
|
|
|
|
Central and Caribbean |
0.286 |
0.087 |
0.037 |
0.015 |
0.035 |
6 |
11 |
|
South America |
0.524 |
0.865 |
0.153 |
0.082 |
0.630 |
107 |
189 |
|
Africa |
|
|
|
|
|
|
|
|
East |
0.698 |
0.251 |
0.063 |
0.068 |
0.120 |
20 |
36 |
|
Central |
0.284 |
0.383 |
0.043 |
0.052 |
0.288 |
49 |
86 |
|
North |
0.317 |
0.104 |
0.040 |
0.014 |
0.050 |
9 |
15 |
|
Southern |
0.106 |
0.044 |
0.016 |
0.012 |
0.016 |
3 |
5 |
|
West |
0.639 |
0.196 |
0.090 |
0.096 |
0.010 |
2 |
3 |
|
Asia (excl. China) |
|
|
|
|
|
|
|
|
Western |
0.387 |
0.042 |
0.037 |
0.010 |
-0.005 |
0 |
0 |
|
South-central |
2.521 |
0.200 |
0.205 |
0.021 |
-0.026 |
0 |
0 |
|
East |
1.722 |
0.175 |
0.131 |
0.008 |
0.036 |
6 |
11 |
|
South-east |
0.812 |
0.148 |
0.082 |
0.038 |
0.028 |
5 |
8 |
|
China |
- |
- |
- |
- |
- |
2e |
2e |
|
Totalf |
8.296 |
2.495 |
0.897 |
0.416 |
1.28 |
226 |
396 |
|
Global biomass energy potential |
276g |
446g |
a. (6) = (3) - (4) - (5). b. (7) = (6) x 8.5 [oven
dry tonnes a hectare per year] x 20 [GJ per oven dry tonne] based on higher
heating value (18 GJ per oven dry tonne for lower heating value). The
assumptions for biomass productivity may appear on the high side, but they
represent technically achievable yields given dedicated research, development,
and dissemination. c. (7) = (6) ×15 [oven dry tonnes a hectare per year]
×20 [GJ per oven dry tonne] based on higher heating value (18 GJ per oven
dry tonne for lower heating value). d. OECD, Central and Eastern Europe, newly
independent states of the former Soviet Union. e. Data are projected values from
d’Apote (1998), not maximum estimates. f. Totals in (2), (3), (4), and (5)
exclude industrialised countries. g. Includes 50 EJ of current biomass energy
generation.
Source: Derived from Fischer and Heilig, 1998; d’Apote,
1998; Nakicenovic, Gr�bler, and McDonald, 1998.
Current land-use patterns are shown in table 5.14. Land use is
split into cropland, forests and woodland, permanent pastures, and other land.
‘Other land’ includes uncultivated land, grassland not used for
pasture, built-on areas, wastelands, wetlands, roads, barren land, and protected
forests. Less than a half of this land (1.6 - 1.8 billion hectares) can be used
for rainfed cultivation, including biomass production (FAO, 1993; Fischer and
Heilig, 1998).
Because energy plantations will likely account for 80 - 100
percent of biomass supply, large-scale use of biomass may compete with land for
agriculture and food production. But biomass production for energy purposes
should not infringe on food production. By 2100 an additional 1,700 million
hectares of land are expected to be needed for agriculture, while 690 - 1,350
million hectares of additional land would be needed to support biomass energy
requirements under a high-growth biomass energy scenario. Hence land-use
conflicts could arise.
Land availability. Considerable areas are potentially
available for large-scale production of biomass. In tropical countries large
areas of deforested and degraded lands could benefit from the establishment of
bioenergy plantations. While the theoretical potential of biomass production is
one order of magnitude larger than current global energy use, the technical and
economic potentials are much smaller. Technical and economic potentials will be
determined by numerous factors ranging from current uses of degraded land (which
in developing countries is often used by the poor to graze livestock) and land
productivity to the economic reach of the land with respect to centres of energy
demand.
The United Nations Food and Agriculture Organization’s
"World Agriculture towards 2010 study (Alexandratos, 1995) assesses potential
cropland resources in more than 90 developing countries. In 2025 developing
countries will be using only 40 percent of their potential cropland, but with
large regional variations. Asia (excluding China, for which data were
unavailable) will have a deficit of 47 million hectares, but yields of most food
crops are low, and there is great potential for improvement using better genetic
strains and management techniques. Modern agricultural technologies have not
reached many rural farmers and could boost yields by as much as 50 percent.
Whether future productivity gains can avoid a food deficit remains to be seen.
Africa currently only uses 20 percent of its potential cropland and would still
have 75 percent remaining in 2025. Latin America, currently using only 15
percent of its potential cropland, would have 77 percent left in 2025 - land
capable of producing nearly eight times its present energy consumption.
Large areas of surplus agricultural land in North America and
Europe could become significant biomass production areas. U.S. farmers are paid
not to farm about 10 percent of their land, and in the European Union 15 percent
of arable farmland can be set aside (amounting to 15 - 20 million hectares by
2010, and possibly more than 50 million hectares later in the 21st century). In
addition to more than 30 million hectares of cropland already set aside in the
United States to reduce production or conserve land, another 43 million hectares
of cropland have high erosion rates. Another 43 million hectares have wetness
problems that could be eased with a shift to perennial energy crops. The U.S.
Department of Agriculture estimates that a further 60 million hectares may be
idled over the next 25 years.
A projection of these parameters for 2050 is shown in table
5.15. The theoretical and technical potential for biomass energy is about ten
times current use (445 exajoules relative to 45 exajoules) and close to current
global primary energy use of 402 exajoules a year. But the extent to which this
potential can be achieved will depend on numerous factors. These include the
share of land allocated to other uses (for example, plantations for timber and
pulp), actually achievable specific biomass productivity, technologies for
converting biomass to convenient energy services, transport distances, water
availability, biodiversity, and the need for fertilisers.
Water resources. The supply of freshwater may become a
limiting factor for both food and bioenergy production. Several studies have
addressed water issues related to agriculture (FAO, 1999; Fischer and Heilig,
1998; WRI, 1998; Seckler and others, 1998, Falkenmark, 1997). But water
availability for biomass production has not been addressed in great detail. The
common view is that "the food needs of the world’s rapidly growing
population will introduce severe problems, either because the rate of growth
will be too rapid for the additional water mobilisation to be met, or because
the overall water demands will grow unrealistically high so that they cannot be
met" (Falkenmark, 1997, p. 74).
Current and projected water resources, by region, are shown in
table 5.16. Two levels of water requirements can be used to estimate water
sufficiency. The lowest level of sufficiency is generally considered to be 1,000
cubic metres per capita a year, while the availability of more than 2,000 cubic
metres per capita a year makes for a small probability of water shortages
(Seckler and others, 1998, Falkenmark, 1997). In addition, a recent study
commissioned by the United Nations Commission on Sustainable Development (Raskin
and others, 1997) puts the upper limit of sustainable water consumption at 40
percent of available resources.
Even without considering water requirements for biomass
production, water shortages (supply below 2,000 cubic metres per capita a year)
are possible for about half the world’s population as early as 2025. Thus
the water constraint for extended biomass production will likely be of
importance, especially in the long term (see also the section on physical
constraints to hydroelectricity expansion, above).
TABLE 5.16. SUFFICIENCY OF WATER RESOURCES, 1990 AND
2025
|
Region |
Population in 1990 (millions) |
Water resources per capita in 1990 (cubic metres) |
Water resources per capita in 2025 (cubic metres) |
Supply in 2025 as percentage of available water
resources |
|
North America |
278 |
19,370 |
36,200 |
6,065 |
|
Latin America and Caribbean |
433 |
30,920 |
200 |
533 |
|
Western Europe |
459 |
10,604 |
47,700 |
1,178 |
|
Central and Eastern Europe |
277 |
1,902 |
10,700 |
744 |
|
Former Soviet Union |
428 |
4,561 |
36,700 |
4,981 |
|
Middle East and North Africa |
n.a. |
n.a. |
0 |
6 |
|
Sub-Saharan Africa |
n.a. |
n.a. |
< 100 |
1,465 |
|
Pacific Asia |
405 |
11,463 |
5,100 |
10 |
|
South Asia |
1,133 |
4,537 |
2,000 |
1,611 |
|
Centrally planned Asia |
1,252 |
2,987 |
18,600 |
2,344 |
|
Pacific OECD |
144 |
8,463 |
41,600 |
1,729 |
|
Total |
4,809 |
8,497 |
198,900 |
20,666 |
n.a. Not available.
Source: Seckler and others, 1998.
TABLE 5.17. CURRENT AND FEASIBLE BIOMASS PRODUCTIVITY,
ENERGY RATIOS, AND ENERGY YIELDS FOR VARIOUS CROPS AND CONDITIONS
|
Crop and conditions |
Yield (dry tonnes a hectare per year) |
Energy ratio |
Net energy yield (gigajoules a hectare per year) |
|
Short rotation crops(willow, hybrid poplar; United States,
Europe) |
|
|
|
|
· Short term |
10-12 |
10:1 |
180-200 |
|
· Longer term |
12-15 |
20:1 |
220-260 |
|
Tropical plantations(such as eucalyptus) |
|
|
|
|
· No genetic improvement,
fertiliser use, and irrigation |
2-10 |
10:1 |
30-180 |
|
· Genetic improvement and
fertiliser use |
6-30 |
20:1 |
100-550 |
|
· Genetic improvement,
fertiliser and water added |
20-30 |
|
340-550 |
|
Miscanthus/switchgrass |
|
|
|
|
· Short term |
10-12 |
12:1 |
180-200 |
|
· Longer term |
12-15 |
20:1 |
220-260 |
|
Sugarcane (Brazil, Zambia) |
15-20 |
18:1a |
400-500 |
|
Wood (commercial forestry) |
1- 4 |
20/30:1 |
30- 80 |
|
Sugar beet(northwest Europe) |
|
|
|
|
· Short term |
10-16 |
10:1 |
30-100 |
|
· Longer term |
16-21 |
20:1 |
140-200 |
|
Rapeseed (including straw yields; northwest Europe) |
|
|
|
|
· Short term |
4- 7 |
4:1 |
50- 90 |
|
· Longer term |
7-10 |
10:1 |
100-170 |
a. The value in Moreira and Goldemberg (1999) -
7.9:1 - includes spending on transportation and processing of sugarcane to the
final product ethanol.
Source: Biewinga and. van der Bijl, 1996; Hall and Scrase,
1998; IEA, 1994; Kaltschmitt, Reinhardt, and Stelzer, 1996; de Jager, Faaij, and
Troelstra, 1998; IPCC, 1996a; Ravindranath and Hall,
1996.
Energy balances and biomass productivity
The energy production per hectare of various crops depends on
climatic, soil, and management conditions. Examples of net energy yields -
output minus energy inputs for agricultural operations, fertiliser, harvest, and
the like - are given in table 5.17. Generally, perennial crops (woody biomass
such as willow, eucalyptus, hybrid poplar, miscanthus or switchgrass grasses,
sugarcane) perform better than annual crops (which are planted and harvested
each year; examples include sorghum and hemp). This is because perennial crops
have lower inputs and thus lower production costs as well as lower ecological
impacts. Different management situations - irrigation, fertiliser application,
genetic plant improvements, or some combination of the three - can also increase
biomass productivity, by a factor of up to 10.
In addition to production and harvesting, biomass requires
transportation to a conversion facility. The energy used to transport biomass
over land averages about 0.5 megajoules per tonne-kilometre, depending on
infrastructure and vehicle type (Borjesson, 1996). This means that land
transport of biomass can become a significant energy penalty for distances of
more than 100 kilometres. But such a radius covers a surface of hundreds of
thousands of hectares, and is sufficient to supply enough biomass for conversion
facilities of hundreds of megawatts of thermal power.
Transporting biomass by sea is also an option. Sea transport
from Latin America to Europe, for example, would require less than 10 percent of
the energy input of the biomass (Agterberg and Faaij, 1998). International
transport of biomass (or rather, energy forms derived from biomass) is feasible
from an energy (and cost) point of view. Sea transport of biomass is already
practised: large paper and pulp complexes import wood from all over the
world.
Agricultural and forestry residues and municipal waste
Agricultural and forestry residues are the organic by-products
from food, fibre, and forest-product industries. Hall and others (1993) estimate
the energy contents of these residues at more than one-third of global
commercial energy use, of which about 30 percent is recoverable. Limitations
arise from the impracticality of recovering all residues and from the need to
leave some residues at the site (for fertilisation, for example) to ensure
sustainable production of the main product.
Forestry residues obtained from sound forest management do not
deplete the resource base. Under sustainable management, trees are replanted,
the forest is managed for regeneration to enhance its health and future
productivity, or both steps are taken. Energy is just one of the many outputs of
forests. One of the difficulties is accurately estimating the potential of
residues that can be available for energy use on a national or regional scale.
Municipal solid waste and industrial residues are indirect parts
of the biomass resource base. Industrialised countries generate 0.9 - 1.9
kilograms per capita of municipal solid waste every day. Energy contents range
from 4 - 13 megajoules per kilogram (IPPC, 1996a). Johansson and others (1993)
report heating values as high as 15.9 megajoules per kilogram in Canada and the
United States. Waste incineration, thermochemical gasification, and biodigestion
convert municipal solid waste into electricity, heat, or even gaseous and liquid
fuels. Because landfill disposal of municipal solid waste in densely populated
areas is increasingly constrained and associated with rising tipping fees, such
energy conversion can be profitable. Separating and recycling non-combustible
contents.
Municipal solid waste incineration requires tight air pollution
abatement due to the generation of complex compounds, some of which - such as
dioxins - are carcinogenic (WEC, 1994). Advanced pollution abatement equipment
essentially eliminates harmful pollutant emissions (Chen, 1995).
Johansson and others (1993) project that in industrialised
countries energy production from urban refuse will reach about 3 exajoules a
year by 2025.11 Data on municipal solid waste in developing countries
could not be found, but with rising living standards these same as those in
low-income OECD countries. Globally, this could double the potential energy
supply from municipal solid waste to 6
exajoules.
Environmental implications of biomass production
Forest energy plantations consist of intensively managed crops
of predominantly coppiced hardwoods, grown on cutting cycles of three to five
years and harvested solely for use as a source of energy. The site, local,
regional, and global impacts of these crops need to be considered. For example,
if short-rotation energy crops replace natural forests, the main negative
effects include increased risks of erosion, sediment loading, soil compaction,
soil organic matter depletion, and reduced long-term site productivity. Water
pollution from intensively managed sites usually results from sediment loading,
enhanced nutrient concentrations, and chemical residues from herbicides. In
contrast, if short-rotation crops replace unused or degraded agricultural land,
this reduces erosion, nutrient leaching, and so on.
Developing new crops is a slow and costly process involving many
technical and non-technical obstacles (Rosillo-Calle and others, 1996). Farmers
have been slow to adopt new crops because of the long-term (more than 15 years)
commitment needed. But research and development in Sweden and the United Kingdom
have found frost- and pest-resistant clones and generated high yields by using
mixed-clone planting and other management practices (Hall and Scrase, 1998).
Soil and nutrients. The abundant use of fertilisers and
manure in agriculture has led to considerable environmental problems in various
regions. These problems include nitrification of groundwater, saturation of
soils with phosphate (leading to eutrophication), and difficulties meeting
drinking water standards. In addition, the application of phosphates has
increased heavy metal flux to the soil.
The agricultural use of pesticides can affect the health of
people as well as the quality of groundwater and surface water - and,
consequently, plants and animals. Specific effects depend on the type of
chemical, the quantities used, and the method of application. Experience with
perennial crops (willow, poplar, eucalyptus) suggests that they meet strict
environmental standards. Agrochemical applications per hectare are 5 - 20 times
lower for perennial energy crops than for food crops like cereals (Hall, 1997).
Limited evidence on the soil effects of energy forestry
indicates that our understanding of this area is still relatively poor. Current
evidence indicates that, with proper practices, forest soil management need not
negatively affect physical, chemical, and biological soil parameters. Soil
organic matter can improve soil fertility, biology, and physical properties
(such as bulk density and water relations).12 Relative to arable
agriculture, energy plantations can improve the physical properties of soil
because heavy machinery is used less often and soil disturbances are fewer. Soil
solution nitrate can also be significantly reduced in soils planted with
fast-growing trees, as long as nitrogen fertilisers are applied in accordance
with the nutrient demands of the trees.
|
In tropical countries
large areas of deforested
and
degraded lands could benefit
from the establishment of
bioenergy
plantations. |
Biological fertilisers may replace chemical nitrogen fertilisers
in energy forestry and crops.
Biological fertilisation may include:
· Direct planting of
nitrogen-fixing woody species and interplanting with nitrogen-fixing trees or
ley crops.
· Soil amendments with various
forms of organic matter (sewage sludge, wastewater, contaminated groundwater,
farmyard manure, green manure).
· Stimulation or introduction of
rhizosphere micro-organisms that improve plant nutrient uptake.
· Biological
fallow.
Overall, from a nutritional point of view, there is no reason to
believe that energy forest plantations will have significant environmental and
ecological impacts when proper management practices are applied (Ericson, 1994).
Erosion. Erosion is related to the cultivation of many
annual crops in many regions and is a concern with woody energy crops during
their establishment phase. Little field data are available for comparison with
arable crops. One of the most crucial erosion issues relates to the additional
soil stabilisation measures required during the establishment of energy
plantations. Growing ground-cover vegetation strips between rows of trees can
mitigate erosion as long as competition does not occur.
Changing land use from agricultural production to an energy
forest plantation reduces precipitation excess (groundwater recharges) and
nutrient leaching. Nitrogen leaching decreases with energy plantations because
the standard nutrient supply and the use of animal slurries lead to good uptake
efficiencies relative to agricultural production systems. Nitrogen uptake
efficiency for arable crops is about 50 percent, for grass 60 percent, and for
forest plantations about 75 percent. The losses in these systems are mainly due
to leaching and de-nitrification (Rijtman and Vries, 1994).
Another concern relates to possible soil compaction caused by
heavy harvesting machinery. But these effects tend to be small to moderate due
to the infrequency of forest harvesting (Smith, 1995). Overall, these impacts
can be significantly lower than for conventional agriculture. When harvesting
perennials, soil erosion can be kept to an absolute minimum because the roots
remain in the soil. In the United States millions of hectares covered by grasses
that fall under the soil conservation programme could provide a promising
biomass production area, since biomass production can be combined with soil
protection. Another benefit of perennial crops relative to annual crops is that
their extensive root system adds to the organic matter content of the soil.
Generally, diseases (such as eels) are prevented and the soil gets a better
structure.
Many of the environmental and ecological impacts noted thus far
can be alleviated with compensating measures. Energy crops are generally more
environmentally acceptable than intensive agriculture because chemical inputs
are lower and the soil undergoes less disturbance and compaction.
Biodiversity and landscape. Biomass plantations may be
criticised because the range of biological species they support is much narrower
than is found in natural ecosystems, such as forests. While this is generally
true, it is not always relevant. Where plantations are established on degraded
or excess agricultural lands, the restored lands are likely to support a more
diverse ecology than before. Moreover, degraded land areas are plentiful: in
developing countries about 0.5 billion hectares of degraded land are available
(Bekkering, 1992). In any case, it is desirable to restore such land surfaces
for water retention, erosion prevention, and microclimate control.
A good plantation design - including set-aside areas for native
plants and animals situated in the landscape in a natural way - can avoid
problems normally associated with monocultures. The presence of natural
predators (such as insects) can also prevent the outbreak of pests and diseases.
Altogether, more research and insights on plantations are needed, taking into
account local conditions, species, and cultural
aspects.
Environmentally motivated responses to biomass production
Management practices are a key factor in the sustainable
production and use of biomass. Yet very little is known about managing
large-scale energy forest plantations or even agricultural and forestry residues
for energy use.13 The potential adverse environmental effects of
large-scale dedicated energy crops and forestry plantations have raised
concerns. Considerable effort has gone into investigatingthese concerns, and
much knowledge has been gained (see Tolbert, 1998 and Lowe and Smith, 1997).
As a result good practice guidelines are being developed for the
production and use of biomass for energy in Austria, Sweden, the United Kingdom,
and the United States, as well as across Europe.
TABLE 5.18 ANNUAL SOLAR ENERGY RECEIVED BY THE EARTH
|
Parameter |
Energy |
|
Solar energy intercepted by the Earth at ~1.37 kilowatts per
square metre |
5.5×10⁶ |
|
Solar energy reflected by the atmosphere back to space at ~0.3
kilowatts per square metre) |
1.6×10⁶ |
|
Solar energy potentially usable at ~1.0 kilowatts per square
metre |
3.9×10⁶ |
|
Ratio of potentially usable solar energy to current primary
energy consumption (402 exajoules) |
~9,000 |
Source: Author’s
calculations.
|
Very little is known about
managing large-scale energy
forest
plantations or even agricultural
and forestry residues
for
energy use. |
These guidelines focus on short-rotation coppice and recognise
the central importance of site-specific factors and the breadth of social and
environmental issues that should be taken into consideration. But given that
residues may remain more widely used than energy crops for quite some time,
guidelines are urgently needed on when it is appropriate to use residues for
energy, what fraction can be used, and how potential environmental advantages
can be maximised.
A key message of these guidelines is that site and crop
selection must be made carefully, and the crop must be managed sensitively.
Energy crops should not displace land uses of high agricultural and ecological
value. Consideration needs to be given to the landscape and visibility, soil
type, water use, vehicle access, nature conservation, pests and diseases, and
public access (ETSU, 1996; Hall and Scrase, 1998). The guidelines also stress
the importance of consulting with local people at the early planning stage, and
of ongoing community involvement in the development stages. Issues such as
changes to the landscape, increased traffic movements, or new employment
opportunities in rural areas may prove very significant to local
people.
Economics
The production costs of plantation biomass are already
favourable in some developing countries. Eucalyptus plantations in Brazil supply
wood chips for $1.5 - 2.0 a gigajoule (Carpentieri, Larson, and Woods, 1993).
Based on this commercial experience, Carpentieri, Larson, and Woods (1993)
project future biomass (wood chip) production of 13 exajoules a year on 50
million hectares of land. Costs are much higher in industrialised countries
(with top values of around $4 a gigajoule in parts of Europe). But in the longer
run, by about 2020, better crops and production systems are expected to cut
biomass production costs in the United States to $1.5 - 2.0 a gigajoule for
substantial land surfaces (Graham and others, 1995; Turnure and others, 1995).
Biomass costs are influenced by yield, land rent, and labour
costs. Thus increases in productivity are essential to reducing biomass
production costs. Yields can be improved through crop development, production
integration (multiproduct plantation), and mechanisation. Competition for land
use should be avoided to minimise inflated land rental rates. Labour costs can
be lowered through
mechanisation.
Solar energy resources
Solar energy has immense theoretical potential. The amount of
solar radiation intercepted by Earth is more than three orders of magnitude
higher than annual global energy use (table 5.18). But for several reasons the
actual potential of solar energy is somewhat lower:
· Time
variation. The amount of solar energy available at a given point is subject
to daily and seasonal variations. So, while the maximum solar flux at the
surface is about 1 kilowatt per square meter, the annual average for a given
point can be as low as 0.1 - 0.3 kilowatts per square meter, depending on
location. For large-scale application of solar energy - more than 5 - 10 percent
of the capacity of an integrated electricity system - the variability of
insolation necessitates energy storage or backup systems to achieve a reliable
energy supply.
· Geographic variation.
The availability of solar energy also depends on latitude. Areas near the
equator receive more solar radiation than subpolar regions. But geographic
variation can be significantly reduced by using collectors capable of following
the position of the sun. Polar regions show a notable increase in irradiance due
to light reflection from snow.
· Weather conditions.
Weather is another, even stronger, factor influencing the availability of solar
energy. Annual average sky clearness may vary by 80 - 90 percent in locations
such as Khartoum (Sudan), Dakar (Bangladesh), Kuwait, Baghdad (Iraq), Salt Lake
City (Utah), and by 40 - 50 percent in Tokyo (Japan) and Bonn (Germany; WEC,
1994). Solar irradiance is often quite diffuse, leading to lower average power
densities. Thus large-scale generation of solar energy can require significant
land.
· Siting options. While
building structures provide interesting local siting possibilities,14
large-scale solar collectors can be located on land that is not being used
- which amounts to about 4 billion hectares (FAO, 1999). Assuming 10 percent of
this unused land is allocated for habitation (cities, towns, villages) and
infrastructure (roads, ports, railways), some 3.6 billion hectares are available
for solar energy.
Large-scale availability of solar energy will thus depend on a
region’s geographic position, typical weather conditions, and land
availability. Using rough estimates of these factors, solar energy potential is
shown in table 5.19. This assessment is made in terms of primary energy - that
is, energy before the conversion to secondary or final energy is estimated. The
amount of final energy will depend on the efficiency of the conversion device
used (such as the photovoltaic cell applied). Issues related to energy
conversion and its impact on the amount of energy delivered are considered in
chapter 7.
This assessment also reflects the physical potential of solar
energy. Thus it does not take into account possible technological, economic, and
social constraints on the penetration of solar energy except for two different
assumptions on available land. The consideration of such constraints is likely
to result in much lower estimates - as in WEC (1994), where global solar energy
potential in 2020 ranges from 5 - 230 exajoules a year.
The solar energy potential in table 5.19 is more than sufficient
to meet current and projected energy uses well beyond 2100. Thus the
contribution of solar energy to global energy supplies will not be limited by
resource availability. Rather, three factors will determine the extent to which
solar energy is used in the longer run: the availability of efficient and
low-cost technologies to convert solar energy into electricity and eventually
hydrogen, of effective energy storage technologies for electricity and hydrogen,
and of high-efficiency end-use technologies fuelled by electricity and hydrogen.
TABLE 5.19. ANNUAL SOLAR ENERGY POTENTIAL (EXAJOULES)
|
Region |
Minimum |
Maximum |
|
North America |
181.1 |
7,410 |
|
Latin America and Caribbean |
112.6 |
3,385 |
|
Western Europe |
25.1 |
914 |
|
Central and Eastern Europe |
4.5 |
154 |
|
Former Soviet Union |
199.3 |
8,655 |
|
Middle East and North Africa |
412.4 |
11,060 |
|
Sub-Saharan Africa |
371.9 |
9,528 |
|
Pacific Asia |
41.0 |
994 |
|
South Asia |
38.8 |
1,339 |
|
Centrally planned Asia |
115.5 |
4,135 |
|
Pacific OECD |
72.6 |
2,263 |
|
Total |
1,575.0 |
49,837 |
|
Ratio to current primary energy consumption (402
exajoules) |
3.9 |
124 |
|
Ratio to projected primary energy consumption in 2050 (590 -
1,050 exajoules) |
2.7 - 1.5 |
84 - 47 |
|
Ratio to the projected primary energy consumption in 2100
(880 - 1,900 exajoules) |
1.8 - 0.8 |
57 - 26 |
Note: The minimum and maximum reflect different
assumptions on annual clear sky irradiance, annual average sky clearance, and
available land area.
Source: IEA, 1998c; Nakicenovic, Gr�bler, and McDonald,
1998.
Wind energy resources
Winds develop when solar radiation reaches the Earth’s
highly varied surface unevenly, creating temperature, density, and pressure
differences. Tropical regions have a net gain of heat due to solar radiation,
while polar regions are subject to a net loss. This means that the Earth’s
atmosphere has to circulate to transport heat from the tropics towards the
poles. The Earth’s rotation further contributes to semipermanent,
planetary-scale circulation patterns in the atmosphere. Topographical features
and local temperature gradients also alter wind energy distribution.
A region’s mean wind speed and its frequency distribution
have to be taken into account to calculate the amount of electricity that can be
produced by wind turbines. Wind resources can be exploited in areas where wind
power density is at least 400 watts per square metre at 30 metres above the
ground (or 500 watts per square metre at 50 metres). Moreover, technical
advances are expected to open new areas to development. The following assessment
includes regions where the average annual wind power density exceeds 250 - 300
watts per square metre at 50 metres - corresponding to class 3 or higher in the
widely used U.S. classification of wind resources.
TABLE 5.20. ANNUAL WIND ENERGY POTENTIAL
|
Region |
Percentage of land area |
Population density (people per square kilometre) |
Gross electric potential (thousands of terawatt- hours)
|
Assessed wind energy potential (exajoules) |
Estimated second-order potential (thousands of terawatt-
hours) |
Assessed wind energy potential, (exajoules) |
|
Africa |
24 |
20 |
106 |
1,272 |
10.6 |
127 |
|
Australia |
17 |
2 |
30 |
360 |
3 |
36 |
|
North America |
35 |
15 |
139 |
1,670 |
14 |
168 |
|
Latin America |
18 |
15 |
54 |
648 |
5.4 |
65 |
|
Western Europe |
42 |
102 |
31 |
377 |
4.8 |
58 |
|
Eastern Europe and former Soviet Union |
29 |
13 |
106 |
1,272 |
10.6 |
127 |
|
Asia (excl. former Soviet Union) |
9 |
100 |
32 |
384 |
4.9 |
59 |
|
Total |
23 |
|
500 |
6,000 |
53 |
640 |
Note: Refers to wind energy with average annual
power density of more than 250 - 300 watts per square metre at 50 metres
(resources class 3 and higher in the U.S. classification of wind resources). The
energy equivalent in exajoules is calculated based on the electricity generation
potential of the referenced sources by dividing the electricity generation
potential by a factor of 0.3 (a representative value for the efficiency of wind
turbines, including transmission losses), resulting in a primary energy
estimate. Totals are rounded.
Source: Grubb and Meyer, 1993.
TABLE 5.21. ESTIMATED ANNUAL WIND ENERGY RESOURCES
|
Region |
Land surface with wind class 3 - 7 |
Wind energy resources without land restriction |
Wind energy resources if less than 4 percent of land is
used |
|
|
Percent |
Thousands of square kilometres |
Thousands of terawatt- hours |
Exajoules |
Thousands of terawatt- hours |
Exajoules |
|
North America |
41 |
7,876 |
126 |
1,512 |
5.0 |
60 |
|
Latin America and Caribbean |
18 |
3,310 |
53 |
636 |
2.1 |
25 |
|
Western Europe |
42 |
1,968 |
31 |
372 |
1.3 |
16 |
|
Eastern Europe and former Soviet Union |
29 |
6,783 |
109 |
1,308 |
4.3 |
52 |
|
Middle East and North Africa |
32 |
2,566 |
41 |
492 |
1.6 |
19 |
|
Sub-Saharan Africa |
30 |
2,209 |
35 |
420 |
1.4 |
17 |
|
Pacific Asia |
20 |
4,188 |
67 |
804 |
2.7 |
32 |
|
China |
11 |
1,056 |
17 |
204 |
0.7 |
8 |
|
Central and South Asia |
6 |
243 |
4 |
48 |
0.2 |
2 |
|
Totala |
27 |
30,200 |
483 |
5,800 |
18.7 |
231 |
Note: The energy equivalent in exajoules is
calculated based on the electricity generation potential of the referenced
sources by dividing the electricity generation potential by a factor of 0.3 (a
representative value for the efficiency of wind turbines, including transmission
losses), resulting in a primary energy estimate. a. Excludes China.
Source: WEC, 1994.
Several studies have analysed the global potential of power
production using wind. To define technical wind power potential, one needs take
into account siting constraints. First-order exclusions may include definite
constraints such as cities, forests, difficult terrain, and inaccessible
mountain areas. The most important limitations arise from social, environmental,
and land-use constraints, including visual and noise impacts, all of which
depend on political and social judgements and traditions and may vary by region.
Regional estimates of wind electricity potentials (class 3 and above) are
summarised in table 5.20.
Grubb and Meyer (1993) estimate the theoretical electricity
generation potential of global wind energy resources (class 3 and above) to be
500,000 terawatt-hours a year (see table 5.20). Only about 10 percent of this
theoretical potential may be realistically harvested.
WEC (1994) places the global theoretical wind potential at
483,000 terawatt-hours a year (table 5.21). This estimate is based on the
assumption that 27 percent of the Earth’s land surface is exposed to an
annual mean wind speed higher than 5.1 metres per second at 10 metres above
ground (class 3 and above), and that this entire area could be used for wind
farms. WEC also suggests a more conservative estimate of 19,000 terawatt-hours a
year, assuming for practical reasons that just 4 percent of the area exposed to
this wind speed can be used for wind farms. (The 4 percent estimate comes from
detailed studies of wind power potential in the Netherlands and the United
States.)
Geothermal energy resources
Geothermal energy is generally defined as heat stored within the
Earth. The Earth’s temperature increases by about 3 degrees Celsius for
every 100 metres in depth, though this value is highly variable. Heat originates
from the Earth’s molten interior and from the decay of radioactive
materials.
Four types of geothermal energy are usually distinguished:
· Hydrothermal - hot
water or steam at moderate depths (100 - 4,500 metres).
· Geopressed - hot-water
aquifers containing dissolved methane under high pressure at depths of 3 - 6
kilometres.
· Hot dry rock - abnormally hot
geologic formations with little or no water.
· Magma - molten rock at
temperatures of 700 - 1,200 degrees Celsius.
Today only hydrothermal resources are used on a commercial scale
for electricity generation (some 44 terawatt-hours of electricity in 1997) and
as a direct heat source (38 terawatt-hours of heat; Bj�rnsson and others, 1998).
The global potential of geothermal energy is on the order of
140,000,000 exajoules. But a much smaller amount can be classified as resources
and reserves (table 5.22). Still, geothermal energy has enormous potential. Even
the most accessible part, classified as reserves (about 434 exajoules), exceeds
current annual consumption of primary energy. But like other renewable resources
(solar energy, wind energy), geothermal energy is widely dispersed. Thus the
technological ability to use geothermal energy, not its quantity, will determine
its future share. The regional distribution of geothermal energy potential is
shown in table 5.23.
Environmental aspects of geothermal energy use relate primarily
to gas admixtures to the geothermal fluids such as carbon dioxide, nitrogen,
hydrogen sulphides or ammonia and heavy metals such as mercury. The quantities
vary considerably with location and temperatures of the feed fluid but are
generally low compared to those associated with fossil fuel use. Because the
chemicals are dissolved in the feed water which is usually re-injected into the
drill holes, releases are
minimal.
Ocean energy resources
Four types of ocean energy are known:
· Tidal energy -
energy transferred to oceans from the Earth’s rotation through gravity of
the sun and moon.
· Wave energy - mechanical
energy from wind retained by waves.
· Ocean thermal energy - energy
stored in warm surface waters that can be made available using the temperature
difference with water in ocean depths.
· Salt gradient energy - the
energy coming from salinity differences between freshwater discharges into
oceans and ocean water.
Tidal energy is the most advanced in terms of current use, with
a number of commercial plants in operation. Despite notable progress in recent
years, the other ocean energy resources are generally not considered mature
enough for commercial applications.
TABLE 5.22. ANNUAL GEOTHERMAL POTENTIAL (EXAJOULES)
|
Resource category |
Energy |
|
Accessible resource base (amount of heat that could
theoretically be tapped within a depth of 5 kilometres) |
140,000,000 |
|
Useful accessible resource base |
600,000 |
|
Resources (portion of the accessible resource base expected to
become economical within 40 - 50 years) |
5,000 |
|
Reserves (portion of the accessible resource base expected to
become economical within 10 - 20 years) |
500 |
Source: Palmerini, 1993; Bj�rnsson and others,
1998.
TABLE 5.23. ANNUAL GEOTHERMAL POTENTIAL BY REGION
(EXAJOULES)
|
Resource category |
Energy |
|
North America |
26,000,000·(18.9) |
|
Latin America and Caribbean |
26,000,000·(18.6) |
|
Western Europe |
7,000,000·(5.0) |
|
Eastern Europe and former Soviet Union |
23,000,000·(16.7) |
|
Middle East and North Africa |
6,000,000·(4.5) |
|
Sub-Saharan Africa |
17,000,000·(11.9) |
|
Pacific Asia (excl. China) |
11,000,000·(8.1) |
|
China |
11,000,000·(7.8) |
|
Central and South Asia |
13,000,000·(9.4) |
|
Total |
140,000,000 |
Note: Numbers in parentheses are shares of world
total.
Source: WEC, 1994; EPRI, 1978.
TABLE 5.24. ANNUAL OCEAN ENERGY POTENTIAL
|
Resource category |
Terawatt-hours |
Exajoules |
|
Tidal energy |
22,000 |
79 |
|
Wave energy |
18,000 |
65 |
|
Ocean thermal energya |
2,000,000 |
7,200 |
|
Salt gradient energyb |
23,000 |
83 |
|
Total |
2,063,000 |
7,400 |
a. The potential of ocean thermal energy is
difficult to assess but is known to be much larger than for the other types of
ocean energy. The estimate used here assumes that the potential for ocean
thermal energy is two orders of magnitude higher than for tidal, wave, or salt
gradient energy. b. Assumes the use of all the world’s rivers with devices
of perfect efficiency.
Source: WEC, 1994, 1998; Cavanagh, Clarke, and Price,
1993.
The theoretical potential of each type of ocean energy is quite
large (table 5.24). But like other renewables, these energy resources are
diffuse, which makes it difficult to use the energy. The difficulties are
specific to each type of ocean energy, so technical approaches and progress
differ as
well.
Conclusion
Globally, energy resources are plentiful and are unlikely to
constrain sustainable development even beyond the 21st century (tables 5.25 and
5.26). If historical observations are any indication, possible intergenerational
equity conflicts on resource availability and costs will most likely be
equilibrated by technological progress. The fossil resource base is at least 600
times current fossil fuel use, or 16 times cumulative fossil fuel consumption
between 1860 and 1998. (The resource base does not include methane clathrates
and other oil, gas, and coal occurrences, the inclusion of which could quadruple
the resource base.)
While the availability and costs of fossil fuels are unlikely to
impede sustainable development, current practices for their use and waste
disposal are not sustainable (UNCED, 1993). In their natural states, energy
resources are environmentally inert (from the perspective of sustainable
development). Even mining and production of fossil resources interfere little
with sustainable development relative to current pollution emissions and wastes
associated with their combustion for the provision of energy services. Thus the
economic and environmental performance of fossil, nuclear, and renewable
conversion technologies - from resource extraction to waste disposal - will
determine the extent to which an energy resource can be considered sustainable.
Relative economic and environmental aspects make up the demand
pull for the development of future energy resources. Sociopolitical preferences
and policies can appreciably amplify or weaken the demand pull. In many
countries, especially transition economies but also several energy-exporting
developing countries, the domestic fossil energy resource endowment has yet to
be evaluated using market-based criteria. Such evaluations may lead to a
substantial revision of readily available reserve volumes and point to
unforeseen investments in up-stream operations to raise productivity to
international standards.
Energy resources are not evenly distributed across the globe.
Although renewables are more evenly distributed and accessible than fossil and
nuclear resources, their economic potential is affected by land-use constraints,
variation of availability as a function of latitude (solar power) and location
(wind power and hydroelectricity), solar irradiation, and water and soil quality
(biomass). Still, renewable energy flows are three orders of magnitude larger
than current global energy use (figure 5.4). Their use will depend primarily on
the commercialisation of conversion technologies. Similarly, uranium and thorium
resources are plentiful and do not pose a constraint to the long-term deployment
of nuclear power.
TABLE 5.25. SUMMARY OF GLOBAL FOSSILE AND FISSILE RESOURSES
(THOUSANDS OF EXAJOULES)
|
Resource |
Consumed by end 1998 |
Consumed in 1998 |
Reserves |
Resources |
Resource basea |
Additional occurrences |
|
Oil |
5.14 |
0.14 |
11.11 |
21.31 |
32.42 |
45 |
|
Conventional |
4.85 |
0.13 |
6.00 |
6.07 |
12.08 |
|
|
Unconventional |
0.29 |
0.01 |
5.11 |
15.24 |
20.35 |
45 |
|
Gas |
2.38 |
0.08 |
14.88 |
34.93 |
49.81 |
930 |
|
Conventional |
2.35 |
0.08 |
5.45 |
11.11 |
16.57 |
|
|
Unconventional |
0.03 |
0.00 |
9.42 |
23.81 |
33.24 |
930 |
|
Coal |
5.99 |
0.09 |
20.67 |
179.00 |
199.67 |
|
|
Fossile total |
13.51 |
0.32 |
46.66 |
235.24 |
281.89 |
975 |
|
Uranium |
|
|
|
|
|
|
|
Open cycle in thermal reactorsb |
n.e. |
0.04 |
1.89 |
3.52 |
5.41 |
7.1c |
|
Closed cycle with fast reactorsd |
- |
- |
113 |
211 |
325 |
426b |
|
Fossile and fissile totale |
n.e. |
0.36 |
48 |
446 |
575 |
1,400 |
n.e. Not estimated. - Negligible. a. Sum of reserves
and resources. b. Calculated from the amount in tonnes of uranium, assuming 1
tonne = 589 terajoules (IPCC, 1996a). c. Does not include uranium from seawater
or other fissile materials. d. Calculated assuming a 60-fold increase relative
to the open cycle, with 1 tonne = 35,340 terajoules. e. All totals are rounded.
Source: Author’s calculations from previous chapter
tables.

FIGURE 5.4. GLOBAL ENERGY BALANCE
AND FLOWS WITHOUT ANTHROPOGENIC INTERFERENCE
Note: Energy flows are in thousands of exajoules a
year. Numbers in parentheses are uncertain or rounded.
Source: S�rensen, 1979.
Most long-term energy demand and supply scenarios involve
increasing global energy trade, irrespective of the underlying assumptions of
energy resource and technology development. Supply security considerations may
tilt the balance in favour of one energy resource or set of resources. Supply
security improves with the share of energy supplies from national sources. A
thorough evaluation of a nation’s energy resource endowment based on market
criteria is an important step towards supply security.
The world energy system’s current dependence on fossil fuel
conversion is considered unsustainable by the United Nations (UNDP, 1997). It
has often been assumed that fossil resource limitations or the "running out of
resources" phenomenon (Meadows and others, 1972) would wean the energy system
off fossil sources and bring about the necessary course correction towards
sustainable energy development. Based on long-term global energy demand
expectations, current understanding of the world’s fossil resource
endowment, and production economics, this is unlikely to happen before the end
of the 21st century. Thus a transition to sustainable energy systems that
continue to rely predominantly on fossil fuels will depend on the development
and commercialisation of fossil technologies that do not close their fuel cycle
through the atmosphere.15 Alternatively, the transition will likely
require determined policies to move away from fossil fuels. Large increases in
fossil fuel prices as a result of rapid resource depletion are unlikely to drive
the transition.
TABLE 5.26. SUMMARY OF THE RENEWABLE RESOURCE BASE
(EXAJOULES A YEAR)
|
Resource |
Current usea |
Technical potential |
Theoretical potential |
|
Hydropower |
9 |
50 |
147 |
|
Biomass energy |
50 |
>276 |
2,900 |
|
Solar energy |
0.1 |
>1,575 |
3,900,000 |
|
Wind energy |
0.12 |
640 |
6,000 |
|
Geothermal energy |
0.6 |
5,000 |
140,000,000 |
|
Ocean energy |
n.e. |
n.e. |
7,400 |
|
Total |
56 |
> 7,600 |
> 144,000,000 |
n.e. Not estimated. a. The electricity part of
current use is converted to primary energy with an average factor of 0.385.
Source: Author’s calculations from previous chapter
tables.
|
Renewable energy
flows are three orders of
magnitude
larger than
current global
energy use. |
Transitions motivated by factors other than short-term economics
usually invoke extra costs that have to be borne by contemporary societies for
the benefit of future ones. In either case - making the use of fossil fuels
sustainable or shifting to non-fossil energy sources - society must first
recognise that the current energy system is unsustainable and that adequate
policy measures need to be introduced. These measures may stimulate
technological advances and development, change consumer preferences, or both.
After all, the existence of enormous fossil, nuclear, and renewable resources is
irrelevant unless there is a demand for them and unless technologies for their
extraction and sustainable conversion to energy services are commercially
available. Otherwise, resources remain ‘neutral stuff’.
Notes
1. However, Masters and others argue that most major
oil-producing countries are reporting as proven reserves what the authors would
define as identified reserves (proven plus probable plus possible).
2. Oil production costs and market prices may differ
significantly, however. Oil is a highly political commodity with market prices
that often have little relation to costs. While economic rationality suggests
that the least-cost oil reserves are produced first, this has not been the case,
at least since 1973. That gives low-cost and lowest-cost producers quite a bit
of leverage in engineering market price instabilities or backing out of
high-cost production.
3. The ratio of reserves to production assumes constant demand
for a resource as well as constant production over the period suggested by the
ratio. In essence, it implies that production will plummet from full output in
one year to zero output in another. In reality, production peaks and then
declines along a quasi-logistic curve, and supplies will last much longer,
though at much lower volumes than suggested by the ratio.
4. Once an investment has been committed for gas export
pipelines, it cannot easily be designated for other uses (whereas an oil tanker
may be rerouted instantly by a single radio call). Disputes between trading
partners may put the investment at risk and lead to disruptions in supply and
off take.
5. Temperature increases as a function of high atmospheric
carbon concentrations are highly uncertain. For example, the mean global
temperature increase estimated for a doubling of carbon dioxide concentrations
ranges from 1.5 - 4.5 Kelvin (IPCC, 1996b).
6. Uranium reserves as defined by the Uranium Institute are
proven and probable reserves (labelled Reserve Class I) at production costs of
less than $40 a kilogram, less than $60 a kilogram, and less than $80 a
kilogram. WEC (1998) uses the term proven reserves for the NEA-IAEA
category reasonably assure resources.
7. The Uranium Institute uses for the lesser-known category
Reserve Class II. WEC (1998) defines its estimated additional amounts
recoverable to correspond to NEA-IAEA EAR I.
8. A detailed and consistent compilation for all countries is
not available, and country-specific information is often published without
verification. The International Water Power and Dams Construction Yearbook
(1998) and even the World Atlas and Industry Guide (1998) present a
few inconsistencies. Nevertheless, a cross-check showed a similar world total
for these two sources.
9. The consideration of social and environmental aspects
suggests that this is the market potential. Because of inconsistencies in the
definitions used in different appraisals, here the notion of economic potential
is maintained.
10. Non-commercial biomass is difficult to account for
accurately or goes unreported. For instance, biomass data for China and India
are not included in the WEC statistics.
11. It is assumed that 75 percent of the energy in urban refuse
can be recovered and that the waste generation rate per capita is constant over
time. Estimates for Canada and the United States are based on a per capita waste
generation rate of 330 kilograms a year and a heating value of 15.9 megajoules
per kilogram (and a 50 percent recycling rate). Estimates for other OECD
countries are based on a per capita waste generation rate of 300 kilograms a
year and a heating value of 12.7 megajoules per kilogram.
12. A review of the literature indicates that over time there
are few, if any, long-term losses of soil carbon after forest harvesting and
reforestation. But substantial losses of soil carbon are reported for systems
involving harvesting followed by intensive burning or mechanical site damage.
Holistic, life-cycle approaches are required to estimate the contribution of
intensive forest management and bioenergy systems to local and global carbon
balances.
13. There are exceptions: a lot is known about eucalyptus for
charcoal production and sugarcane for ethanol production in Brazil (which tend
to follow traditional agricultural and forestry practices). Similarly, there is
extensive knowledge about willows for heat power generation in Sweden, where the
cultivation of about 16,000 hectares has also borrowed considerably from
traditional forestry and agricultural activities.
14. For example, if the performance and costs of solar
collectors integrated with buildings are improved, commercial buildings could
become local energy production centres. Such integration would enlarge the space
available for solar collection and allow buildings to contribute to their energy
use.
15. Decarbonisation of fuels (before use) or greenhouse gas
abatement (after fuel production or use) and subsequent carbon dioxide disposal
could eventually avoid closing the carbon fuel cycle through the atmosphere (see
chapters 8 and 11).
References
Aalund, L.R. 1998. "Technology, Money Unlocking Vast Orinoco
Reserves." Oil and Gas Journal Special 96 (42): 49 - 50.
Adelman, M.A., and M.C. Lynch. 1997. "Fixed View of Resources
Limits Creates Undue Pessimism." Oil and Gas Journal 95 (14): 56 - 60.
Agterberg, A., and A. Faaij. 1998. "Biotrade: International
Trade in Renewable Energy from Biomass." In Proceedings of the 10th European
Conference on Biomass for Energy and Industry. Utrecht University,
Department of Science, Technology, and Society, W�rzburg, Netherlands.
Alexandratos, N. 1995. "World Agriculture towards 2010
Netherlands". A study by the Food and Agriculture Organization of the United
Nations. Chichester: John Wiley & Sons.
ANEEL (Agencia Nacional de Energia Eletrica). 1999.
www.aneel.gov.br. Brasilia, Brazil.
Bekkering, T.D. 1992. "Using Tropical Forests to Fix Atmospheric
Carbon: The Potential in Theory and Practice." Ambio 21: 414 - 19.
BGR (Bundesanstalt f�r Geowissenschaften und Rohstoffe [Federal
Institute for Geosciences and Natural Resources]). 1995. Reserven, Ressourcen
und Verf�gbarkeit von Energierohstoffen 1995 [Availability of Energy Reserves
and Resources 1995]. Hannover, Germany.
BGR (Bundesanstalt f�r Geowissenschaften und Rohstoffe [Federal
Institute for Geosciences and Natural Resources]). 1998. Reserven, Ressourcen
und Verf�gbarkeit von Energierohstoffen 1998 [Availability of Energy Reserves
and Resources 1998]. Hanover, Germany.
Biewinga, E.E., and G. van der Bijl. 1996. Sustainability of
Energy Crops in Europe: A Methodology Developed and Applied. CLM 234.
Utrecht: Netherlands Centre for Agriculture and Environment.
Bj�rnsson, J., and others. 1998. "The Potential Role of
Geothermal Energy and Hydropower in the World Energy Scenario in Year 2020."
Paper presented at the 17th Congress of the World Energy Council, 13 - 18
September, Houston, Tex.
Bloss, W.H., O. Kappelmeyer, J. Koch, J. Meyer, and E. Schubert.
1980. Survey of Energy Resources. Hannover, Germany: Federal Institute
for Geosciences and Natural Sciences.
Boiteux, M. 1989. "Hydro: An Ancient Source of Power for the
Future." International Water Power and Dam Construction Yearbook. Sutton,
Surrey. England. Buisness Press International.
Borjesson, P. 1996. "Emission of CO2 from Biomass
Production and Transportation in Agriculture and Forestry." Energy Conversion
and Management 37: 6 - 8.
BP (British Petroleum). 1998. BP Statistical Review of World
Energy. London.
BP (British Petroleum).1999. BP Statistical Review of World
Energy. London.
Campbell, C.J., and J.H. Laherrere. 1998. "The End of Cheap
Oil." Scientific American 278 (3): 78 - 83.
Carpentieri, E., E. Larson, and J. Woods. 1993. "Future
Biomass-Based Power Generation in Northeast Brazil." Biomass and Bioenergy
4 (3): 149 - 73.
Cavanagh, J.E., J.H. Clarke, and R. Price. 1993. "Ocean Energy
Systems." In T.B. Johansson, H. Kelly, A.K.N. Reddy, and R.H. Williams, eds.,
Renewable Energy: Sources for Fuels and Electricity. Washington, D.C.:
Island Press.
Chadwick, J. 1998. "Mining Alberta’s Oil Sands." Mining
Magazine 179 (2): 58 - 73.
Charpak, G., and R.L. Garwin. 1998. Feux Follets et
Champignons Nucleaires. Paris: Editions Odile Jacob.
Chen, J. 1995. "The Production of Methanol and Hydrogen from
Municipal Solid Waste." MSE Thesis, CEES Report 289. Princeton University,
Mechanical and Aerospace Engineering Department, Princeton, N.J.
Churchill, A.A. 1997. "Meeting Hydro’s Financing and
Development Challenges." In T. Dorcey, ed., Large Dams: Learning from the
Past, Looking at the Future. Gland, Switzerland: World Conservation Union
and the World Bank.
Collet, T.S. 1993. "Natural Gas Production from Arctic Gas
Hydrates." U.S. Geological Survey 65: 299 - 311.
Collet, T.S., and V.A. Kuuskraa. 1998. "Hydrates Contain Vast
Store of World Gas Resources." Oil and Gas Journal 96 (19).
D’Apote, S.L. 1998. "IEA Biomass Energy Analysis and
Projections." In Biomass Energy: Data, Analysis and Trends. Proceedings
of the Organisation for Economic Co-operation and Development and the
International Energy Agency conference, 23 - 24 March, Paris.
Davidson, R.M. 1995. Coalbed Methane Extraction. London:
International Energy Agency Coal Research.
De Jager, D., A. Faaij, and W.P. Troelstra. 1998.
Cost-Effectiveness of Transportation Fuels from Biomass. Report prepared
for NOVEM (EWAB rapport 9830). Utrecht University, Department of Science,
Technology, and Society, Innas B.V., Utrecht, the Netherlands.
Edwards, J.D. 1997. "Crude Oil and Alternative Energy Production
Forecasts for the Twenty-first Century: the End of the Hydrocarbon Era." AAPG
Bulletin 81 (8): 1292 - 315.
Elrod, J.P. 1997. "Horizontal Air Drilling Increases Gas
Recovery in Depleted Zone." Oil and Gas Journal 95 (26): 49 - 63.
EPRI (Electric Power Research Institute). 1978. Geothermal
Energy Prospects for the Next 50 Years. Palo Alto, Calif.
Ericson, T. 1994. "Nutrient Cycling in Energy Forest
Plantations." Biomass and Bioenergy 6: 115 - 21.
ETSU (Energy Technology Support Unit). 1996. Good Practices
Guidelines: Short Rotation Coppice for Energy Production. Department of
Trade and Industry. London: Seacourt Press.
Falkenmark, M.. 1997. "Meeting Water Requirements of an
Expanding World." Phil. Trans. R. Soc. Lond. B352: 929 - 36.
FAO (Food and Agriculture Organization of the United Nations)
1993. "Agriculture: Towards 2010." FAO Conference (27th Session), Rome.
FAO (Food and Agriculture Organization of the United Nations).
1999. "Statistical Databases on the Internet."
http://apps.fao.org/cgi-bin/nph-db.pl?subset=agriculture. Rome.
Fischer, G., and G.K. Heilig. 1998. "Population Momentum and the
Demand on Land and Water Resources." Report IIASA-RR-98-1. International
Institute for Applied Systems Analysis, Laxenburg, Austria.
Garwin, R.L. 1999. Personal communication. September.
George, R.L. 1998. "Mining for Oil." Scientific American
278 (3): 84 - 85.
Goodland, R. 1996. "Distinguishing Better Dams from Worse."
International Water Power and Dam Construction. Sutton, Surre, England:
Buisness Press International.
Goodland, R. 1997. "Environmental Sustainability in the Hydro
Industry: Desegregating the Debate." In T. Dorcey, ed., Large Dams: Learning
from the Past, Looking at the Future. Gland, Switzerland: World Conservation
Union and the World Bank.
Graham, R., E. Lichtenberg, V. Roningen, H. Shapouri, and M.
Walsh. 1995. "The Economics of Biomass Production in the United States." In
Proceedings of the Second Biomass Conference of the Americas. Golden,
Colo.: National Renewable Energy Laboratory.
Gregory, K., and H-H. Rogner. 1998. "Energy Resources and
Conversion Technologies for the 21st Century." Mitigation and Adaptation
Strategies for Global Change 3: 171 - 229.
Grubb, M.J., and N.I. Meyer. 1993. "Wind Energy: Resources,
Systems, and Regional Strategies." In Johansson T.B and others, eds.,
Renewable Energy: Sources for Fuels and Electricity. Washington, D.C.:
Island Press.
Hall, D.O. 1997. "Biomass Energy in Industrialized Countries: A
View of the Future." Forest Ecology and Management 91: 17 - 45.
Hall, D.O., and K.K. Rao. 1994. Photosynthesis.
Cambridge: Cambridge University Press.
Hall, D.O., and F. Rosillo-Calle. 1998. Biomass Resources
Other than Wood. London: World Energy Council.
Hall, D.O., and J.I. Scrase. 1998. "Will Biomass Be the
Environmentally Friendly Fuel of the Future?" Biomass and Bioenergy 15
(4/5): 357 - 67.
Hall, D O, Rosillo-Calle F, R.H. Williams, and J. Woods. 1993.
"Biomass for Energy: Supply, Prospects." In T.B.J. Johansson and others, eds.,
Renewable Energy for Fuels and Electricity. Washington, D.C.: Island
Press.
Hatfield, C.B. 1997. "Oil Back on the Global Agenda." Nature
387: 121.
Hiller, K. 1999. "Verf�gbarkeit von Erd�l [The Availability of
Petroleum]." Erd�l Erdgas Kohle 115 (2): 50 - 54.
Hobbs, G.W. 1995. "Energy Minerals. Oil Shale, Coalbed Gas,
Geothermal Trends Sized Up." Oil and Gas Journal 93 (37).
Holder, G.D., V.A. Kamath, and S.P. Godbole. 1984. "The
Potential of Natural Gas Hydrates as an Energy Source." Annual Review of
Energy 9: 427 - 45.
IEA (International Energy Agency. 1998a. Biomass Energy:
Data, Analysis and Trends. Paris.
IEA (International Energy Agency. 1998b. Energy Statistics
and Balances of Non-OECD Countries, 1995 - 1996. Paris.
IEA (International Energy Agency. 1998c. World Energy
Outlook. Paris
IEA (International Energy Agency. 1999. Key World Energy
Statistics from the IEA. Paris.
IGU (International Gas Union). 1997. World Gas Prospects:
Strategies and Economics. Proceedings of the 20th World Gas Conference, 10 -
13 June, Copenhagen, Denmark.
IGU (International Gas Union). 2000. World Gas Prospects:
Strategies and Economics. Proceedings of the 21st World Gas Conference, 6 -
9 June, Nice, France.
International Water Power and Dam Construction. 1989.
"The Increasing Importance of Power Plant Refurbishment." Sutton, Surrey,
England: Business Press International.
International Water Power and Dam Construction. 1998.
Water Power and Dam Construction Yearbook. Sutton, Surrey, England:
Business Press International.
IPCC (Intergovernmental Panel on Climate Change). 1996a.
"Climate Change 1995." In R.T. Watson, M.C. Zinyowera, and R.H. Moss, eds.,
Facts, Adaptations and Mitigation of Climate Change: Scientific-technical
Analysis. Contribution of Working Group II to the Second Assessment Report of
the Intergovernmental Panel on Climate Change. Cambridge: Cambridge
University Press.
IPCC (Intergovernmental Panel on Climate Change). 1996b.
"Climate Change 1995: The Science of Climate Change." In J.T. Houghton, L.G.
Meira Filho, B.A. Callander, N. Harris, A. Kattenberg, and K. Maskell, eds.,
Contribution of Working Group I to the Second Assessment Report of the
Intergovernmental Panel on Climate Change. Cambridge: Cambridge University
Press.
Ivanhoe, L.F., and G.G Leckie. 1993. "Global Oil, Gas Fields,
Sizes Tallied, Analyzed." Oil and Gas Journal 15: 87 - 91.
Johansson, T.B., H. Kelly, A. K.N. Reddy, and H. Williams. 1993.
"Appendix to Chapter 1: A Renewable-Intensive Global Energy Scenario." In T.B.
Johansson, H. Kelly, K.N. Reddy, and R.H. Williams, eds., Renewable Energy:
Sources for Fuels and Electricity. Washington, D.C.: Island Press.
Kaltschmitt, M., G.A. Reinhardt, and T. Stelzer. 1996. "LCA of
Biofuels under Different Environmental Aspects." Universit�t Stuttgart, Institut
f�r Energiewirtschaft und Rationelle Energieanwendung, Stuttgart, Germany.
Law, B.E., and C.W. Spencer. 1993. "Gas in Tight Reservoirs: An
Emerging Major Source of Energy." In The Future of Energy Gases.
Professional Paper 1570. Reston, Va.: U.S. Geological Survey.
Lowe, A.T, and C.T. Smith. 1997. "Environmental Guidelines for
Developing Sustainable Energy Output from Biomass." Biomass and Bioenergy
13 (special issue): 187 - 328.
L’vovich, M.I. 1987. "Ecological Foundations of Global
Water Resources Conservation." In D.J. McLaren and B. J Skinner, eds.,
Resources and World Development. Chichester, N.Y.: John Wiley & Sons.
MacDonald, G.J. 1990a. "The Future of Methane as an Energy
Resource." Annual Review of Energy 15: 53 - 83.
MacDonald, G.J. 1990b. "Role of Methane Clathrates in Past and
Future." Climate Change 16: 247 - 81.
MacKenzie, J.J. 1996. Oil As a Finite Resource: When Is
Global Production Likely to Peak? Washington, D.C.: World Resources
Institute.
Marsden, S. 1993. "A Survey of Natural Gas Dissolved in Brine."
In The Future of Energy Gases. Professional Paper 1570. Reston, Va.: U.S.
Geological Survey.
Masters, C.D., E.D. Attanasi, and D.H. Root. 1994. World
Petroleum Assessment and Analysis. Proceedings of the 14th World Petroleum
Congress. New York: John Wiley & Sons.
Max, M.D., R.E. Pellanbarg, and B.G. Hurdle. 1997. "Methane
Hydrate, a Special Clathrate: Its Attributes and Potential." Report
NRL/MR/6101-97-7926. Naval Research Laboratory. Washington D.C.
McCully, P. 1996. Silenced Rivers: The Ecology and Politics
of Large Dams. London: ZED Books.
McKelvey, V.E. 1967. "Mineral Resource Estimates and Public
Policy." American Scientist 60: 32 - 40.
Meadows, C.D., D. Meadows, J. Randers, and W.W. Behrens. 1972.
The Limits to Growth: A Report for the Club of Rome’s Project on the
Predicament of Mankind. New York: Universe Books.
Meyer, R.F. 1997. World Heavy Crude Oil Resources.
Proceedings of the 15th World Petroleum Congress. New York: John Wiley &
Sons.
Moreira, J.R., and J. Goldemberg. 1999. "The Alcohol Program."
Energy Policy 27: 229 - 45.
Moreira, J. R., and A.D. Poole. 1993. "Hydropower and Its
Constraints." In T.B. Johansson H. Kelly, K.N. Reddy, and R.H. Williams, eds.,
Renewable Energy: Sources for Fuels and Electricity. Washington, D.C.:
Island Press.
Nakicenovic, N., A. Gr�bler, and A. McDonald, eds. 1998.
Global Energy Perspectives. Cambridge: Cambridge University Press.
NEA (Nuclear Energy Agency) and IAEA (International Atomic
Energy Agency). 1997. Uranium Resources Production and Demand ("Red
Book"). Paris and Vienna: Organisation for Economic Co-operation and
Development.
Nehring, R. 1998. "Knowledge, Technology Improvements Boosting
U.S. Upstream Operations." Oil and Gas Journal 96 (44): 94 - 97.
Nobukawa, H., and others. 1994. "Development of a Floating Type
System for Uranium Extraction from Seawater Using Sea Current and Wave Power."
Proceedings of the 4th (1994) International Offshore and Polar
Engineering Conference. Cupertino, Calif.: International Society of Offshore
and Polar Engineers.
Odell, P.R. 1997. "Oil Reserves: Much More than Meets the Eye."
Petroleum Economist 64: 29 - 31.
Odell, P.R. 1998. Fossil Fuel Resources in the 21st Century.
Vienna: International Atomic Energy Agency.
Palmerini, C.G. 1993. "Geothermal Energy." In T.B. Johansson and
others, eds., Renewable Energy: Sources for Fuels and Electricity.
Washington, D.C.: Island Press.
PCAST (President’s Committee of Advisors on Science and
Technology), Panel on Energy Research and Development. 1997. Report to the
President on Federal Energy Research and Development for the Challenges of the
Twenty-first Century. Executive Office of the President, Washington D.C.
Penner, S.S., and others. 1982. "Assessment of Research Needs
for Oil Recovery from Heavy Oil Sources and Tar Sands." Energy 7 (567).
Polikar, M., and T. Cyr. 1998. "Alberta Oil Sands: The Advance
of Technology, 1978 - 1998 and Beyond." In Proceedings of the 7th UNITAR
International Conference on Heavy Crude and Tar Sands. Paper 1998.002.
Beijing, China.
Population Action International. 1997. "Why Population Matters.
Population Action International."
https://www.populationaction.org/why-pop/graph29.htm
Raabe, I.J. 1985. "Hydro Power: The Design, Use, and Function of
Hydro-mechanical, Hydraulic, and Electrical Equipment." VDI-Verlarg, D�sseldorf,
Germany.
Raskin, P., P. Gleick, P. Kirschen, G. Pontius, and K. Strzepek.
1997. Water Futures: Assessment of Long-range Patterns and Problems.
Stockholm: Stockholm Environment Institute.
Ravindranath, N.H., and D.O. Hall. 1996. Energy for
Sustainable Development 2: 14 - 20.
Rice, D.R., B.E. Law, and J.L. Clayton. 1993. "Coalbed Gas: An
Undeveloped Resource." In The Future of Energy Gases. Professional Paper
1570. U.S. Geological Survey. Reston, Va.
Rijtman, P E., and D. Vries. 1994. "Differences in Precipitation
Excess and Nitrogen Leaching from Agricultural Lands and Forest Plantations."
Biomass and Bioenergy 6: 103 - 13.
Rogner, H-H. 1997. "An Assessment of World Hydrocarbon
Resources." Annual Review of Energy and the Environment 22: 217 - 62.
Rosillo-Calle, F., M.E. Rezende, P. Furtado, and D.O. Hall.
1996. The Charcoal Dilemma. Finding a Sustainable Solution for Brazilian
Industry. London: IT Publications.
Sadler, K., and R. Houlihan. 1998. "Oil Sands Development in
Alberta: An EUB Perspective." In Proceedings of the 7th UNITAR
International Conference on Heavy Crude and Tar Sands. Paper 1998.012.
Beijing.
Schollnberger, W.E. 1998. "Gedanken �ber die
Kohlenwasserstoffreserven der Erde. Wie lange k�nnen sie vorhalten? [Reflections
on Global Hydrocarbon Reserves: How Long Will These Last?]" In J. Zemann, ed.,
Energievorr�te und mineralische Rohstoffe: Wie lange noch? [Energy Resources
and Mineral Resources]. Vienna: Verlag der �sterreichischen Akademie der
Wissenschaften.
Seckler, D., U. Amarasinghe, D. Molden, R. de Silva, and R.
Barker. 1998. World Water Demand and Supply, 1990 to 2025: Scenarios and
Issues. Research Report 19. Colombo, Sri Lanka: International Water
Management Institute.
Shapouri, H., J.A. Duffield, and M.S. Graboski. 1995.
Estimating the Net Energy Balance of Corn Ethanol. Econ. Res. Serv. Rep.
721. U.S. Department of Agriculture, Washington, D.C.
Shell. 1996. The Evolution of the World’s Energy System.
Group External Affairs, London.
Shiklomanov, I.A. 1993. "World Fresh Water Resources." In P.H.
Gleick, ed., Water in Crisis: A Guide to the World’s Fresh Water
Resources. Oxford: Oxford University Press.
Smith, C.T. 1995. "Environmental Consequences of Intensive
Harvesting." Biomass and Bioenergy 27 (10): 161 - 79.
S�rensen, B. 1979. Renewable Energy. London: Academic
Press.
Stosur, G.J., S.L. Waisley, T.B. Reid, and L.C. Marchant. 1998.
"Tar Sands: Technologies, Economics, and Environmental Issues for Commercial
Production beyond the Year 2000." In Proceedings of the 7th UNITAR
International Conference on Heavy Crude and Tar Sands. Paper 1998.002.
Beijing.
Taylor, J. 1989. "Extending the Operating Life of Hydro
Equipment." International Water Power and Dam Construction Yearbook.
Sutton, Surrey, England. Buisness Press International.
Tolbert, V. 1998. "Environmental Effects of Biomass Crop
Production. What Do We Know? What Do We Need to Now?" Biomass and Bioenergy
(special issue): 1301 - 1414.
Turnure, J.T., S. Winnett, R. Shackleton, and W. Hohenstein.
1995. "Biomass Electricity: Long-run Economic Prospects and Climate Policy
Implications." In Proceedings of the Second Biomass Conference of the
Americas. Golden, Colo.: National Renewable Energy Laboratory.
UNCED (United Nations Conference on Environment and
Development). 1993. Agenda 21: Resolutions Adopted by the Conference.
Document A/Conf. 151/26/REV.1. New York.
USDOE (United States Department of Energy). 1998. A Strategy
for Methane Hydrates Research and Development. Office of Fossil Energy,
Washington, D.C.
UNDP (United Nations Development Programme). 1997. Energy
after Rio: Prospects and Challenges. Sustainable Energy and Environment
Division, Energy and Atmosphere Programme, New York.
UNEP (United Nations Environment Programme). 1985. "The
Environmental Impacts of Exploitation of Oil Shales and Tar Sands." Energy
Report Series, ERS-13-85. Nairobi, Kenya.
UNESC (United Nations Economic and Social Council). 1997.
"United Nations International Framework Classification for Reserves/Resources."
Economic Commission for Europe, Geneva.
USGS (U.S. Geological Survey). 1980. "Principles of a
Resource/Reserve Classification for Minerals." U.S. Geological Survey Circular
831.
WEC (World Energy Council). 1994. New Renewable Energy
Resources: A Guide to the Future. London: Kogan Page Limited.
WEC (World Energy Council). 1998. Survey of Energy Resources.
18th ed. London. WEC.
WHO (World Health Organization). 1982. Environmental Health
Criteria 20: Selected Petroleum Products. Geneva.
WHO (World Health Organization). 1997. Health and Environment
in Sustainable Development: Five Years after the Earth Summit. Geneva.
Woods, J., and D.O. Hall. 1994. "Bioenergy for Development." FAO
Paper 13. Food and Agriculture Organisation, Rome.
World Atlas and Industry Guide. 1998. "Annual Summary."
International Journal on Hydropower and Dams. Sutton, Surrey: Aqua-M�dia
International.
WRI (World Resources Institute). 1998. World Resources 1998 -
99. Oxford: Oxford University
Press.
Chapter 6. Energy End-Use Efficiency
Eberhard Jochem (Germany)
LEAD AUTHORS: Anthony Adegbulugbe (Nigeria), Bernard
Aebischer (Switzerland), Somnath Bhattacharjee (India), Inna Gritsevich
(Russia), Gilberto Jannuzzi (Brazil), Tamas Jaszay (Hungary), Bidyut Baran Saha
(Japan), Ernst Worrell (United States), and Zhou Fengqi (China)
CONTRIBUTING AUTHORS: Mohamed Taoufik Adyel (Morocco), John
Akinbami (Nigeria), David Bonilla (Japan), Allen Chen (United States), Alexander
Kolesov (Russia), Hans Florentin Krause (United States), Wilhelm Mannsbart
(Germany), Tim McIntosch (Canada), Louise Metivier (Canada), Folasade Oketola
(Nigeria), David Pelemo (Nigeria), Jean Pierre Des Rosiers (France), Lee
Schipper (United States), and XiuJian Hu (China)
|
ABSTRACT
Since the 1970s more efficient energy use in OECD countries
has weakened or eliminated the link between economic growth and energy use. At
the global level just 37 percent of primary energy is converted to useful energy
- meaning that nearly two-thirds is lost. The next 20 years will likely see
energy efficiency gains of 25-35 percent in most industrialised countries and
more than 40 percent in transition economies. Dematerialization and recycling
will further reduce energy intensity. Thus energy efficiency is one of the main
technological drivers of sustainable development world-wide.
Energy policy has traditionally underestimated the benefits
of end-use efficiency for society, the environment, and employment. Achievable
levels of economic efficiency depend on a country’s industrialisation,
motorization, electrification, human capital, and policies. But their
realisation can be slowed by sector - and technology-specific obstacles -
including lack of knowledge, legal and administrative obstacles, and the market
power of energy industries. Governments and companies should recognise
innovations that can lower these obstacles. The external costs of energy use can
be covered by energy taxes, environmental legislation, and greenhouse gas
emissions trading. There is also an important role for international
harmonisation of regulations for efficiency of traded products. Rapid growth in
demand provides especially favourable conditions for innovations in developing
countries - enabling these countries to leapfrog stages of development if market
reforms are also in place.
The economic potentials of more efficient energy use will
continue to grow with new technologies and with cost reductions resulting from
economies of scale and learning effects. Considerations of the second law of
thermodynamics at all levels of energy conversion and technological improvements
at the level of useful energy suggest further potential for technical efficiency
of almost one order of magnitude that may become available during this century.
Finally, structural changes in industrialised and transition economies - moving
to less energy-intensive production and consumption - will likely contribute to
stagnant or lower energy demand per capita in these countries. |
Today more than 400,000 petajoules a year of primary energy
deliver almost 300,000 petajoules of final energy to customers, resulting in an
estimated 150,000 petajoules of useful energy after conversion in end-use
devices. Thus 250,000 petajoules are lost, mostly as low- and medium-temperature
heat. Globally, then, the energy efficiency of converting primary to useful
energy is estimated at 37 percent. Moreover, considering the capacity to work
(that is, the exergy) of primary energy relative to the exergy needed by useful
energy according to the second law of thermodynamics, the efficiency of
today’s energy systems in industrialised countries is less than 15 percent.
But energy efficiency can be improved - and energy losses avoided - during the
often overlooked step between useful energy and energy services (figure 6.1).
One main goal of energy analysis in the context of sustainable
development is to explore ways to reduce the amount of energy used to produce a
service or a unit of economic output - and, indirectly, to reduce related
emissions. Two questions are key: How tight is the link between final energy use
and the energy service in a given end use? And what is the potential for
technological and organisational changes to weaken that link in the next 10-20
years? Because the technologies used in different regions differ substantially,
the potential for economic efficiency varies. Still, more efficient energy use
is one of the main options for achieving global sustainable development in the
21st century.
This chapter focuses on end-use energy efficiency - that is,
more efficient use of final energy or useful energy in industry, services,
agriculture, households, transportation, and other areas (see figure 6.1).
Supply-side energy efficiency (energy extraction, conversion, transportation,
and distribution) is treated in chapters 5 and 8. Supply-side efficiency has
been the focus of energy investment and research and development since the early
20th century. End-use efficiency has received similar attention only since the
mid-1970s, having been proven cheaper in many cases but often more difficult to
achieve for reasons discussed below.
Energy efficiency - and indirectly, improved material efficiency
- alleviates the conflicting objectives of energy policy. Competitive and low
(but full-cost) energy prices support economic development. But they increase
the environmental burden of energy use. They also increase net imports of
conventional energies and so tend to decrease the diversity of supply. Using
less energy for the same service is one way to avoid this conflict. The other
way is to increase the use of renewable energies (chapter
7).
Recent trends in energy intensity in countries and regions
A sector’s energy use, divided by gross domestic product
(GDP), is the starting point for understanding differences in the efficient use
of final energy by sector, country, or period. With few exceptions, such
analyses have been carried out over long periods only in OECD countries (IEA,
1997a; Morovic and others, 1989; Diekmann and others, 1999). These ratios are
instructive for what they say about energy use in different economies at a given
point in time. They can also be used to measure changes in energy efficiency and
other components of energy use - such as changes in the structure and
consumption of a given sector or subsector. Changes in energy efficiency are
driven by higher prices, technical improvements, new technologies, cost
competition, and energy conservation programmes.
|
More efficient energy use
is one of the main options
for
achieving global sustainable
development in the
21st century. |
OECD countries
Over the past 30 years every OECD country and region saw a sharp
decline in ratios of energy to GDP (figure 6.2; box 6.1).1 Changes in
energy use were distributed unevenly among sectors, however, and only part of
the decline was related to increased energy efficiency:
· Industry
experienced the largest reductions in ratios of energy to GDP - between 20 and
50 percent. Energy efficiency (if structural change is excluded by holding
constant the mix of output in 1990) increased by more than 1 percent a year
through the late 1980s, after which lower fuel prices caused a slowdown in
improvements (Diekmann and others, 1999). In Japan, the United States, and West
Germany the absolute demand for energy by industry dropped about 10 percent
because of changes in the mix of products. In other countries structural changes
had little impact on energy use.
· Among households, energy
requirements per unit of floor area fell modestly, led by space heating. Despite
far more extensive indoor heating (with more central heating), in almost all
OECD countries energy use was lower in the 1990s than in the early 1970s. (The
only notable exception was Japan, where income-driven improvements in heating
outweighed savings from added insulation in new buildings and from more
efficient heating equipment.) In addition, in most countries the unit
consumption of appliances (in kilowatt-hours per year) fell. Increased
efficiency outpaced trends towards larger appliances. On the structural side,
however, household size continued to shrink, raising per capita energy use. New
homes had larger areas per capita and more appliances, continuing an income
effect dating from the early 1950s.
· Space heating in the service
sector also required less energy - in heat per square metre - in most OECD
countries. Electricity use remained closely tied to service sector GDP, but
showed little upward trend except where electric heating was important. This
outcome may be surprising given the enormous importance of electrification and
office automation in the service sector. Over time there is a close relationship
between electricity use and floor area.
· In passenger transportation,
energy use is dominated by cars and in a few countries (such as the United
States) by light trucks. In Canada and the United States in the early 1990s fuel
use per kilometre by light-duty vehicles was 30 percent below its 1973 level,
though by 1995 reductions had ceased (figure 6.3). Reductions ceased relative to
person-kilometres because there were only 1.5 people per car in the mid-1990s,
compared with more than 2.0 in 1970. Europe saw only small (less than 15
percent) reductions in fuel use per kilometre by cars, almost all of which were
offset by a similar drop in load factors. Taxes on gasoline and diesel seem to
be the main influence on the average efficiency of the car fleet, with the
lowest taxes in the United States (averaging $0.10 a litre) and the highest in
France ($0.74 a litre). For air travel, most OECD countries experienced more
than a 50 percent drop in fuel use per passenger-kilometre due to improved load
factors and increased fuel efficiency. Higher mobility per capita and shifts
from trains, buses, and local transport towards cars and air travel, however,
counterbalanced the efficiency gains in most countries.
· Freight transport experienced
rather small changes in energy use per tonne-kilometre. Improvements in fuel
efficiency were offset by a shift towards trucking. This shift was driven by
higher GDP, less shipping of bulk goods by rail and ship, and more lifting of
high-value partially manufactured and final goods by trucks and
aeroplanes.
FIGURE 6.1. ENERGY CONVERSION
STEPS, TYPES OF ENERGY, AND ENERGY SERVICES: POTENTIALS FOR ENERGY
EFFICIENCY
Potential improvements in energy efficiency are
often discussed and focused on energy-converting technologies or between the
level of final energy and useful energy. But one major potential of energy
efficiency, often not strategically considered, is realised at the level of
energy services by avoiding energy losses through new technologies. Such
technologies include new building materials and window systems, membrane
techniques instead of thermal separation, sheet casting instead of steel
rolling, biotechnology applications, and vehicles made of lighter materials such
as plastics and foamed metals. Energy storage and reuse of break energy, along
with better designs and organisational measures, can also increase energy
efficiency.
In most OECD countries energy intensities fell less rapidly in
the 1990s than before. One clear reason - besides higher income - was lower
energy prices since 1986 and lower electricity prices (due to the liberalisation
of the electricity market in many OECD countries), which slowed the rate of
energy efficiency improvement for new systems and
technologies.
Eastern Europe and the Commonwealth of Independent States
Relative to OECD countries, the statistical basis for ratios of
energy to GDP is somewhat limited in Eastern Europe and the Commonwealth of
Independent States.3 Ratios of primary energy demand to GDP have
risen in the Commonwealth of Independent States since 1970 (Dobozi, 1991) but
began to decline in many Eastern European countries in the mid-1980s (table
6.1). General shortcomings of central planning, an abundance of energy resources
in some countries, a large share of heavy industries, low energy prices, and a
deceleration of technological progress have been the main reasons for limited
progress (Radetzki, 1991; Dobozi, 1991; Sinyak, 1991; Gritsevich, 1993).
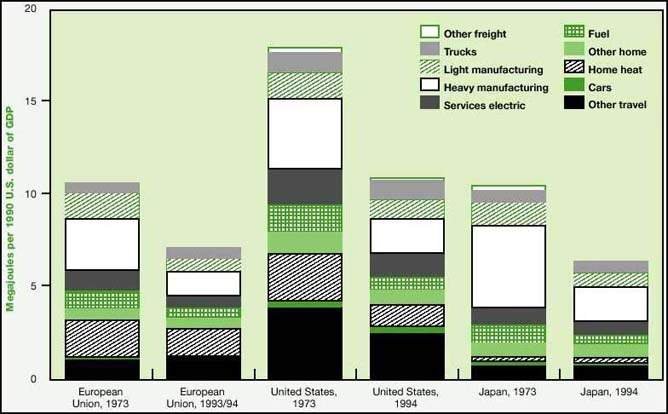
FIGURE 6.2. RATIOS OF ENERGY TO
GDP IN OECD COUNTRIES BY END USE, 1973 AND 1994
Note: Measured using purchasing power parity.
Source: Schipper, 1997.
|
BOX 6.1. DRIVERS OF LOWER ENERGY DEMAND: DEMATERIALIZATION,
MATERIAL SUBSTITUTION, SATURATION, AND CHANGING BEHAVIOUR
Like ratios of energy to GDP, the production of energy-intensive
materials per unit of GDP is falling in almost all industrialised countries
(with a few exceptions such as Australia, Iceland, and Russia). Changes in the
production of basic materials may affect changes in ratios of energy to GDP. In
many OECD countries declining production of steel and primary aluminium is
supporting lower ratios of energy to GDP. But production of young,
energy-intensive materials - such as polymers substituting for traditional steel
or aluminium use - is increasing relative to GDP. In addition, ratios of
energy-intensive materials to GDP are increasing slightly in developing
countries, almost balancing out the declines in industrialised countries for
steel and primary aluminium over the past 25 years.
Dematerialization has different definitions covering the
absolute or relative reduction in the quantity of material used to produce a
unit of economic output. In its relative definition of tonnes or volumes of
material used per unit of GDP, dematerialization has occurred over several
decades in many industrial countries. This shift has contributed to structural
changes in industry - particularly in energy-intensive areas such as chemicals
and construction materials (Carter, 1996; Jaenicke, 1998; Hinterberger, Luks,
and Schmidt-Bleek, 1997).
A number of forces are driving dematerialization in
industrialised countries (Ayres, 1996; Bernadini, 1993):
· As incomes rise,
consumer preferences shift towards services with lower ratios of material
content to price.
· As economies mature, there is
less demand for new infrastructure (buildings, bridges, roads, railways,
factories), reducing the need for steel, cement, non-ferrous metals, and other
basic materials.
· Material use is more efficient
- as with thinner car sheets, thinner tin cans, and lighter paper for print
media.
· Cheaper, lighter, more
durable, and sometimes more desirable materials are substituted - as with the
substitution of plastics for metal and glass, and fibre optics for copper.
· Recycling of energy-intensive
materials (steel, aluminium, glass, paper, plastics, asphalt) contributes to
less energy-intensive production. Recycling may be supported by environmental
regulation and taxes (Angerer, 1995).
· Reuse of products, longer
lifetimes of products (Hiessl, Meyer-Krahmer, and Sch�n, 1995), and intensified
use (leasing, renting, car sharing) decrease new material requirements per unit
of service.
· Industrialised countries with
high energy imports and energy prices tend to decrease their domestic production
of bulk materials, whereas resource-rich developing countries try to integrate
the first and second production steps of bulk materials into their domestic
industries (Cleveland and Ruth, 1999).
But industrialised countries are also experiencing some of the
drivers of increased material use per capita. Increasing urbanisation, mobility,
and per capita incomes increase the demand for material-intensive
infrastructure, buildings, and products. Smaller households, the increasing
importance of suburban communities and shopping centres, and second homes create
additional mobility. The move from repair to replacement of products and trends
towards throwaway products and packaging work against higher material
efficiencies - and, hence, against energy efficiency and sustainable
development.
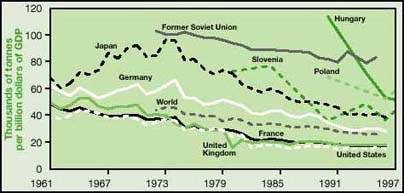
Steel production intensity in
various countries, 1961-96
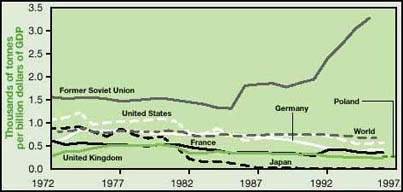
Primary aluminium production
intensity in various countries, 1972-96
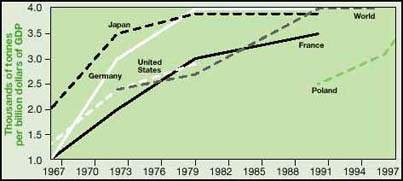
Polymer production intensity in
various countries, 1966-97
Note: For the world, includes all plastics. For
France, Germany, Japan, and the United States, includes only polyethylene,
polypropylene, polystyrene, and
polyvinylchloride.
Source: UN, 1999; German Federal
Statistical Office; IEA 1998. |
Ratios of primary energy to GDP have gone through two phases in
these countries, separated by the onset of economic and political reform in the
late 1980s and the 1990s. Whereas the ratio increased in Russia, it declined in
Armenia, Belarus, Estonia, Kyrgyzstan, Latvia, and Tajikistan. Among the other
members of the Commonwealth of Independent States the ratio fluctuated for
reasons other than improvements in energy efficiency (IEA, 1997a, 1998). Since
1990 the ratio has declined in most Eastern European countries (see table 6.1).
· In industry, final
energy consumption per unit of output fell less than 1 percent a year in Eastern
Europe in 1990-97 but increased almost 7 percent a year in Russia (CENEf, 1998).
· Transportation saw few changes
in energy use per passenger-kilometre or tonne-kilometre for the two main modes,
cars and trucks.
· Among households, small gains
in the thermal integrity of buildings could not overcome increasing demands for
heating and comfort. Indeed, in the mid-1980s centrally heated Eastern European
buildings required 50-100 percent more final energy per unit of area and per
degree day (that is, using standardised winter outdoor temperatures) than
similar buildings in Western Europe. Moreover, home appliances were often small
and inefficient.
In the early 1990s economic reforms began to restructure
production and consumption patterns and raise once-subsidised energy prices. In
the Baltics, the Czech Republic, Hungary, and Poland this phase led to real
declines in ratios of primary energy to GDP as efficiency increased and the
structure of manufacturing changed (see table 6.1). Several transition economies
also saw lower household fuel use for space and water heating. Such changes were
often not related to efficiency, however, and were instead caused by energy
shortages, higher energy prices, and related changes in heating behaviour.
Overall, transition economies showed a remarkable contraction in
energy use by industry, mostly because of structural changes (Bashmakov, 1997a).
But this trend has nearly been outweighed by rapid growth in road transportation
and (in some countries) in electricity for appliances and services. Structural
changes in industry, integration with global markets, and investments in new
processes, buildings, and infrastructure are expected to improve energy
efficiency considerably over the next 20 years. These trends will likely help
stabilise energy demand despite rising incomes and GDP in these countries.
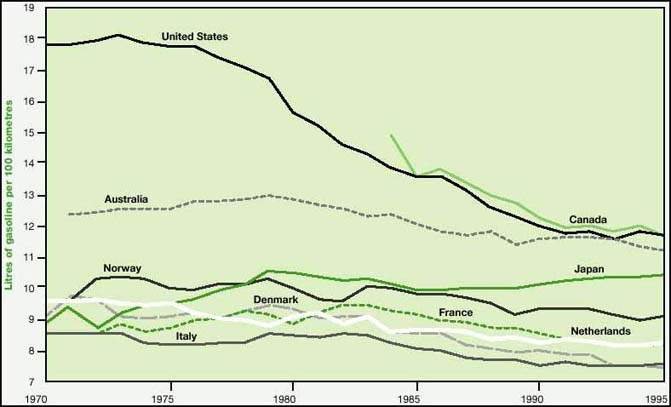
FIGURE 6.3. WEIGHTED AVERAGE OF
ON-ROAD AUTOMOBILE GASOLINE AND DIESEL FUEL INTENSITIES IN OECD COUNTRIES,
1970-95
Source: Schipper,
1997.
Developing Asia, Africa, and Latin America
In many developing countries energy use will be driven by
industrialisation, urbanisation, increasing road transportation, and increasing
personal incomes.4 Indeed, per capita energy use in developing
countries tends to be higher where per capita incomes are higher (in purchasing
power parity terms), as in Latin America, India, and Southeast Asia. Wide income
disparities in many developing countries are also reflected in energy
consumption patterns. Often a small portion of the population accounts for most
commercial energy demand. Data limitations hamper careful analysis in many
developing countries, however.
Higher-income developing countries (per capita income
above $1,200 in 1998 purchasing power parity terms). Energy demand in industry
has fallen in most higher-income developing countries, both as a result of
higher energy prices in the 1970s and 1980s and open borders to international
competition. China has shown the most dramatic developments, but most Latin
American and other Asian economies have also shown energy intensity improvements
in this sector. In recent years many manufacturers in industrialised nations
have moved energy-intensive industries to developing countries, often to take
advantage of cheaper labour, less stringent environmental regulation, and lower
overhead and transportation costs. Many of these countries (Brazil, China,
India, Indonesia) also need their own basic product industries.
TABLE 6.1. RATIOS OF PRIMARY ENERGY TO GDP IN TRANSITION
ECONOMIES, 1985-96
|
Region/country |
Energy consumption per capita, 1996 (gigajoules) |
Megajoules per unit of GDP (1990 purchasing power parity
dollars) |
|
|
1985 |
1990 |
1995 |
|
Commonwealth of Independent States |
135 |
29.8 |
29.4 |
41.4 |
|
Belarus |
100 |
|
|
20.5 |
|
Russia |
170 |
|
|
36.8 |
|
Ukraine |
127 |
|
|
45.2 |
|
Eastern Europe |
89a |
23.9 |
21.8 |
20.9 |
|
Bulgaria |
120 |
36.0 |
29.7 |
31.8 |
|
Czech Republic |
165 |
23.6 |
19.6 |
18.2 |
|
Hungary |
108 |
18.3 |
16.5 |
16.3 |
|
Poland |
117 |
26.5 |
21.6 |
19.2 |
|
Romania |
84 |
28.5 |
31.8 |
25.1 |
|
Sloveniab |
124 |
|
12.6 |
13.8 |
|
Former Yugoslavia |
53a |
12.6 |
14.7 |
21.4 |
a. Data are for 1995. b. Based on exchange rates.
Source: IEA, 1997a, Kos, 1999.
TABLE 6.2. RATIOS OF PRIMARY ENERGY TO GDP IN DEVELOPING
COUNTRIES, 1975-95
|
Country or region |
Energy consumption per capita, 1996 (gigajoules) |
Megajoules per unit of GDP (1990 purchasing power parity
dollars) |
|
|
1975 |
1980 |
1985 |
1990 |
1995 |
|
China |
36.3a |
23.4 |
22.6 |
17.3 |
15.0 |
10.9 |
|
India |
14.6a |
7.5 |
7.8 |
8.3 |
8.7 |
9.2 |
|
Indonesia |
18.4 |
3.3 |
4.2 |
4.6 |
5.4 |
5.4 |
|
Argentina |
64.1 |
8.0 |
8.4 |
9.2 |
9.6 |
9.6 |
|
Brazil |
61.0a,b |
4.6 |
4.6 |
5.0 |
5.4 |
5.9 |
|
Mexico |
61.4 |
7.2 |
8.2 |
8.5 |
8.7 |
8.7 |
|
Venezuela |
94.0a |
10.5 |
11.3 |
12.6 |
12.1 |
12.1 |
|
North Africac |
29.2 |
5.4 |
6.3 |
7.9 |
8.8 |
9.4 |
|
Southern Africad |
27.4 |
10.8 |
11.6 |
15.2 |
13.9 |
14.4 |
|
Rest of Africa |
2.5 |
2.6 |
2.9 |
2.6 |
2.6 |
2.9 |
|
Middle East |
80.4 |
8.4 |
10.9 |
17.6 |
20.9 |
22.6 |
a. Data are for 1996. b. Includes non-commercial
energy. c. Ratios of energy to GDP are for Algeria, Egypt, Libya, Morocco, and
Tunisia. d. Ratios of energy to GDP are for Nigeria, South Africa, Zambia, and
Zimbabwe.
Source: EC, various years; IEA, 1998.
Household appliances, cookers, and water heaters have become
more energy efficient in higher-income developing countries. But the rapid
acquisition of household devices has far outpaced the impact of greater
efficiency.
A similar trend has occurred in the service and public sectors.
Buildings in warm higher-income developing countries have increasing rates of
air conditioning. Higher lighting levels, increased office automation, and other
developments have also contributed to rapidly rising electricity use in this
sector (IEA, 1997b).
Transportation accounts for a rising share of energy use in
higher-income developing countries. Growing numbers of vehicles, often rising at
1.5 times the rate of GDP growth, have dominated the transportation energy use
picture. Many cars and light trucks sold in the developing world have become
less fuel intensive. But increased urbanisation and traffic congestion and
reduced occupancy have eaten up many of the improvements in vehicle technology.
Overall, more efficient manufacturing does not dominate the
increase in ratios of primary energy to GDP in higher-income developing
countries (Argentina, Brazil, India, Mexico). Increasing numbers of cars and
trucks, electrification of rural areas, and increased energy use by households
have played a bigger role (table 6.2). Such energy uses were hardly mature
before the 1970s. Motor vehicles and household appliances were far more
expensive, in real terms, than they are today. Today such items are less costly
and, more important, are often made in developing countries. (China is an
exception to this pattern. In 1978, when it initiated economic reform, China
exploited economies of scale in manufacturing - such as steel-making - to
realise high efficiency improvements in industry and energy.)
Lower-income developing countries (per capita income
below $1,200 in 1998 purchasing power parity terms). The situation in
lower-income developing countries is somewhat different.
· When disposable
income increases, energy consumption by households in low-income developing
countries shifts from traditional to commercial fuels. This trend has
significant implications for energy efficiency in households. Since the
technical efficiencies of cooking appliances using commercial fuels are higher
than those of biomass, composite energy consumption per household tends to fall.
A typical example is the move from a fuelwood stove with a technical efficiency
of 12-18 percent to a kerosene stove with an efficiency of 48 percent, or to a
liquefied petroleum gas stove with an efficiency of 60 percent. On the other
hand, the substitution of commercial for traditional fuels raises ratios of
energy to GDP, because traditional energy is typically not included when such
ratios are calculated. In addition, electrification in rural areas and
increasing income and mobility in urbanising areas increase energy use.
· Most of the technology used by
industry in lower-income developing countries is imported from industrialised
countries. Thus these industries should continue to benefit from technological
improvements that promote rational energy use (see below). While this is
expected to make energy demand fall, the use of obsolete and energy-inefficient
technology imported from industrialised countries will drive the specific energy
demand of industry.
· Similarly, the transportation
sector should benefit from the global trend towards improving vehicle fuel
efficiency. Because lower-income developing countries import vehicles from other
countries, the energy intensity of road transport should decrease. But the large
share of used vehicles imported by lower-income developing countries is helping
to maintain a relatively old car stock with high specific fuel
demand.
|
In many developing countries energy
use will be driven by
industrialisation,
urbanisation, increasing road
transportation, and
increasing
personal incomes. |
Energy intensity in lower-income developing countries will
largely depend on the interplay between these factors. Although available data
(which are patchy at best) show that, for example, Africa’s ratio of energy
to GDP increased by 1.8 percent a year in 1975-95, that trend may be
substantially influenced by the substitution of commercial for non-commercial
forms of
energy.
Potential benefits of technology transfer
In many cases used factories, machines, and vehicles from
industrialised countries are transferred to developing or transition economies,
saddling them with inefficient equipment and vehicles for many years.5
The transfer of energy-efficient equipment and vehicles to developing and
transition economies offers an important opportunity for leapfrogging the
typical development curves of energy intensity and for achieving sustainable
development while maximising know-how transfer and employment opportunities. The
transfer of energy-efficient technology represents a win-win-situation for the
technology provider and the recipient. Benefits on the receiving end include
reduced energy imports, increased demand for skilled workers, job creation,
reduced operating costs of facilities, and faster progress in improving energy
efficiency. The scope for improving energy efficiency through technology
transfer can be seen by comparing energy uses in various industries and
countries (table 6.3).
TABLE 6.3. FINAL ENERGY USE IN SELECTED INDUSTRIES AND
COUNTRIES, MID-1990S (GIGAJOULES PER TONNE)
|
Country |
Steel |
Cement |
Pulp and paper |
|
India |
39.7 |
8.4 |
46.6 |
|
China |
27.5-35.0 |
5.9 |
|
|
United States |
25.4 |
4.0 |
40.6 |
|
Sweden |
21.0 |
5.9 |
31.6 |
|
Japan |
17.5 |
5.0 |
|
Source: Lead authors.
Used equipment and vehicles are traded for lack of capital, lack
of life-cycle costing by investors, the investor-user dilemma (see below), and
lack of public transportation in developing countries (President’s
Committee of Advisors on Science and Technology, 1999, p. 4-3; IPCC, 1999b).
Thus high efficiency standards for products, machinery, and vechicles in OECD
countries will also affect standards in developing and transition economies,
particularly for mass-produced and tradable products and for world-wide
investments by global players. Opportunities for technology transfer among
developing countries will also become more important and should be encouraged.
Many of these countries already have well-established domestic expertise and
produce goods, technologies, and services suitable for the conditions and
climates of other developing
countries.
Transition economies
About 40 percent of the fuel consumed in transition economies is
used in low-temperature heat supply. Slightly less than half of that heat is
directed by district heating systems to residential buildings, public services
(schools, kindergartens, hospitals, government agencies), and commercial
customers (shops and the like). District heating systems exist in many cities
containing more than 20,000 people. In many transition economies a significant
share of the building stock (about 20 percent in Hungary) was built using
prefabricated concrete panels with poor heat insulation and air infiltration.
Advanced Western technology (automated heat distribution plants,
balancing valves, heat mirrors, efficient taps, showerheads, heat-reflecting
layers of windows) offers significant potential for more efficient heat use in
buildings (Gritsevich, Dashevsky, and Zhuze, 1997). Such technology can save up
to 30 percent of heat and hot water and increase indoor comfort. Among the main
advantages of Western products are their reliability, efficiency, accuracy,
design, and sometimes competitive prices. Some Western companies have launched
joint ventures with Eastern European, Ukrainian, and Russian partners or created
their own production lines using local workers. In many cases this seems to be a
better option than imports, because underemployed factories and human capital
may otherwise induce conflicts of interest.
Many transition economies have developed advanced
energy-efficiency technology (powder metallurgy, variable-speed drives for
super-powerful motors, fuel cells for space stations, plasmic technologies to
strengthen working surfaces of turbine blades). Thus the greatest benefits can
be gained when domestic technology and human capital and an understanding of
local conditions are combined with the best Western technology and
practices.
Developing countries
|
Many developing countries do not
have the infrastructure
needed
to study and evaluate all the
technological options that
might
suit their needs. |
Despite the many positive implications of transferring
energy-efficient technology, some major issues need to be addressed to fully
exploit the potential benefits to developing countries (UNDP, 1999):
· Proper
technology assessment and selection. The technology transfer process must
help user enterprises evaluate their technological options in the context of
their identified requirements (TERI, 1997a). Developing countries are at a great
disadvantage in selecting technology through licensing. Companies develop
technology mainly to suit their current markets; technology is not necessarily
optimised for the conditions in recipient countries. Many developing countries
do not have the infrastructure needed to study and evaluate all the
technological options that might suit their needs. Moreover, an enterprise
trying to sell a technology to a developing country will rarely give complete
and unbiased advice. So, there is an urgent need to develop an information
support system and institutional infrastructure to facilitate the selection of
appropriate technologies. In India, for example, a Technology Development Board
was established in 1996 to facilitate the assimilation and adaptation of
imported technology (CMIE, 1997).
· Adaptation and absorption
capability. Technology transfer is not a one-time phenomenon. The
transferred technology needs to be updated from time to time, either
indigenously or through periodic imports. Moreover, lack of local capability can
result in the transferred technology seldom reaching the designed operational
efficiency, and often deteriorating significantly. This raises the need for
local capacity building to manage technological change. In a narrower sense,
this could be facilitated by policies requiring foreign technology and
investment to be accompanied by adequate training of local staff
(President’s Committee of Advisors on Science and Technology, 1999).
· Access to state-of-the-art
technology and to capital. In many cases transferred technology is not state
of the art, for several reasons. First, enterprises in industrialised countries
need to recover the costs of technology development before transferring the
technology to other countries, introducing a time lag in the process. Second, in
some developing countries there is a demand lag for the latest technology due to
factors such as lack of capital or trained staff. Third, there are inappropriate
technology transfers because of the higher costs of acquiring state-of-the-art
technology. A lack of capital and strong desire to minimise investment costs
have often led developing countries to import obsolete used plants and
machinery.
· The problems of small and
medium-sized enterprises. Small industrial enterprises account for a large
share of energy and technology use in many developing countries. These
enterprises may play an important role in the national economy but generally
remain isolated from or ignorant of the benefits of technology upgrading. For
such enterprises, where off-the-shelf solutions are seldom available, knock-down
technology packages from industrialised countries are rarely possible. An
important element of technology transfer for this group is proper competence
pooling to arrive at appropriate technology solutions.
Again, the situation differs between higher- and lower-income
developing countries. Several countries in Latin America and Southeast Asia are
producing highly efficient technology and vehicles - electrical motors,
refrigerator compressors, cars - through local companies or subsidiaries of
multinational companies. Control systems, super-efficient windows, and new
materials that improve the thermal insulation of buildings may offer further
opportunities for technology transfer to higher-income developing countries
(Hagler Bailley Services,
1997).
Types of potential for increased energy efficiency
As noted, the global energy efficiency of converting primary to
useful energy is estimated to be 37 percent.6 But the useful energy
needed for a desired energy service will likely fall. Estimated improvements are
based on known technologies, expected costs, consumer behaviour, market
penetration rates, and policy measures. When considering the potential for
increased energy efficiency, it is essential to distinguish between several
types of potential, each describing future technological achievements with
different time horizons and boundary assumptions (as well as level of analysis
in the case of economic potential). This report uses the following definitions
(Enqu�te Commission, 1991; IEA; 1997a; figure 6.4):
· The theoretical
potential represents achievable energy savings under theoretical considerations
of thermodynamics where energy services (such as air conditioning and steel
production) are kept constant but useful energy demand and energy losses can be
minimised through process substitution, heat and material reuse, and avoided
heat losses (see section below on theoretical potentials after 2020).
· The technical potential
represents achievable energy savings that result from implementing the most
energy-efficient commercial and near-commercial technology available at a given
time, regardless of cost considerations and reinvestment cycles. This can be
expressed as a phased-in potential that reflects the total replacement of
existing energy-converting and -using capital stocks.
· The market trend potential -
or expected potential - is the efficiency improvement that can be expected to be
realised for a projected year and given set of boundary conditions (such as
energy prices, consumer preferences, and energy policies). The market trend
potential reflects obstacles and market imperfections that keep efficiency
potentials from being fully realised (see the section below on
obstacles).
· The economic
potential is the energy savings that would result if during each year over the
time horizon in question, all replacements, retrofits, and new investments were
shifted to the most energy-efficient technologies that are still cost-effective
at given energy market prices. It also includes all organisational measures such
as maintenance, sensitive operation and control, and timely repairs. The
economic potential has subdefinitions depending on the economic perspective
being used: the business (or project) perspective, the macroeconomic
perspective, or the societal (or welfare-based) perspective (box 6.2). The
economic potential implies a well-functioning market, with competition between
investments in energy supply and demand. It also assumes that the barriers to
such competition have been corrected by energy policies. It is assumed that as a
result of such policies, all users have easy access to reliable information
about the cost-effectiveness and technical performance of existing and emerging
options for energy efficiency. The transaction costs for individual investors,
and the indirect costs of policies associated with implementing these options,
are assumed to have been lowered to their irreducible minimum.
· The societal (or
welfare-based) potential represents ‘cost-effective’ savings when
externalities are taken into consideration. These include damage or avoided
damage costs from health impacts, air pollution, global warming, and other
ecological impacts, as well as energy-related occupational accidents that accrue
to society. This wider definition of cost-effectiveness is the most important
for a holistic energy policy that includes energy security and environmental
quality (OTA, 1993).
· Finally, the policy-based
achievable potential represents the energy savings that can be realised with
various policy instruments or packages of policy instruments. Here field data
are used to estimate participation rates and per participant savings in
voluntary or standards-based technology programmes. The policy-based achievable
potential lies between the market trend potential and the economic potential
(which can be influenced by energy taxes).
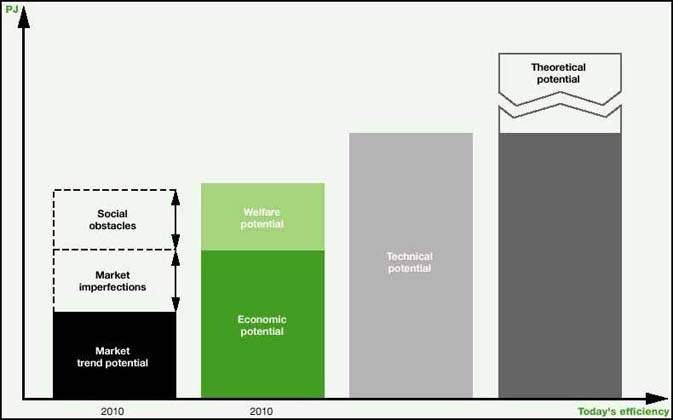
FIGURE 6.4. THEORETICAL,
TECHNICAL, ECONOMIC, AND MARKET TREND POTENTIALS OF ENERGY EFFICIENCY
Source: Enqu�te Commission,
1991.
|
BOX 6.2. DIFFERENT PERSPECTIVES ON THE ECONOMIC POTENTIAL
OF ENERGY EFFICIENCY
In all definitions of the economic potential of energy
efficiency, the core cost-effectiveness test is the life-cycle cost of providing
a given level of energy services. Different definitions of the economic
potential arise because of different cost-benefit perspectives. These
perspectives influence how costs and financial parameters are defined and
whether policy-dependent implementation costs or reductions in external costs
are included.
The economic potential at the business level is calculated from
the perspective of an individual investor based on engineering and economic
life-cycle costs, using a financial perspective. In this narrowest of all
definitions, total costs consist of the levelised capital costs of energy
efficiency investments plus changes in annual energy and non-energy operation
and maintenance costs. Neither the costs of large-scale policy implementation
nor the cost savings from policy-induced feedback effects are attached to this
potential. The discount rate for evaluating the cost-effectiveness of energy
efficiency investments is typically set to reflect the costs of capital of
particular sectors, industries, or households. After-tax energy efficiency
investments are compared to after-tax average energy prices as projected for
each sector or group of energy users.
The macroeconomic potential is based on a more comprehensive
accounting of costs and on a different financial perspective. Here the
administrative costs of implementing various required policies are included. In
addition, energy efficiency investment costs and policy implementation costs are
corrected in a forward-looking manner to account for changes in manufacturer
pricing strategies, economies of scale, and learning effects. |
|
Achieving two benefits of
increased energy efficiency -
positive
economic effects and reduced
environmental burden - is
called
a 'double dividend'. |
This chapter focuses on the economic potential. The economic
perspective underlying the potentials reported here, however, varies by study.
Most current estimates are based on a business (financial) perspective, though
there are also hybrids that use a macroeconomic perspective (see box 6.2).
Quantitative comparisons between business and macroeconomic efficiency
potentials suggest that microeconomic approaches underestimate the
cost-effective savings potential (Krause, 1996). Similarly, macroeconomic
approaches underestimate cost-effective savings potentials relative to a
societal
perspective.
The economic potential of energy efficiency by region and sector
Economic potentials of energy efficiency depend on current and
foreseeable technology developments and on current and anticipated energy prices
(box 6.3). In a world of low energy prices, the potential is relatively small.
But high energy prices could be achieved through energy taxes at a national,
regional, or global level. The economic potential presented below for each
region is based on the energy prices assumed in the literature. Calculations of
the economic potential of energy efficiency cover different technologies:
· The potential of
mono-functional and concise energy-converting technology (boilers, heat
exchangers, electrical motors) is usually determined by standard profitability
calculations comparing the full costs of alternative and statistically relevant
conversion technology.
· Process substitution and new
building concepts or transportation systems include other changes in economic
efficiency (capital, labour, and so on) and in product or service quality. Here
it becomes difficult to talk about the profitability of the technology in the
narrow sense of energy efficiency if the new, higher-efficiency technology is
considered competitive in the broader sense (as with new catalysts in the
production of petrochemicals, separation by membranes instead of
energy-intensive distillation, or low-energy houses instead of conventional
houses).
· Branch-specific but
technology-clustered energy efficiency potentials of low energy-intensive
sectors in industry or the commercial sector are estimated by trend
extrapolation of statistical data or by generalisation of calculations made for
representative or typified plants or factories. To avoid misinterpretation, data
on branch-specific energy efficiency potentials should not include intrabranch
structural changes (such as a shift of high value added but low energy-intensive
pharmaceuticals to higher shares of total value added in the chemical
industry).
These different cost assessments may help explain the
differences in certainty about the economic potentials cited below. The data on
economic potentials provide projections for 2010 and 2020. This means that where
reinvestment cycles last more than 20 years (as with buildings, public
transport, and plants of basic product industries), the economic potentials are
only partly realised by 2020. The sectors and technological areas discussed in
this section were chosen based on the relevance of the efficiency technology and
the availability of the literature for the region or country considered.
Deviations from a given economic potential reflect changes in
energy prices, economies of scale, or local differences. In many cases the
life-cycle cost functions have rather broad minima (such as optimal insulation
thickness), which means that there is little risk of overinvesting in energy
efficiency or of overestimating the cited
potentials.
Western Europe
Industry. Until the early 1990s industry was the largest
consumer of final energy in Western Europe.8 But despite production
growth of about 2 percent a year, the final energy demand of Western European
industry has hovered near 11,500 petajoules for the past 20 years. Yet industry
still holds substantial economic efficiency potential, even in energy-intensive
sectors where investment has focused on efficiency improvements to lower high
energy costs (Phylipsen, Blok, and Worrell, 1998).
· De Beer (1998, pp.
75-102) estimates that by 2020 paper mills operating with new pressing and
drying techniques, latent heat recovery systems, and a number of minor
improvements (closed water circulation, graduated heat recovery) will have 50
percent lower specific heat demand and that investment costs may be lower than
for conventional paper-making (table 6.4). The economic efficiency potential of
steel-making is less extraordinary, between 13 and 20 percent, and results from
thin slab casting, more efficient blast furnaces, and minor improvements in the
oxygen steel process by 2020 (Jochem and Bradke, 1996). Similar economic
efficiency potential has been described for refineries (Refining Processes,
1998), petrochemical processes (Patel, 1999) and basic organic chemicals (Brewer
and Lopez, 1998), construction materials (Rosemann and Ellerbrock, 1998;
Ottoboni and others, 1998), glass production (ATLAS, 1997), and the food
industry (Jochem and Bradke, 1996).
· For Dutch light industry, the
economic efficiency improvements in 2000 (relative to 1990) are estimated at 30
percent (with a 5 percent discount rate) and 27 percent (with a 10 percent
discount rate; Blok and others, 1996; B�de and others, 1999).
· Baumgartner and Muggli (1996)
evaluated the efficiency improvements of cross-cutting technologies in Swiss
industry. Savings of 15-35 percent were found for electrical and mechanical
drives over the next 10-15 years (Almeida, Bertoldi, and Leonhard, 1997).
Metering, controlling, and optimal regulation can lead to efficiency
improvements of up to 15 percent in most industrial processes. Cogeneration in
Western Europe still holds economic potential, particularly with the midterm
effects of liberalising electricity supply and small cogeneration (ATLAS, 1997;
EC, 1999).
Residential. The economic efficiency potential in heating
of residential buildings depends - besides regional aspects - on the stock of
boilers and their reinvestment cycles, the rate of constructing new buildings,
and the rate of refurbishing existing buildings. Condensing boilers are about 10
percent more energy efficient than a new low-temperature boiler and 15-25
percent more efficient than existing boilers (Ziesing and others, 1999).
Insulation of building elements, highly efficient window systems, and adequately
thick insulation are economic within the cycle of refurbishment (ETSU, 1994).In
new buildings, low-energy houses (those with annual heat demand of 50-100
kilowatt-hours per square metre) are now cost-effective due to better design and
low-cost insulation techniques and window sytems (Altner and others, 1995).
|
BOX 6.3. ECONOMIC BENEFITS OF INCREASED ENERGY EFFICIENCY
IN END USES - THE UNKNOWN DOUBLE DIVIDEND
Energy consumers benefit when profitable energy efficiency
potentials are realised.7 But the economy also benefits, because
saved energy costs can be reallocated, energy imports are replaced (in many
countries) by domestically produced energy-efficient products and (energy)
services, and labour-intensive branches can grow in industry, construction, and
services (instead of capital-intensive energy supply), spurring innovation.
Macroeconomic analyses for Germany and the United States show that policies to
improve energy efficiency and to shift to advanced technology and less
carbon-intensive fuels generate four important benefits for the national economy
(Jochem and Hohmeyer, 1992; Laitner, Bernow, and DeCicco, 1998). Such policies:
· Spur economic
growth to a small degree (by less than 1 percent of the absolute growth rate of
GDP) due to the reallocation of saved energy costs.
· Generate jobs (including
entrepreneurial jobs that foster resourceful, self-sufficient, and satisfied
workers) for the reasons mentioned above. Net employment increases by 40-60 new
jobs per petajoule saved each year.
· Increase exports of
high-technology products. In 1976-92 exports of 12 energy-efficient products
increased more than 50 percent faster than West Germany’s total exports.
· Reduce the environmental and
social costs of energy use that were previously uncounted in market transactions
for fuel. Such costs may be as high as $0.02 per kilowatt-hour of electricity
(Friedrich and Krewitt, 1997) and almost $0.01 per kilowatt-hour of oil product
used, not including the impacts of climate change (Hohmeyer, Ottinger, and
Rennings, 1997).
Achieving two benefits of increased energy efficiency - positive
economic effects and reduced environmental burden - is called a ‘double
dividend’. Unlike many other employment effects of investment, the jobs
created by efficiency investments are not evenly distributed over time. In most
cases they are created during the initial period of investment - when wall
insulation is installed or investments are made in condensing boilers or
high-efficiency window systems. In addition, the regional distribution of net
employment becomes more equitable. Employment in the energy supply sector is
concentrated in urban and industrial areas, while efficiency involves planners,
crafts, trade, and banking in the entire country. |
TABLE 6.4. ECONOMIC ENERGY EFFICIENCY POTENTIALS IN WESTERN
EUROPE, 2010 AND 2020
|
Sector and technological area |
Economic potential (percent)a |
Energy price level assumed |
Base year |
Source |
|
2010 |
2020 |
|
|
|
|
Industry |
|
|
|
|
|
|
Iron and steel, coke ovens |
9-15 |
13-20 |
1994 |
1995 |
Jochem and Bradke, 1996; Ameling and others, 1998 |
|
Construction materials |
5-10 |
8-15 |
1997 |
1997 |
|
|
Glass production |
10-15 |
15-25 |
1997 |
1997 |
ATLAS, 1997 |
|
Refineries |
5-8 |
7-10 |
1995 |
1997 |
Refining Processes, 1998 |
|
Basic organic chemicals |
5-10 |
|
1997 |
1996 |
Patel, 1999; Brewer and Lopez, 1998 |
|
Pulp and paper |
|
50 |
1996 |
1997 |
De Beer, 1998 |
|
Investment and consumer goods |
10-20 |
15-25 |
1994 |
1995 |
Jochem and Bradke, 1996; B�de and others, 1999 |
|
Food |
10-15 |
|
1997 |
1997 |
Jochem and Bradke, 1996 |
|
Cogeneration in industry |
|
10-20 |
1997 |
1997 |
ATLAS, 1997; EC, 1999 |
|
Residential |
|
|
|
|
|
|
Existing buildings |
|
|
|
|
|
|
Boilers and burners |
15-20 |
20-25 |
today’s prices |
1997 |
ETSU, 1994; B�de and others, 1999 |
|
Building envelopes |
8-12 |
10-20 |
today’s prices |
1995 |
Ziesing and others, 1999 |
|
New buildings |
|
20-30 |
today’s prices |
1995 |
Altner, Durr, Michelson, 1995 |
|
Electric appliances |
20-30 |
35-45 |
1997 |
1997 |
GEA, 1995; ECODROME, 1999; Hennicke and others, 1998; Boardman
and others, 1997 |
|
Commercial, public, and agriculture |
|
|
|
|
|
|
Commercial buildings |
10-20 |
30 |
8-13 cts/kWh |
1995 |
Geiger and others, 1999 |
|
Electricity |
10-25 |
20-37 |
4-10 cts/kWh |
1997 |
ECODROME, 1998 |
|
Heat |
|
15-25 |
today’s prices |
1998 |
Zeising and others, 1999 |
|
Public buildings |
|
30-40 |
7-15 cts/kWh |
1992 |
Brechb�hl, 1992 |
|
Agriculture and forestry |
|
15-20 |
today’s prices |
|
Neyer and Strebel, 1996 |
|
Horticulture |
|
20-30 |
today’s prices |
|
Arbeitsgemeinschaft, 1992 |
|
Decentralised cogeneration |
|
20-30 |
today’s prices |
1995 |
Ravel, 1994 |
|
Office equipment |
|
40-50 |
1995 |
1995 |
Aebischer and others, 1996; MACEBUR, 1998; Hallenga and Kok,
1998 |
|
Transportation |
|
|
|
|
|
|
Cars |
25 |
|
today’s prices |
1995 |
IPSEP, 1995 |
|
Door-to-door integration |
4 |
|
|
1995 |
Zeising and others, 1999 |
|
Modal split of freight transport |
|
3b |
|
1995 |
|
|
Trains and railways |
|
20 |
today’s prices |
1999 |
Brunner and Gartner, 1999 |
|
Aircraft, logistics |
15-20 |
25-30 |
today’s prices |
1998 |
IPCC, 1999a |
a. Assumes a constant structure or use of the sector
or technology considered. b. Refers to the final energy use of the entire
sector.
The economic efficiency potential of electric appliances in 2010
is best evaluated by comparing the equipment in use with the equipment available
on the market. But the market is not homogeneous: a survey of washing machines,
dryers, and dishwashers available in the European Union showed minimum:maximum
ratios of specific consumption between 1:2.5 for washing machines and 1:4 for
condenser tumble dryers (GEA, 1995). Initial costs are sometimes higher for
efficient equipment, but life-cycle costs are generally lower. In France a
detailed end-use study showed that electricity savings of 40 percent can be
achieved by replacing average equipment with the most efficient appliances
readily available on the market (Rath and others, 1997; ECODROME, 1998). These
results are confirmed by Hennicke and others (1998) and Ziesing and others
(1999). Given the relatively short lives of lights and appliances, savings of 33
percent could be achieved in the United Kingdom by 2010 with the widespread
adoption of better lights and appliances using known technologies (Boardman and
others, 1997).
Service and public sectors. In 1990 office equipment
consumed just 3-4 percent of the electricity used in Western Europe’s
service sector (Aebischer, Schwarz, and Spreng, 1996). But office equipment is
the fastest-growing consumer of electricity. About two-thirds of this
electricity is used in standby and off modes. Thus easy and cost-effective
savings are possible for most equipment (Hallenga and Kok, 1998; MACEBUR, 1998).
With the fast increase in the amount of office equipment and its short lives,
these improvements could be realised by 2010. Hennicke and others (1998) reports
that 27-35 percent of the electricity consumed by Germany’s service sector
could be saved for $0.043-0.071 a kilowatt-hour.
The economic potential for reducing space and process heat
demand in commercial buildings ranges from 15-25 percent (Ziesing and others,
1999; Aebischer and others, 1996). The efficiency of heat generation and
distribution could be improved by 10-15 percent through reinvestmentsin boilers,
burners, and insulation and control techniques, in some cases by direct process
heat generation (avoiding steam and hot water systems), and by engine-driven
cogeneration.
TABLE 6.5. ECONOMIC ENERGY EFFICIENCY POTENTIALS IN NORTH
AMERICA, 2010
|
Sector and area |
Economic potential (percent) |
Energy price level assumed |
Base year |
Source |
|
United Statesa |
Canada |
|
|
|
|
Industry |
|
|
|
|
|
|
Iron and steel |
4-8 |
29 |
United States: scenario for price developmentsb |
United States: 1995 |
United States: Interlab, 1997; |
|
Aluminium (primary) |
2-4 |
|
|
|
Brown and others, 1998; |
|
Cement |
4-8 |
|
|
|
Romm, 1999 |
|
Glass production |
4-8 |
|
|
Canada: 1990 |
|
|
Refineries |
4-8 |
23 |
Canada: price scenario by provincec |
|
Canada: Jaccard and Willis, 1996; |
|
Bulk chemicals |
4-9 |
18 |
|
|
Bailie and others, 1998 |
|
Pulp and paper |
4-8 |
9 |
|
|
|
|
Light manufacturing |
10-18 |
|
|
|
|
|
Mining |
n.a. |
7 |
|
|
|
|
Industrial minerals |
n.a. |
9 |
|
|
|
|
Residential |
|
|
|
|
|
|
Lighting |
53 |
|
United States: scenario for price developments |
United States: 1995 |
United States: Interlab, 1997; |
|
Space heating |
11-25 |
|
|
|
Brown and others, 1998; |
|
Space cooling |
16 |
|
|
|
OTA, 1992 |
|
Water heating |
28-29 |
|
|
Canada: 1990 |
|
|
Appliances |
10-33 |
|
Canada: price scenario |
|
Canada: Bailie and others, 1998 |
|
Overall |
|
13 |
|
|
|
|
Commercial and public |
|
|
|
|
|
|
Space heating |
48 |
|
United States: scenario for price developments |
United States: 1995 |
United States: Interlab, 1997; |
|
Space cooling |
48 |
|
|
|
Brown and others, 1998 |
|
Lighting |
25 |
|
|
|
|
|
Water heating |
10-20 |
|
|
Canada: 1990 |
Canada: Bailie and others, 1998 |
|
Refrigeration |
31 |
|
Canada: price scenario |
|
|
|
Miscellaneous |
10-33 |
|
|
|
|
|
Overall |
n.a. |
9 |
|
|
|
|
Transportation |
|
|
|
|
|
|
Passenger cars |
11-17 |
|
United States: scenario for price developments |
United States: 1997 |
United States: Interlab, 1997; |
|
Freight trucks |
8-9 |
|
|
|
Brown and others, 1998 |
|
Railways |
16-25 |
|
|
|
|
|
Aeroplanes |
6-11 |
|
|
Canada: 1990 |
Canada: Bailie and others, 1998 |
|
Overall |
10-14 |
3 |
Canada: price scenario |
|
|
a. Industrial energy efficiency potentials in the
United States reflect an estimated penetration potential under different
conditions based on the Interlaboratory Working Group on Energy Efficient and
Low-Carbon Technologies (1997). There are no separate estimates available for
the economic potential. The economic potential under business-as-usual fuel
price developments is estimated at 7 percent in energy-intensive industries and
16 percent in light industries. b. The Inter-Laboratory Working Group study
(1997) used price scenarios for 1997-2010 to estimate the potential for energy
efficiency improvement, based on the Annual Energy Outlook 1997 scenario
(EIA, 1996). The scenario assumes a 1.2 percent annual increase in oil prices
from 1997 levels. c. For comparison; in 2010 light fuel oil prices are $6-8 a
gigajoule at the 1999 exchange rate (Jaccard and Willis Energy Services,
1996).
Transportation. Between 1990 and 2010 final energy use by
transport may increase by 40 percent in Western Europe if no efficiency
potentials are used. About 50 percent of this energy is used by passenger cars
and almost 40 percent by road freight. A voluntary agreement concluded by the
Association of European Car Manufacturers reflects the potential for
energy-efficient car use: in 2008 new cars will be 25 percent more fuel
efficient than in 1995. Using taxes and insurance to internalise the external
costs of road transport, estimated at $20-70 billion, would increase efficiency
by another 7-16 percent.
Relative to road transport, Western Europe’s rail transport
is about 3 times less energy-intensive for passengers and up to 10 times less
energy-intensive for goods. With lighter trains, reduced air drag, and better
drive concepts, the specific electricity consumption of rail transport could
drop almost 50 percent over the next 40 years (Brunner and Gartner, 1999). A 25
percent cut in railway freight tariffs due to increased productivity and
cross-border harmonisation is expected to induce a shift from road to rail,
allowing a 3 percent reduction in final energy use for the transport sector as a
whole. Although aeroplanes and related logistics have substantial efficiency
potential (IPCC, 1999a), it is not expected to compensate for the growth in air
transport
mileage.
North America
North America - defined here as Canada and the United States,
but not Mexico - has higher energy consumption per capita than any other
region.9 Canada and the United States share several characteristics
(large size, low energy prices) but also differ substantially (climate). In both
countries recent studies have assessed the potential for increased energy
efficiency by 2010. In the United States the Interlaboratory Working Group on
Energy-Efficient and Low-Carbon Technologies (1997) assessed the economic
potential for efficiency improvement, while a recent follow-up study assesses
the potential impact of policies. In Canada a study has assessed several
industrial sectors in detail (Jaccard and Willis Energy Services, 1996), while
others have assessed the economic potential of sets of technologies in all
sectors (Bailie and others, 1998; Brown and others, 1998; Faruqui and others,
1990; OTA, 1991). Both countries are assessing policies to address climate
change, and the results may vary from previous studies (table 6.5).
Under the business-as-usual scenario, energy growth in the
United States through 2010 would increase energy demand by 26 percent relative
to 1990. Two other scenarios address, with progressively stronger measures, the
adoption of energy-efficient technologies. The first, the efficiency scenario,
assumes that technology-based reductions in energy and carbon emissions become
cost-effective and so attractive to the marketplace. The second, the
high-efficiency/low-carbon scenario, assumes that the United States makes an
even greater commitment to reducing carbon emissions through federal and state
programs and policies, as well as active private sector involvement. The
high-efficiency/low-carbon scenario assumes that the emission charge is $25 or
$50 per tonne of carbon.
Industry. Because of the complexity of industrial
processes, the Interlaboratory Working Group did not model from the bottom up
using explicit estimates of changes in efficiency expected from the introduction
of energy-efficient technologies. Instead, the group used existing models to
estimate the potential for increased general investment in industrial energy
efficiency, supplemented by examples of a few technologies that have potential
throughout the industrial sector (for example, advanced gas turbines and
efficient motors). The models single out seven energy-intensive industries that
together account for 80 percent of manufacturing energy use. Light manufacturing
is considered a separate category.
Under the business-as-usual scenario, manufacturing grows 2.1
percent a year through 2010, divided between energy-intensive industries (1.3
percent a year) and non-intensive industries (2.6 percent a year). Total energy
intensity is projected to decline by 1.1 percent a year (Interlaboratory Working
Group, 1997).
In the efficiency scenario, industrial energy consumption drops
6.6 percent relative to the business as usual scenario. In the
high-efficiency/low-carbon scenario, consumption falls 12.5 percent. Energy
efficiency improvements are larger in light industry than in heavy manufacturing
because there are more opportunities to adopt energy-efficient-technologies.
Energy is a smaller component of overall manufacturing costs, so there is less
incentive to adopt new technology than in the past. A recent bottom-up study
(Worrell, Martin, and Price, 1999) of energy efficiency potential in the U.S.
iron and steel industry estimates the potential contribution of nearly 50
technologies, and suggests that the potential is twice as high as indicated by
the Interlaboratory Working Group study.
|
Between 1990 and 2010 final
energy use by transport may
increase
by 40 percent in Western Europe,
if no efficiency
potentials
are used. |
Bailie and others (1998) estimate at 8 percent the
cost-effective potential for reducing carbon dioxide (CO2) emissions
through increased energy efficiency in Canadian industry. The authors use high
discount rates to reflect the market rates of time preference.10
Jaccard and Willis Energy Services (1996) estimate the economic and
technical potential for increased energy efficiency in six major industrial
sectors using the same model and a discount rate of 7 percent in assessing the
macroeconomic potential (see box 6.2). They find technical potential in 2010 to
vary by industry from 8 to 38 percent (relative to 1990), while economic
potential varies from 7 to 29 percent. These findings are similar to those for
Western Europe (see table 6.4).
Buildings. In the efficiency scenario, buildings use 36.0
exajoules of energy in 2010, compared with 38.0 exajoules in the business as
usual scenario. The efficiency scenario assumes that by 2010 buildings will have
achieved just over one-third of their cost-effective energy efficiency savings
potential of 15 percent (Interlaboratory Working Group, 1997). Energy services
cost $11 billion a year less than in the business-as-usual scenario. Costs are
lower because the decrease in energy spending that results from installing more
efficient technology is larger than the cost of purchasing and installing this
technology in buildings. The high-efficiency/low-carbon scenario assumes that
nearly two-thirds of the cost-effective energy efficiency savings are achieved
by 2010. The result is a larger drop in energy use, to 33.3 exajoules - or by 13
percent relative to the business-as-usual scenario.
Bailie and others (1998) assume that energy efficiency measures
are implemented in Canadian buildings. While households show moderate economic
potential (13 percent), the economic potential for commercial buildings is
limited (9 percent).11 Although the technical potential is high
(Bailie and others, 1998), the assumed high costs and additional office
automation lead to smaller economic potentials.
Transportation. The business as usual scenario for U.S.
transportation assumes that the passenger car fuel efficiency rate (in litres
per 100 kilometres) will improve from 8.55 in 1997 to 7.47 in 2010. But this
represents a 1.4 percent annual increase in fuel economy, an improvement that
has not been seen in the past without increased fuel mileage standards or higher
oil prices. The business-as-usual scenario also assumes that the fuel efficiency
of light trucks will not increase. The result is an increase in transportation
energy use from 26,000 petajoules in 1997 to 34,000 petajoules in 2010 despite a
10 percent improvement in overall efficiency. Under the efficiency scenario,
transportation energy use is 10 percent lower in 2010. Under the
high-efficiency/low-carbon scenario, it is 14 percent lower (Interlaboratory
Working Group, 1997).
The high-efficiency/low-carbon scenario includes the efficiency
scenario assumptions as well as major breakthroughs in fuel cells for light-duty
vehicles, large gains in the energy efficiency of aircraft, and an optimistic
estimate of the cost of ethanol fuel from biomass. This modelling approach is
very different from that taken for buildings, because of the assumption of
breakthrough technology in transportation.
Bailie and others (1998), however, estimate an extremely low
economic potential for energy efficiency improvement in Canada’s
transportation sector.12 The study concentrates on efficiency
standards for engines but also includes fuel switching. The baseline scenario
assumes large growth in transport demand, dramatically increasing energy demand
in Canada between 1990 and 2010. The study finds a large technical potential for
efficiency improvement, but the costs of the economic potential are prohibitive.
Hence the economic potential is estimated at just 3 percent relative to 2010
baseline energy
use.
Japan and Southeast Asia
The literature on energy efficiency potentials in Japan and
Southeast Asia is somewhat limited (table 6.6).13 Although the region
has a relatively young capital stock, economic efficiency potentials are still
quite high. This is due to intensive technological innovations and relatively
high energy prices (Rumsey and Flanagan, 1995a).
Between 1975 and 1995 primary energy demand more than
quadrupled, shifting the centre of the energy market from the Atlantic Basin to
the Pacific Basin (Fesharaki, 1998). Hence energy efficiency is a paramount
policy objective. The Asia Least Cost Greenhouse Gas Abatement Strategy (ADB,
GEF, and UNDP, 1998) cites cumulative potentials for 2010 and 2020.
Industry. Goto (1996) estimates industrial energy
efficiency improvements through 2010 for several energy-intensive branches in
Japan (see table 6.6). The energy savings for iron and steel range from 10-12
percent, for chemicals from 5-10 percent, for cement production from 2-8
percent, and for pulp and paper from 6-18 percent (box 6.4). For Southeast Asia,
ADB, GEF, and UNDP (1998), IIEC (1995), Adi (1999), Ishiguro and Akiyama (1995),
and the Viet Namese government find that similar savings are possible in 2010
and 2020.
Residential, commercial, and public sectors. The energy
savings potential of residential and commercial uses could be untapped with
various demand-side management programmes for air conditioning, refrigeration,
lighting, and cooling. Some 300-450 petajoules a year could be gained in
Japan’s residential sector by insulating existing buildings within their
reinvestment cycle. IIEC (1995) reports savings of 20-60 percent for electric
appliances.
TABLE 6.6. ECONOMIC ENERGY EFFICIENCY POTENTIALS IN JAPAN
AND SOUTHEAST ASIA, 2010 AND 2020
|
Sector and area |
Economic potential (percent or petajoules a
year)a |
Energy price level assumed (U.S. cents per
kilowatt-hour) |
If percent, base year |
Source |
|
Japan 2010 |
Southeast Asia 2020 |
|
|
|
|
Industry |
|
|
|
|
Japan: Goto, 1996; JISF, 1993 |
|
Iron and steel |
10-12% |
|
0.2 |
1990-95 |
Southeast Asia: Ishiguro and |
|
Cement |
2-8% |
|
2-20 |
1990-95 |
Akiyama, 1995; ALGAS, 1998, |
|
Chemicals |
5-10% |
|
0.4-7.8 |
1990-95 |
IIEC, 1995; Adi 1999; Government |
|
Pulp and paper |
6-18% |
|
1.5-3.3 |
1990-95 |
of Viet Nam; Nguyen |
|
Electric motors |
|
20% |
1998 prices |
1995 |
Thuong, 1998; Aim Project |
|
Total industry |
|
2,017 PJ |
1998 prices |
1998 |
Team, 1994 |
|
Residential |
|
|
|
|
Kaya and others, 1991; IIEC, |
|
Existing buildings |
|
|
|
|
1995; ALGAS, 1998; |
|
50-100 millimetre insulation |
290-450 PJ |
|
2.0-8.5 |
1995 |
Wanwacharakul, 1993 |
|
Electric appliances |
20-60% |
20-60% |
|
|
|
|
Illumination |
20-75% |
20-60% |
|
|
|
|
Commercial and public sectors |
|
|
|
|
IIEC, 1995; ALGAS, 1999 |
|
Buildings 50-100 millimetre insulation |
240-280 PJ |
293 PJ |
2-5 |
1991,92 |
|
|
Transportation |
|
2,275 PJ |
|
1992 |
IIEC, 1995 |
|
Compact cars |
1.8% |
|
0.044 |
1990 |
Japan: Goto, 1996; |
|
Buses |
0.2% |
|
0.196 |
1990 |
Aim Project Team, 1994 |
|
Trucks |
2.8% |
|
0 |
1990 |
|
|
Compact cargo vehicles |
13.7% |
|
0 |
1990 |
|
|
Within cities |
|
|
|
|
|
|
Vehicles |
7% |
|
0.01-0.06 |
1990 |
|
|
Buses, trucks cargo vehicles |
14% |
|
0.01-0.06 |
1990 |
|
|
Passenger cars |
0.3% |
|
0.06 |
1990 |
|
a. Assuming constant structure or use of the sector
or technology considered.
|
BOX 6.4. JAPANESE COMPANIES GO AFTER OPPORTUNITIES
Hitachi city district heating system. Energy displacement
between industry and buildings entails the use of residual heat from a cement
factory for district heating and cooling in Hitachi city covering a total area
of 12.5 hectares. Some 107,000 square metres of floor area will be covered by
the district heating system, with a maximum supply capacity of 8.93 gigawatts of
heat and 11.9 gigawatts of cooling. When the system produces a surplus of heat,
the excess heat is used for electricity production with a 373 kilowatt-hour
generator (Kashiwagi, 1994).
Iron and steel. Efficient ignition of a sintering furnace
for crude steel production is possible through installed segregation equipment,
slit burners, and changes in waste heat recovery - for savings of 56.5
gigajoules a year. Ignition fuel was reduced by 70 percent with a payback period
of 1.6 years at 1986 prices (CADDET, 1997).
Cogeneration. The Jujo Kimberly K.K cogeneration power
plant for a paper mill uses an aeroengine-driven gas turbine with an output of
7,600 kilowatts of electricity and 20 tonnes per hour of steam, meeting 70
percent of the mill’s electricity requirements. The system attains an
overall efficiency of 81 percent, with a payback of four years. Energy costs
were cut 30 percent, and labour costs 20 percent. The space saves confers an
additional economic benefit. |
In the commercial and public sectors the same efficiency
technology would save 240-280 petajoules a year. Mungwitikul and Mohanty (1997)
report electricity savings of 25 percent for office equipment at no additional
cost in Thailand.
Transportation. In 1980-95 transport was the largest
consumer of energy in Japan and Southeast Asia, with annual growth of 8.8
percent (excluding Viet Nam). Transport energy demand is still increasing
because larger vehicles are becoming more popular, while the share of small
vehicles in new car sales fell to 60 percent in 1996. Japanese government policy
is now aiming to introduce the ‘top runner method’, setting efficiency
standards above the performance standards currently achievable in order to raise
vehicle fuel efficiencies. These measures include subsidies for hybrid vehicles,
which double fuel efficiencies. Smaller cars are expected to reduce their fuel
consumption to 3.0-3.6 litres per 100 kilometres, and one car manufacturer plans
to increase efficiency by 25 percent between 1995 and 2005.
Energy policy also attempts to improve the energy efficiency of
trains, ships, and planes, upgrading distribution efficiency by promoting
railroad transportation, coastal shipping, and public transport. A study on an
electric mass transit project under construction in Thailand identified
potential savings of 28 petajoules a year. The savings would come from switching
to diesel fuel in city buses. The introduction of fuel cells in road vehicles
will further improve efficiency after 2010.
TABLE 6.7. ECONOMIC ENERGY EFFICIENCY POTENTIALS IN EASTERN
EUROPE, 2010
|
Sector and area |
Economic potential (percent) |
Energy price level assumed |
Base year |
Source |
|
Industry |
|
|
|
|
|
Pig iron |
3 |
EU, 1995 |
|
Ministry of Industry, Poland, 1990 |
|
Electric steel |
10 |
EU, 1995 |
|
|
|
Hot rolled products |
32 |
EU, 1995 |
|
|
|
Ferrous metallurgy |
24 |
EU, 1995 |
|
|
|
Electrolytic copper |
15 |
EU, 1995 |
|
|
|
Aluminium |
24 |
EU, 1995 |
|
National Energy Agency, Bulgaria, 1998 |
|
Non-ferrous metals |
4 |
EU, 1995 |
|
|
|
Chemical products |
31 |
EU, 1995 |
1995 |
|
|
Synthetic fibres |
12 |
EU, 1995 |
|
|
|
Building materials |
48 |
EU, 1995 |
|
|
|
Cement dry |
16 |
EU, 1995 |
|
|
|
Leather, footwear |
4 |
EU, 1995 |
1995 |
|
|
Timber, wood industry |
5 |
EU, 1995 |
1995 |
|
|
Food industry |
23 |
EU, 1995 |
1995 |
|
|
Machine manufacturing |
22 |
EU, 1995 |
1995 |
|
|
Construction industry |
24 |
EU, 1995 |
1995 |
|
|
Residential |
|
|
|
|
|
Existing stock |
25 |
EU, 1995 |
1995 |
IEA, 1999 |
|
New buildings |
30 |
EU, 1995 |
1995 |
|
|
Electric appliances |
25 |
EU, 1995 |
1995 |
|
|
Commercial/public |
|
|
|
|
|
Heating |
25 |
|
1995 |
IEA, 1999 |
|
Office equipment |
20 |
|
1995 |
|
|
Lighting |
40 |
EU, 1995 |
1995 |
|
|
Agriculture |
|
|
|
|
|
Heating, drying |
22 |
EU, 1995 |
1995 |
IEA, 1999 |
|
Electricity |
15 |
EU, 1995 |
1995 |
|
|
Transportation |
|
|
|
|
|
Cars |
20 |
EU, 1995 |
1995 |
IEA, 1999 |
|
Public transportation, cities |
15 |
EU, 1995 |
1995 |
|
|
Railways |
25 |
EU, 1995 |
1995 |
|
|
Air transport |
22 |
EU, 1995 |
1995 |
|
Eastern Europe
Economic restructuring is playing a decisive role for the energy
system and its efficiency path in Eastern Europe, because the drivers of
economic policy are now totally different from those under central
planning.14 Under communist rule a standing ambition for expansion
led to a very old capital stock with low energy efficiency for basic industries,
buildings, and the energy industry itself. Because the region started the
transition from an extremely weak social and financial position, the economic
crisis - an unavoidable element of large-scale restructuring - influences voters
(Levine and others, 1991).
As a result governments (who wish to remain in power) are often
reluctant to take the restrictive steps needed for economic restructuring in
general and energy pricing in particular. Countries starting from a better
position (Czech Republic, Hungary, Poland, Slovakia, Slovenia) can take the
painful steps earlier. Because statistical systems and aggregation practices
differ considerably among transition economies and future developments are
uncertain, the data on economic efficiency energy potential in table 6.7 should
be viewed only as cautious estimates. The data may be subject to major changes
when more empirical data become available.
Industry. Specific energy consumption and related
efficiency potentials are related to physical production in energy-intensive
industries. The economic potential of other sectors ranges from 4 percent
(leather) to 40 percent (building materials) by 2010 (see table 6.7). Available
data are from climatically and economically different countries (from Bulgaria
to Poland) but most of the figures are similar - reflecting a shared history of
Soviet technology and standards.
Residential. Individual heat metering in multifamily
houses in Eastern Europe represents an energy efficiency potential of at least
15-20 percent. In panel-built housing estates, individual metering of domestic
warm water consumption has already resulted in savings of up to 40 percent where
it has been introduced. A programme to improve thermal insulation in these
buildings began in the mid-1990s with central support. Thus a 20-30 percent
reduction of the heat demand in these buildings can be achieved in the next 10
years.
For 2020 and beyond, specific energy and material demands are
expected to be close to the EU average. Economic and technology development in
Eastern Europe will likely be carried out through the expansion of multinational
companies, integration with the European Union, and globalisation. As a
consequence, by 2020 technologies will be in place that are technically and
economically acceptable and comparable to EU standards. Exceptions will be some
parts of the non-refurbished building stock.
Commercial and public sectors. Improved boilers and
heating systems, insulation, high-efficiency window systems, and new lighting
systems will contribute to substantial savings in the commercial and public
sectors.
Transportation. Although specific energy consumption will
likely fall by at least 1 percent a year, the final energy consumed by road
transportation will substantially increase due to motorization in Eastern
Europe.
Russia and other members of the Commonwealth of Independent States
Members of the Commonwealth of Independent States face very
different climates, domestic energy resources, and levels of industrialisation
and motorisation.15 The last extensive studies of economic energy
efficiency potentials for the former Soviet Union were performed in the early
1990s (WBNSS, 1999). About 120 technologies and energy-saving measures with
potential savings greater than 5.8 petajoules a year were considered, covering
all the sectors and assuming the replacement of technology and equipment in use
at that time with best-practice, world-class technology (CENEf, 1993). Potential
savings were estimated at 21,690 petajoules a year, about 77 percent of which
was considered economical by 2005.
TABLE 6.8. ECONOMIC ENERGY EFFICIENCY POTENTIALS IN RUSSIA
AND UKRAINE, 2010
|
Sector and technological area |
Economic potential (percent or petajoules a year) |
Energy price level assumed |
If percent, base year |
Source |
|
Russia |
Ukraine |
|
Russia |
Ukraine |
|
|
Industry |
3,370-4,980 PJ |
1,430-2,485 PJ |
1990s price levels of Western Europe |
1995 |
1990 |
Russia: Federal Ministry of Fuel and Energy, 1998 |
|
General |
1,524-2,198 PJ |
|
|
1995 |
|
Ukraine: ARENA-ECO, 1997; Vakulko/Zlobin, 1997 |
|
Metallurgy |
733-1,026 PJ |
284-361 PJ |
|
1995 |
1990 |
|
|
Iron and steel, coke ovens |
132-161 PJ |
|
|
1995 |
|
|
|
Construction materials |
440 PJ |
|
|
|
|
|
|
|
Cement |
176 PJ |
|
|
1995 |
|
|
|
|
Refineries |
176-205 PJ |
73-138 PJa |
|
1995 |
1990 |
|
|
Basic organic chemicals |
176-322 PJ |
|
|
1995 |
|
|
|
Pulp and paper |
176-322 PJ |
|
|
1995 |
|
|
|
Investment goods industry |
322-469 PJ |
247-249 PJ |
|
1995 |
1990 |
|
|
Electricity savings |
More than 30% |
|
|
1997 |
|
|
|
Food industries |
|
114-205 PJ |
|
|
|
|
|
Commercial and public sectors and agriculture |
|
|
1995 price levels of European Union |
|
|
Bashmakov, Gritsevich, and Sorokina, 1996; ARENA-ECO, 1997;
Lapir, 1997 |
|
Commercial buildings |
|
|
|
|
|
|
|
Agriculture |
791-879 PJ |
91-138 PJ |
|
1995 |
1990 |
|
|
Horticulture |
Up to 3 times |
|
|
1997 |
|
|
|
Residential |
1,905-2,198 PJ |
475-570 PJb |
1995 price levels of European Union |
1995 |
1990 |
Bashmakov, Gritsevich, and Sorokina, 1996; ARENA-ECO, 1997 |
|
Automated boilers |
20-40% |
|
|
1995 |
|
|
|
Existing building stock |
20-30% |
|
|
1995 |
|
|
|
New buildings |
381-431 PJ |
|
|
1995 |
|
|
|
Hot water supply |
197-276 PJ |
|
|
1995 |
|
|
|
Transportation |
967-1,172 PJ |
290-293 PJ |
1995 price levels of European Union |
1995 |
1990 |
Russia: SNAP, 1999; Russian Federation, Ministry of Transport,
1995 |
|
Trains |
10-15% |
|
|
1997 |
|
|
a. Refineries and chemicals. b. Residential and
commercial sectors.
|
BOX 6.5. MARKET FORCES DRIVE MORE ENERGY-EFFICIENT INDUSTRY
IN THE COMMONWEALTH OF INDEPENDENT STATES
Automated controls introduced in the processing of
petrochemicals reduced electricity consumption per unit of output by 40-65
percent at the Kirishinefteorgsyntez plant in Leningrad oblast. Narrower
fluctuations in technological parameters also increased the lives of electric
motors, valves, and transmitters (Goushin and Stavinski, 1998).
At one of Russia’s largest ferrous metallurgy plants,
Magnitogorski, the energy management department developed and implemented a
programme for energy saving and efficiency that took into account the
plant’s new market environment. The programme focuses on making better use
of internal energy resources. Steam is now used for electric power cogeneration
(26 megawatts), and coke gas is used as a fuel at boilers-utilisers and in the
drying of containers for transporting iron, replacing 19,000 cubic metres of
natural gas (Nikiforov, 1998). |
In 1996 Russia and Ukraine - the two largest members of the
Commonwealth of Independent States - used 83 percent of the region’s
primary energy. The most recent estimate of Russia’s energy efficiency
potential was developed in 1997 (Russian Federation Ministry of Fuel and Energy,
1998). It projects savings of 13,000-15,500 petajoules by 2010; 80 percent of
these savings are expected in the end-use sector. The most comprehensive recent
evaluation of technological and economic potentials for energy efficiency in
Ukraine was undertaken by the Agency for Rational Energy Use and Ecology
(ARENA-ECO, 1997).
Industry. The economic efficiency potential of industry
in 2010 is about 4,000 petajoules a year (table 6.8). This is equal to about 30
percent of the economic efficiency potential of the entire economy, or more than
30 percent of the projected energy demand for 2010. In ferrous metallurgy,
replacing open-heart furnaces with oxygen converters and electric steel furnaces
could save 73-88 petajoules a year (box 6.5). Introducing continuous casting on
greater scale could save 59-70 petajoules a year. Recycling an additional 10
million tonnes of ferrous scrap would save 290 petajoules a year.
In primary aluminium production it is realistic to cut the use
of electric power to 13,200 kilowatt-hours per tonne by using elec-trolysers of
greater capacity and introducing automated control of technological parameters.
In the production of building materials the transfer of cement clinker
production to dry process in the production of bricks and lime and other related
measures may cut energy use by 400 petajoules a year. In the chemical industry,
replacing obsolete with modern technology in the production of ammonia,
olefines, aromates, alcohols, and the like will not only reduce energy intensity
to levels comparable to the best world examples (around 200 petajoules in 2010),
it will also improve the product mix.
According to Vakulko and Zlobin (1997), the main directions for
rational use of electricity in industrial facilities are: installing electricity
metering and control devices, practising power compensation, determining the
optimal number of working transformers, and making efficient use of lighting and
lighting devices, high-efficiency electric drives, electrothermal devices,
welding transformers and units, and converters. Ukraine’s energy efficiency
potential in industry is similar once adjusted for the smaller country, but are
still about 2,000 petajoules a year by 2010 (see table 6.8).
Residential. Better building insulation will reduce heat
losses. Overall, by 2010 Russia could save at least 2,000 petajoules a year in
its residential sector. Ukraine could save 500 petajoules a year (see table
6.8). Typical for Russian households, a 250-360-litre refrigerator consumes
500-600 kilowatt-hours a year. According to Bashmakov, Gritsevich, and Sorokina
(1996), more energy-efficient refrigerators could save up to 175 petajoules a
year by 2010. The efficiency measures in this sector and the commercial sector
are very similar to those in Russia (installing new metering and control
devices, improving insulation of buildings and heating systems).
Transportation. Russia’s Ministry of Transport has
adopted several programmes to make the transportation system more efficient,
safe, and comfortable (SNAP, 1999). In 1995 the ministry introduced a programme
aimed at introducing energy-saving vehicles, optimising the structure of the
vehicle stock, developing energy-efficient engines, and introducing
energy-saving fuels and lubricants (Russian Federation Ministry of Transport
1995). Among other measures, the programme is expected to increase of the share
of diesel-fuelled trucks and buses and modernise aeroplanes and helicopters.
Though there is great potential for economic energy savings,
these savings will be difficult to achieve. Russia and Ukraine cannot provide
the necessary financial support to industry and municipalities. Current
investments in energy-saving measures are so low that less than 10 percent of
economic energy saving potential is being reached in the Commonwealth of
Independent States (Bashmakov, Gritsevich, and Sorokina, 1996). But this is
likely to change with the economic recovery of Russia and Ukraine over the next
10
years.
India
With more than 1 billion inhabitants, India is one of the
world’s biggest emerging economies.16 In the 50 years since
independence the use of commercial energy has increased by ten times, and in
1996/97 was 10,300 petajoules (GOI, Ninth Plan Document, 1996). But per capita
energy consumption is only about 15 gigajoules a year (including non-commercial
energy) - far below the world average of 65 gigajoules. Given the ever-widening
gap between energy supply and demand in India, and the resource constraint
impeding large-scale energy generation at source, efficient energy use is an
extremely important, cost-effective option. Commercial energy use is dominated
by industry (51 percent), followed by transportation (22 percent), households
(12 percent), agriculture (9 percent), and other sectors including basic
petrochemical products (6 percent).
Industry. Indian industry is highly energy-intensive,
with energy efficiency well below that of industrialised countries (see table
6.3). Efforts to promote energy efficiency in such industries could
substantially reduce operating costs. About 65-70 percent of industrial energy
consumption is accounted for by seven sectors - fertiliser, cement, pulp and
paper, textiles, iron and steel, aluminium, and refineries. The other areas
considered for this report are brick-making, foundries, and industrial
cogeneration. Potential efficiency improvements are the result of a bundle of
feasible and economic energy-saving options, identified through energy and
technology audits (table 6.9, box 6.6).
TABLE 6.9. ECONOMIC ENERGY EFFICIENCY POTENTIALS IN INDIA,
2010
|
Sector and technological area |
Economic potential (percent or units of energy a year)
|
Energy price level assumed |
If percent, base year |
Source |
|
Industry |
|
|
|
|
|
Fertiliser |
12.6 gigajoules per tonne of NH3 |
Today’s price |
|
TERI and FAI, 1995 |
|
Cement |
17% |
Today’s price |
1992 |
TIFAC, 1992 |
|
|
Electrical |
17% |
|
|
|
|
|
Thermal |
27% |
|
|
|
|
Pulp and paper |
20-25% |
Today’s price |
1994 |
CII, 1994 |
|
Textiles |
23% |
Today’s price |
1998 |
TERI, 1999 |
|
Iron and steel |
15% |
Today’s price |
1998 |
TERI, 1996a |
|
Aluminium |
15-20% |
Today’s price |
1996 |
TERI, 1996b |
|
Refineries |
8-10% |
Today’s price |
1996 |
Raghuraman, 1989 |
|
Brick-making |
15-40% |
Today’s price |
1989 |
TERI, 1997b |
|
Foundries |
30-50% |
Today’s price |
1997 |
TERI, 1998 |
|
Industrial cogeneration |
3,500 megawatts (sugar) |
Today’s price |
1997 |
TERI, 1994 |
|
Residential |
|
|
|
|
|
Lighting |
10-70% |
Today’s price |
1996 |
TERI, 1997c |
|
Refrigerator |
25% |
Today’s price |
1996 |
TERI, 1997c |
|
Air conditioning |
10% |
Today’s price |
1996 |
TERI, 1997c |
|
Agriculture |
|
|
|
|
|
Pump sets |
25-55% |
Today’s price |
1995 |
Kuldip and others, 1995 |
|
Transportation |
|
|
|
|
|
Two- and three-wheelers |
25% |
Today’s price |
1995 |
IIP, 1995 |
|
Cars |
7.5-10% |
Today’s price |
1992 |
TERI, 1992 |
|
Trains (diesel) |
5-10% |
Today’s price |
1997 |
TERI, 1997c |
|
Trains (electric) |
5-10% |
Today’s price |
1997 |
TERI, 1997c |
Residential. Energy consumption in India’s
residential sector varies widely across low-, medium-, and high-income classes
in rural and urban areas. Household demand for electricity will likely expand
rapidly as urbanisation continues and the availability of consumer durables
expands with increasing income. About 40 percent of the electricity used by the
sector goes to meet lighting demand, followed by 31 percent for fans and 28
percent for appliances (refrigerators, air conditioners, televisions). The
economic potential of efficiency improvements was estimated for lighting (up to
70 percent), refrigerators (25 percent), and air conditioners (10 percent; see
table 6.9).
Agriculture. The main areas for conserving energy in
agriculture are diesel-fuelled and electric pumps, 16 million of which were in
operation in 1991/92. The estimated savings potential of 25-55 percent involves
avoiding such common drawbacks as improper selection of pumps and prime movers,
improper installation, poor pump characteristics, high friction losses in the
valves and the piping system, air inflow in the suction pipe, and improper
maintenance and servicing.
Transportation. Transportation accounts for almost half
of India’s oil product consumption, in the form of high-speed diesel and
gasoline (TERI, 1999). Two major structural aspects of transportation are
related to energy efficiency. First, the rail-dominant economy of the 1950s gave
way to the road-dominant economy of the 1990s, reaching 81 percent of the
sector’s energy consumption (TERI, 1997c). Second, inadequate public
transport systems and increasing incomes have led to a rapid increase in
personalised modes of transport and intermediate public transport, some of which
are extremely energy-inefficient.
A large number of two-stroke-engine two-wheelers are used as
personal vehicles. (In 1996 the number of registered two-wheelers was 23.1
million.) Efficiency improvements of 25 percent are possible for two-stroke
engines (two- and three-wheelers). The stringent emission standards proposed for
two- and three-wheelers will force manufacturers to switch to four-stroke
engines. Efficiency improvements for cars and buses are expected to come
primarily from switching from gasoline and diesel to compressed natural gas
(TERI, 1992).
|
BOX 6.6. MORE ENERGY-EFFICIENT FOUNDRIES IN INDIA
Until recently most of India’s 6,000 small foundries had
conventional cupolas (melting furnaces) with low energy efficiencies and high
emissions. In 1998 a new divided-blast cupola and pollution control system were
commissioned and fine-tuned. Once various control parameters were optimised, the
demonstration cupola was far more energy efficient, with coke savings ranging
from 33-65 percent relative to average small-scale foundries in India. Emissions
of total suspended particulates are below the most stringent emission norm
prevailing in India. In addition, the new cupola has a much reduced oxidation
loss for silicon and manganese. This success story outlines an appropriate
strategy for small-scale foundries to upgrade to an energy-efficient and
environmentally cleaner option. This strategy can be adapted not only to other
industry clusters in India, but also to units operating under similar conditions
in other countries. |
Source: TERI, 1998.
The importance of research and development for increasing energy
efficiency is still underestimated in India. Spending on research and
development increased from 0.35 percent of GNP in 1970 to 0.81 percent in 1994.
But this share is still just one-third of the ratio in industrialised countries.
Tackling the complex technological problems of the energy sector, particularly
end-use efficiencies, will require research and development on a steadily
increasing
scale.
China
Like India, China is one of the world’s main emerging
economies, with a population of more than 1.2 billion.17 In 1996
China’s primary energy demand was 44,000 petajoules, or 36 gigajoules per
capita. Substantial energy efficiency gains could be realised through intensive
investments in the country’s productive sectors.
Industry. In 1995 steel and iron industry consumed 3,740
petajoules, accounting for 13 percent of China’s final energy use with a
performance of 46 percent energy efficiency. Energy consumption per tonne of
steel will likely drop from 44 gigajoules in 1995 to 35 gigajoules in 2010,
which is a little higher than the level in industrialised countries in the 1970s
(table 6.10). The potential efficiency savings in some other energy-intensive
branches are higher - construction materials could achieve 20 percent and
chemicals up to 30 percent, with particular savings in basic chemicals such as
ammonia, sulphate, soda, carbide, and olefine production.
Residential. Since the 1980s domestic energy consumption
has increased because of higher living standards and expanded living space.
Measures such as preventing heat losses, improving electric appliance
efficiency, replacing incandescent lamps with fluorescent lamps, improving
stoves and boilers, and using cogeneration will enhance energy efficiency in
this sector. In 1995 the average efficiency of China’s energy use - as
defined by the relationship between useful energy and final energy - was 45
percent in urban areas and 25 percent in rural areas, indicating considerable
potential for improvement. By 2010 energy efficiency is expected to reach 50
percent in urban areas and 45 percent in rural areas, close to levels in
industrialised countries in the early 1990s (box 6.7). This means savings of
10-15 percent in urban areas and 80 percent in rural areas. These gains are
important because the drivers for energy services will be increasing by 5-18
percent a year.
TABLE 6.10. ECONOMIC ENERGY EFFICIENCY POTENTIALS IN CHINA,
2010
|
Sector and area |
Economic potential (percent) |
Energy price level assumed |
Base year |
Reference |
|
Industry |
|
|
|
|
|
Iron and steel |
15-25 |
Today’s price |
1995 |
Hu, 1997 |
|
Cement |
10-20 |
Today’s price |
1995 |
Hu, 1997 |
|
Foundries |
8-14 |
Today’s price |
1995 |
Hu, 1997 |
|
Pulp and paper |
20-40 |
Today’s price |
1995 |
Hu and Jiang, 1997 |
|
Textiles |
15-28 |
Today’s price |
1995 |
Hu, 1997 |
|
Fertiliser |
10-20 |
Today’s price |
1995 |
Hu and Jiang, 1997 |
|
Aluminium |
20 |
Today’s price |
1995 |
Hu and Jiang, 1997 |
|
Brick kilns |
32 |
Today’s price |
1995 |
Hu and Jiang, 1997 |
|
Refineries |
5-10 |
Today’s price |
1995 |
Hu and Jiang, 1997 |
|
Ethylene |
10-30 |
Today’s price |
1995 |
Hu and Jiang, 1997 |
|
Calcium carbide |
10-22 |
Today’s price |
1995 |
Hu and Jiang, 1997 |
|
Sulphate |
14-25 |
Today’s price |
1995 |
CIECC, 1997 |
|
Caustic soda |
10-30 |
Today’s price |
1995 |
CIECC, 1997 |
|
Household |
|
|
|
|
|
Lighting |
10-40 |
Today’s price |
1995 |
CIECC, 1997 |
|
Refrigerator |
10-15 |
Today’s price |
1995 |
CIECC, 1997 |
|
Air conditioner |
15 |
Today’s price |
1995 |
CIECC, 1997 |
|
Washing machine |
15 |
Today’s price |
1995 |
CIECC, 1997 |
|
Cooking utensils |
20-40 |
Today’s price |
1995 |
CIECC, 1997 |
|
Heating equipment |
10-30 |
Today’s price |
1995 |
CIECC, 1997 |
|
Agriculture |
|
|
|
|
|
Motors |
10-30 |
Today’s price |
1995 |
CIECC, 1997 |
|
Pump sets |
20-50 |
Today’s price |
1995 |
CIECC, 1997 |
|
Transportation |
|
|
|
|
|
Train (diesel) |
5-15 |
Today’s price |
1995 |
Hu, 1997 |
|
Train (electric) |
8-14 |
Today’s price |
1995 |
Hu, 1997 |
|
Cars |
10-15 |
Today’s price |
1995 |
Hu, 1997 |
|
Vessels |
10 |
Today’s price |
1995 |
Hu, 1997 |
Other sectors. In 1995 other final energy users in the
service sector had an average end-use efficiency of about 40 percent. By 2010
technological progress and technical measures are expected to increase the
efficiency level by 5-10 percentage points over 1995, reaching the level of
industrialised countries in the early 1990s.
Transportation. Transportation is a large and
fast-growing energy-consuming sector, especially for petroleum products (2,640
petajoules in 1995, including public transport). By 2010 energy consumption will
almost double, with oil products accounting for 87 percent of transport energy
consumption. Relative to other sectors, transportation has a low end-use
efficiency of around 30 percent. The main technical measures for increasing
efficiency are similar to those elsewhere: increase the share of diesel
vehicles, rationalise the weight of cars, speed up road construction and improve
its quality; increase the share of electric engines and internal combustion
engines on trains, and optimise engines. Better-designed propellers on ships
could save 5 percent on ships’ fuel consumption. Optimal ship shape
energy-saving technology will save 4-10 percent of fuel, and the use of tidal
energy another 3-5
percent.
Latin America
Primary energy demand in Latin America grew 2.3 percent a year
over the past 20 years, reaching 18,130 petajoules in 1996.18 The
region also contains several emerging economies that are increasing world energy
demand. In 1997 Argentina, Brazil, Mexico, and Venezuela used 85 percent of the
region’s primary energy (EIA, 1999b).
Industry. Four sectors (cement, iron and steel,
chemicals, food and beverages) consume 60 percent of industrial energy in Latin
America. Iron and steel alone account for 23 percent of industrial energy.
Better management of blast furnaces, the injection of gases, and improved
processes could reduce energy demand by 10-28 percent (Cavaliero, 1998). Machado
and Shaeffer (1998) estimate potential electricity savings of 23 percent in
Brazil’s iron and steel industry and 11-38 percent in its cement industry
(table 6.11). The food and beverage industry and chemical industry have similar
efficiency potential (Argentina Secretaria de Energ�a, 1997; Jannuzzi, 1998).
In Brazil’s industrial sector, electrical motors consume 51
percent of electricity, electrochemical processes 21 percent, electrothermal
processes 20 percent, refrigeration 6 percent, and lighting 2 percent (Geller
and others, 1997 and 1998). In Argentina nearly 75 percent of industrial
electricity is used in motors (Dutt and Tanides, 1994) and in Chile it is 85
percent (Valdes-Arrieta, 1993). The Brazilian Electricity Conservation Agency
estimates that savings of 8-15 percent are achievable in Brazilian industry
based on cost-effective measures such as replacing oversized motors, improving
transmission systems, replacing overloaded internal lines and transformers,
correcting low power factors, and reducing excessive peak loads (box 6.8).
Additional savings of 7-15 percent could be achieved by using efficient motors
and variable speed drives; improving electrical furnaces, boilers, and
electrolytic process efficiencies; and disseminating cogeneration in industry
(Geller and others, 1998; Soares and Tabosa, 1996). Recycling the heat surplus
or installing more efficient equipment could reduce by 10 percent the amount of
electricity used in electric ovens. Similar savings for Argentina have been
estimated by Dutt and Tanides (1994) and Argentina Secretaria de Energ�a (1997).
|
Low-energy houses need only
10-30 percent of the heat
per
square metre that is used in the
average residential building
in
West Germany. |
The significant potential of combined heat and power is
under-exploited in most Latin American countries. The potential is great in
sectors such as paper and pulp, chemicals, and the alcohol-sugar industry,
because they produce industrial residues that can be used to generate a surplus
of electricity, which can then be sold to the common grid. Legislation
establishing independent power producers is in place, but there are still
problems in regulating buy-back rates, maintenance power, and wheeling between
industry and electric utilities.
Residential. Annual energy use for cooking is estimated
at 5.2 gigajoules per capita, nearly half of which is from firewood (data cover
only Argentina, Brazil, Mexico, and Venezuela). The use of biomass (firewood and
charcoal) is declining, however, and the use of liquefied petroleum gas and
natural gas is on the rise. Because these fuels are more efficient, per capita
energy consumption will be 20 percent lower by 2020. During 1990-95 per capita
residential electricity use increased by 4-5 percent a year in Brazil and
Mexico. Specific savings in electricity use by appliances range from 20-40
percent over the next 10-20 years for several Latin American countries (see
table 6.11).
Commercial and public sectors. More efficient energy use
in the commercial and public sectors can be achieved by introducing better
boilers and maintenance practices as well as small cogeneration. Mexico is
implementing building standards, which will accelerate improvements in energy
use (Huang and others, 1998). For lighting, air conditioning, and refrigeration,
the main electrical end uses, substantial efficiency improvements are possible
for most Latin American countries (see table 6.11).
|
BOX 6.7. GREEN LIGHT PROGRAMME OF CHINA
China’s Green Light Programme is an energy conservation
project supported by UNDP and organised and carried out by the State Economic
and Trade Commission of China. The programme is designed to increase the use of
lighting systems that are highly efficient, long-lasting, safe, and stable. The
goal is to save electricity, reduce environmental pollution from power
generation, and improve the quality of working and living. The programme has had
several achievements:
· Electricity
savings. During 1995-2000, 300 million compact fluorescent lamps, thin-tube
fluorescent lamps, and other high-efficiency illumination products will save 22
terawatt-hours of electricity (as final energy).
· Reduced emissions. By
2000 sulphur dioxide emissions will be reduced by 200,000 tonnes and carbon
dioxide emissions by 7.4 million tonnes.
· Establishing the market. By creating
market-driven demand for high-efficiency lighting products, China will minimise
spending for the associated gains. Close attention has been given to upgrading
energy-efficient products by improving quality standards and certification.
|
TABLE 6.11. ECONOMIC ENERGY EFFICIENCY POTENTIALS IN LATIN
AMERICA, 2010 AND 2020
|
Sector and area |
Economic potential (percent) |
Country/ region |
Energy price level assumed |
Base year |
Source |
|
2010 |
2020 |
|
|
|
|
|
Industry |
|
|
|
|
|
|
|
Electric motors and drives |
15-30a,d |
30 |
Mexico |
0.06-0.09 |
1996 |
M�xico Secretaria de Energ�a, 1997; Argentina Secretaria de
Energ�a, 1997; EIA, 1999a; Geller and others 1998; IIEC, 1995; Sheinbaum and
Rodriguez, 1997 |
|
Refrigeration |
27-42b |
15-30c |
Argentina |
(elect)d |
1997 |
|
|
Process heat |
10-20 |
21-44 |
Brazil |
|
1997 |
|
|
|
|
Chile |
0.01-0.02
(fuels)b |
1994 |
|
|
Iron and steel |
|
23b (elect) |
Brazil |
|
1998 |
Machado and Shaeffer, 1998; Cavaliero 1998; Argentina Secretaria
de Energ�a, 1997; EIA, 1999a; IIEC, 1995 |
|
|
28b (coke) |
|
|
1994 |
|
|
|
15a |
|
|
|
|
|
|
10d |
Argentina
Chile |
|
|
|
|
Cement |
|
11-38b (elect) |
Brazil |
|
1998 |
Machado and Shaeffer, 1998; Sheinbaum and Ozawa, 1998 |
|
Food and beverage |
|
20b |
Brazil |
|
1998 |
Jannuzzi, 1998; Argentina Secretaria de Energ�a, 1997; EIA,
1999a; IIEC, 1995 |
|
|
30a |
Argentina |
|
1998 |
|
|
|
6d (elect) |
Chile |
|
1994 |
|
|
Residential |
|
20-40 (elect) |
Mexico, |
|
1996 |
M�xico Secretaria de Energ�a, 1997; Argentina Secretaria de
Energ�a, 1997; EIA, 1999a; Machado and Shaeffer, 1998; Friedmann, 1994 |
|
|
|
Argentina |
|
1997 |
|
|
|
|
Brazil |
|
1998 |
|
|
Cooking |
|
24 |
Latin America |
|
1997 |
Author’s estimate |
|
Electrical appliances |
20-25 |
20-40 |
Mexico |
|
1996 |
M�xico Secretaria de Energ�a, 1997; Geller and others 1998 |
|
|
|
Brazil |
|
1997 |
|
|
Lighting |
30-80 |
|
Brazil |
0.03-0.13 |
1997 |
Jannuzzi, 1998; Argentina Secretaria de Energ�a, 1997; EIA,
1999a; Blanc and de Buen, 1994 |
|
|
|
Argentina |
(fuels and electricity)b |
1991 |
|
|
Refrigeration |
|
35-50 |
Brazil
Argentina |
|
1998 |
Machado and Shaeffer, 1998; M�xico Secretaria de Energ�a, 1997
|
|
|
|
Mexico |
|
1996 |
|
|
Commercial and public |
20-40 (elect.) |
|
Mexico |
|
1996 |
M�xico Secretaria de Energ�a, 1997; |
|
|
|
Argentina
Chile |
|
1997 |
Argentina Secretaria de Energ�a, 1997; EIA, 1999a; IIEC, 1995
|
|
Shopping centres |
|
13-38 (elect.) |
Brazil |
|
1998 |
Machado and Shaeffer, 1998 |
|
Hotels |
|
12-23 |
Brazil |
|
1998 |
Machado and Shaeffer, 1998 |
|
Lighting |
40 |
|
Mexico |
|
1996 |
M�xico Secretaria de Energ�a, 1997; Jannuzzi and others, 1991;
Bandala, 1995 |
|
|
|
Brazil |
|
1990 |
|
|
Public lighting |
21-44a |
|
Argentina |
|
1991 |
Argentina Secretaria de Energ�a, 1997; EIA, 1999a; IIEC, 1995
|
|
37d |
|
Chile |
0.05d |
|
|
|
Transportation |
25 |
|
Argentina |
|
1998 |
|
Note: Data for Argentina refer to the estimated
technical potential. Data for Chile are for 2020; for Brazil, 2020 or 2010, as
indicated; for Argentina, 2010 or 1998, as indicated; and for Mexico, 2006. a.
Argentina. b. Brazil. c. Mexico. d. Chile.
Transportation. About two-thirds of Latin America’s
transport energy demand is concentrated in Brazil and Mexico, where road
transport accounts for 90 percent of the sector’s energy consumption. Past
improvements in the average specific energy consumption of passenger cars in
Mexico (from 491 megajoules per 100 kilometres in 1975 to 423 megajoules in
1990) will likely continue at a similar rate (Sheinbaum, Meyers, and Sathaye,
1994). Mexico’s freight transport has seen efficiency improve from 2.47
megajoules per ton-kilometre in 1975 to 1.8 megajoules per ton-kilometre in
1988. Subway systems have not grown at the same rate as passenger demand for
travel in Latin America’s major cities, the exception being Curitiba,
Brazil. In Argentina the Energy Secretariat estimates that 12 petajoules of fuel
can be saved each year in passenger and freight transportation (about 25 percent
of the transport sector’s energy use in 1995; Argentina Secretaria de
Energ�a, 1998f).
|
BOX 6.8. EFFORTS TO PROMOTE ENERGY USE BY THE BRAZILIAN
ELECTRICITY CONSERVATION AGENCY
In the mid-1980s the Brazilian government established PROCEL, a
national electricity conservation agency. The agency is responsible for funding
and coordinating energy efficiency projects carried out by state and local
utilities, state agencies, private companies, universities, and research
institutes. It is also responsible for evaluating efficiency programs carried
out by privatised utilities. PROCEL also helps utilities obtain low-interest
financing for major energy efficiency projects. In 1998 PROCEL’s core
budget for grants, staff, and consultants was about $20 million, with about $140
million a year going towards project financing.
PROCEL estimates that its activities saved 5.3 terawatt-hours of
electricity in 1998, equivalent to 1.8 percent of Brazil’s electricity use.
In addition, PROCEL took credit for 1.4 terawatt-hours of additional power
production due to power plant improvements that year. The electricity savings
and additional generation enabled utilities to avoid constructing about 1,560
megawatts of new capacity, meaning approximately $3.1 billion of avoided
investments in new power plants and transmission and distribution facilities.
The overall benefit-cost ratio for the utility sector was 12:1. About 33 percent
of the savings in 1998 came from efficiency improvements in refrigerators,
freezers, and air conditioners, 31 percent from more efficient lighting, 13
percent from installation of meters, 11 percent from motor projects, 8 percent
from industrial programs, and 4 percent from other activities (Geller and
others, 1998). |
Africa
Africa has great potential for energy efficiency savings in
industry, households, and transportation, which together account for more than
80 percent of the continent’s energy consumption (21 gigajoules per capita
in 1996).19 When assessing the economic efficiency potentials in
table 6.12, however, one has to keep in mind the enormous differences in
development in Africa and the fact that the literature on this subject is scarce
and often dated. South Africa and most North African countries are at more
advanced stages of industrialisation and motorisation than the rest of the
continent.
TABLE 6.12. ECONOMIC ENERGY EFFICIENCY POTENTIALS IN
AFRICA, 2020
|
Sector and area |
Economic potential (percent) |
Country |
Energy price level assumed |
Base year |
Source |
|
Industry |
|
|
|
|
|
|
Total industry |
15 |
Zimbabwe |
|
1990 |
TAU, 1991 |
|
about30 |
Zambia |
|
1995 |
SADC, 1996 |
|
32 |
Ghana |
|
1991 |
Davidson and Karekezi, 1991; Adegbulugbe, 1992a |
|
25 |
Nigeria |
|
1985 |
Davidson and Karekezi, 1991; SADC, 1997 |
|
>20 |
Sierra Leone |
|
1991 |
Adegbulugbe, 1993 |
|
20 |
Mozambique |
|
|
|
|
Iron and steel |
7.2 |
Kenya |
|
|
Nyoike, 1993 |
|
Cement |
11.3 |
Kenya |
|
|
Nyoike, 1993 |
|
15.4 |
Ghana |
|
1988 |
Opam, 1992 |
|
9.8 |
Kenya |
|
|
Nyoike, 1993 |
|
Aluminium (sec.) |
44.8 |
Kenya |
|
|
Nyoike, 1993 |
|
Refineries |
6.3 |
Kenya |
|
|
Nyoike, 1993 |
|
Inorganic chemicals |
19.0 |
Kenya |
|
|
Nyoike, 1993 |
|
Consumer goods |
25 |
Kenya |
|
|
Nyoike, 1993 |
|
Food |
16-24 |
Mozambique |
|
1993 |
SADC, 1997 |
|
1-30 |
Ghana |
|
1988 |
Opam, 1992 |
|
Cogeneration |
600 MW |
Egypt |
|
1998 |
Alnakeeb, 1998 |
|
Residential |
|
|
|
|
|
|
Electric appliances |
20-25 |
Mozambique |
1993 |
1991 |
SADC, 1997 |
|
11 |
South Africa |
|
1995 |
Energy Efficiency News, 1996 |
|
Commercial/public/agriculture |
|
|
|
|
|
|
Electricity |
20-25 |
Mozambique |
1993 |
1995 |
SADC, 1997 |
|
up to 50 |
Egypt |
1998 |
1998 |
Alnakeeb and others, 1998 |
|
Agriculture/ forestry |
12.5 |
Tanzania (biopower) |
1993 |
1993 |
|
|
Transportation |
|
|
|
|
|
|
Cars, road system |
30 |
Nigeria |
|
1985 |
Adegbulugbe, 1992a |
|
Total transport |
30 |
Ethiopia |
|
1995 |
Mengistu, 1995 |
|
BOX 6.9. ENERGY-EFFICIENT COOKING IN RURAL AFRICA
The Kenya Ceramic Jiko initiative is one of the most successful
urban cookstove projects in Africa. The initiative promotes a charcoal-based
cookstove with an energy efficiency of about 30 percent. The stove is made of
local ceramic and metal components. Since the mid-1980s more than 500,000 of the
stoves have been produced and distributed in Kenya. The stove is not a radical
departure from the traditional all-metal stove. Rather, it is an incremental
development. On the other hand, the stove requires that charcoal be produced and
transported.
The improved stove is fabricated and distributed by the same
people who manufacture and sell traditional stoves. From the beginning the stove
initiative received no subsidies - a decision that had a tremendous impact on
its development, encouraging private entrepreneurs to invest their capital and
work hard to recover their investment. This drive to recover the original
investment helped ensure self-sustained production, marketing, and
commercialisation of the charcoal stoves. In addition, the lack of subsidy
enhanced competition between producers, bringing down its market price to a more
realistic and affordable level for Kenya’s low-income urban households. The
stove design has been successfully replicated in Malawi, Rwanda, Senegal, Sudan,
Tanzania, and Uganda. |
Industry. Studies indicate that good housekeeping
measures can save substantial amounts of energy in African industries (see table
6.12). Potential energy savings in national industries range from 15-32 percent
by 2020. Results from energy audits in Nigeria (of two cement plants, one steel
plant, and a furniture manufacturing plant) show potential savings of up to 25
percent. In 28 small- and medium-size industries in Zambia and Zimbabwe the
potential savings are between 15 and 30 percent, in Kenyan industries about 25
percent, in nine industrial plants in Egypt about 23 percent, in Ghana 32
percent, and in Sierra Leone more than 20 percent. A more recent analysis
carried out in industries in Mozambique indicates an economic electricity saving
potential of 20 percent (SADC, 1997). Cogeneration also seems to have
unexploited potential - in Egypt four industrial branches could save 600
megawatts by engaging in cogeneration (Alnakeeb, 1998).
Residential. The use of inefficient traditional
three-stone fuelwood stoves for cooking, mainly in rural areas, results in
considerable energy losses. The end-use efficiency of the stoves ranges from
12-18 percent. Promoting better biomass-cooking stoves and switching to modern
fuels would greatly reduce the huge energy losses in this sector. Better cooking
stoves could raise efficiency to 30-42 percent in Ghana, Kenya, and Uganda (box
6.9). In urban areas the focus should be on energy-efficient appliances,
lighting, and other housekeeping measures for domestic appliances. In lighting a
shift from kerosene to incandescent lamps, and from incandescent lamps to
fluorescent and compact fluorescent lamps, would increase energy efficiency (see
table 6.12).
Transportation. Road transport is the dominant mode in
Africa. Nearly all vehicles are imported from overseas, often used cars and
trucks. Potential savings are achievable by using roadworthy vehicles and
changing policies. Vehicles tend to have low fuel efficiency. The average fuel
efficiency in Nigeria is estimated to be about 18 litres of gasoline per 100
kilometres (Adegbulugbe, 1992a). Fuel efficiency is low because the vehicle
fleet is old and poorly maintained, because of traffic congestion in most urban
centres, and because of bad driving habits. Energy savings of 30 percent could
be achieved in the road subsector by shifting from an energy-intensive transport
mode to a less energy-intensive public transport system and by adopting traffic
management schemes. In Ethiopia and Nigeria the demand for gasoline and diesel
could be cut by 30 percent by emphasising public transportation over private
automobiles (Adegbulugbe, 1992b; Mengistu,
1995).
The economic potential of energy efficiency - a systemic perspective
The preceding section covered only individual technology for
energy conversion and use.20 But additional - and sometimes major -
energy savings can be realised by looking at energy-using systems in a broader
sense. Aspects of this systemic view include:
· Optimising the
transport and distribution of energy. Commercial energy use is often highly
decentralised, yet the energy is produced in central plants; examples include
electricity and district heating networks.
· Optimising the location of
energy users to avoid transporting goods or people.
· Optimising according the
second law of thermodynamics by supplying the suitable form of energy, including
heat at the needed temperature and pressure, or by exploiting opportunities for
energy cascading.
These concepts are not new. But they are often neglected in the
planning of cities and suburbs, industrial sites and areas, airports, power
plants, and greenhouses.
Excellent examples of the systemic approach include not only
technical systems but also innovations in joint planning and coordinated - or
even joint - operation or financing of energy generating, distributing, or using
systems (IEA, 1997a):
· A district heating
system in Kryukovo, Russia, that supplies almost 10 petajoules of heat was to a
large extent manually controlled and monitored. Automated control of
substations, remote sensing, and control between substations and the operator
working station resulted in savings of 20-25 percent.
· Organising urban mobility is a
major challenge for all countries. In areas with rapidly growing populations,
planning decisions on residential, industrial, and commercial areas do not
adequately consider induced mobility demand and possible modes of
transportation. Incentives for car sharing, park-and-ride systems, and parking
influence the use of cars and public transportation. In developing countries a
lack of capital for subways must not lead to disastrous traffic jams. A possible
solution has been realised by the bus system in Curitiba, Brazil (IEA, 1997a, p.
103).
· The adequate use of the exergy
of energy carriers is another systemic aspect of energy efficiency. Cogeneration
takes many forms: combined gas and steam turbines, gas turbines instead of
burners, engine-driven cogeneration, and fuel cells that can supply heat at the
correct levels of temperature and pressure (Kashiwagi, 1999). Excess heat at low
temperatures may be used in heat transformers, heat pumps, or adsorption cooling
systems. Production processes with high-temperature heat demand can be located
in industrial parks surrounded by production processes with lower-temperature
heat that can be reused in greenhouses or fish ponds (Kashiwagi,
1995).
These systemic aspects have been investigated less intensively
because such systems demand a lot of coordinated planning and action by several
actors and institutions. They often also demand changes in legal frameworks and
decision-making in companies and administrations. Additional risks have to be
managed by new entrepreneurial solutions and insurance services. In many cases,
however, the efficiency potentials if such systems may exceed the economic
efficiency potentials of individual
technologies.
Technical and theoretical potentials for rational energy use after 2020
Many energy economists expect energy demand to increase in
industrialised countries, accompanied by a substantial shift to natural gas,
nuclear power, and renewables to avoid climate changes caused by energy-related
greenhouse gases (chapter 9).21 Explicitly or implicitly, those
expectations assume that substantial cost-effective efficiency improvements will
be exhausted within the next 20 years, contributing to new growth in energy
demand after some 25 years of stagnation. But applied scientists and engineers
have questioned the judgement that feasible improvements in energy efficiency
are limited to 30-40 percent (Jochem, 1991; De Beer, 1998; ETSU, 1994; Blok and
others, 1996; Kashiwagi and others, 1998). These authors argue that, depending
on new technology and scientific knowledge, the long-term technical potential
for rational energy use may even exceed 80 percent in the 21st century, driven
by efforts to:
· Increase exergy
efficiency (which today is less than 15 percent, even in industrialised
countries) by exploiting the different temperatures of heat streams and using
the adequate form of final energy or heat at the needed temperature level.
· Decrease the level of
useful energy by reducing losses (for example, through insulation or heat
recovery) and by substituting energy-intensive processes (such as membrane and
absorption technologies instead of thermal separation, thin slab casting of
steel instead of rolling steel sheets, new catalysts or enzymes, new
bio-technical processes, and inductive electric processes instead of thermal
surface treatment).
· Apply new materials
(new compound plastics, foamed metals, nano-technology applications).
· Intensify recycling of
energy-intensive materials (increased shares of recycled plastics,
aluminium, or flat glass, which still have low recycling rates in most regions).
· Re-substitute wood, natural
fibres, and natural raw materials for energy-intensive plastics (due to
great potential for genetic manipulation of plants and substitution among
energy-intensive materials; see box 6.1).
|
Catalysts, enzymes,
new materials, and new
processes
will make possible the
substitution of many energy-
intensive processes.
|
Because of the unbalanced perception between the long-term
potential for rational energy use and energy conversion and supply technologies
(Jochem, 1991), the huge long-term potential for increasing energy efficiency at
the end-use level will likely remain underestimated for some time. Indeed, given
the enormous economies of scale in fast-growing national, regional, and global
markets, the economic efficiency potentials cited above for 2010 and 2020 may be
too small in many cases.
To use as many energy sources as possible, the concept of
cascaded energy use must be introduced in the energy conversion and end-use
sectors. Cascaded energy use involves fully harnessing the heat produced by
fossil fuel combustion (from its initial 1,700°C down to near-ambient
temperatures), with a thermal ‘down flow’ of heat analogous to the
downward flow of water in a cascade (Kashiwagi, 1995; Shimazaki and others,
1997). Applications that exploit the full exergetic potential of energy in
multiple stages (cascaded) are not common. To exploit the exergetic potential of
industrial waste heat, energy transfers between the industrial and residential
or commercial sectors are advisable. But low energy prices make it difficult to
find economically attractive projects.
For refrigeration, air conditioning, and hot water supply, it is
possible to meet most of the heat demand with low-exergy waste heat obtained as
a by-product of high-temperature, high-grade primary energy use in heat engines
or fuel cells, in a cascaded use of cogeneration. From a thermodynamic viewpoint
it is appropriate to combine low-exergy heat sources, such as solar and waste
heat, with systems requiring low-exergy heat, such as heating, cooling, and air
conditioning.
The level of specific useful energy demand can be influenced by
innumerable technological changes without reducing the energy services provided
by energy use and without impairing comfort. A few examples demonstrate these
almost unconverted possibilities:
· The quality of
insulation and air-tightness determine the demand for useful energy in
buildings, furnaces, refrigerators and freezers.
· Low-energy houses need only
10-30 percent of the heat per square metre that is used in the average
residential building in West Germany (box 6.12). A cold-storage depot or a
refrigerator could be operated by outdoor air in the winter in zones with
moderate climate. A substantial part of industrial waste heat occurs at
temperatures below 50oC. Water adsorption chillers provide a way to
recover such heat sources and produce cooling energy (Saha and Kashiwagi, 1997),
increasing energy efficiency.
· Catalysts, enzymes, new
materials, and new processes will make possible the substitution of many
energy-intensive processes. High energy demand to activate chemical reactions,
with high-pressure and high-temperature processes, may be rendered unnecessary
by new catalysts or biotechnological processes. Membrane processes will use only
a small percentage of the useful energy needed today in thermal separation
processes. The production of iron - which today involves energy-intensive
sintering and coke-making - will be switched to the new coal metallurgy, with
substantial energy savings. Over the long term, the energy-intensive
rolling-mill operation of steel-making will be replaced by continuous thin slab
casting or even spraying of steel sheets.
· New materials for cutting
edges will improve surface quality, avoiding several machine operations. Lasers
will reduce the specific energy demand of metal cutting, and inductive electric
processes will save energy in thermal surface treatment. New compound plastics
or foamed metals will induce less energy demand in manufacturing and (because of
smaller specific weight and reduced losses due to inertia) be used in vehicles
and moving parts of machines and engines.
Over the past century energy systems in industrialised countries
saw efficiency increase by 1.0-1.5 percent a year. Looking at the theoretical
and technical potential of future energy efficiency, a similar increase of
1.0-1.5 percent a year appears possible over the next century. Increases in
efficiency will be steadily exhausted by implementing economic efficiency
opportunities and steadily fed by implementing technical innovations and cost
reductions for energy-efficient technology. This process can be understood as a
constant economic efficiency potential of 25-30 percent over the next 20 years,
similar to the observation at the energy supply side that the ratio of proven
reserves to consumption of oil remains at 30-40 years due to continuous
searching for new reserves and technical progress on prospecting, drilling, and
production
techniques.
Obstacles, market imperfections, and disincentives for efficient energy use
Energy efficiency improvements since the oil shock of 1973 may
have done more to redesign energy markets than did changes in conventional
energy supply systems.22 And as noted, such improvements still offer
huge opportunities and can contribute to sustainable development in all regions.
But given today’s levels of energy-related knowledge, decision-making, and
power structures, there is much evidence that the great potential for rational
energy use will be overlooked by many companies, administrations, and households
or deemed purely theoretical or unfeasible.
Of course, it will not be easy to fully achieve economic
efficiency potentials, the ‘fifth energy resource’. The technologies
are decentralised and technologically very different, and increased efficiency
is harder to measure than energy consumption. In addition, instead of a dozen
large energy supply companies or a few engineering companies in a country,
millions of energy consumers have to decide on their energy efficiency
investments and organisational measures. The heterogeneity and diversity of
energy consumers and manufacturers of energy-efficient equipment contribute to a
low perception of the high potential of energy efficiency. Because of this
variety and complexity, energy efficiency is not appealing for the media or for
politicians (Jochem, 1991).
In theory, given all the benefits of energy efficiency at the
micro-economic and macroeconomic levels, a perfect market would invest in, and
allocate the rewards from, new energy-efficient technologies and strategies. But
in practice, many obstacles and market imperfections prevent profitable energy
efficiency from being fully realised (Jochem and Gruber, 1990; Hirst, 1991; IEA,
1997a; Gardner and Stern, 1996; Reddy, 1991). Although these obstacles and
market imperfections are universal in principle, their importance differs among
sectors, institutions, and
regions.
General obstacles
Obstacles to end-use efficiency vary by country for many
reasons, including technical education and training, entrepreneurial and
household traditions, the availability of capital, and existing legislation.
Market imperfections include the external costs of energy use (Hohmeyer,
Ottinger, and Rennings, 1997) as well as subsidies, traditional legislation and
rules, and traditions, motivations, and decision-making in households,
companies, and administrations. Finally, an inherent obstacle is the fact that
most energy efficiency investments remain invisible and do not contribute to
politicians’ public image. The invisibility of energy efficiency measures
(in contrast to photovoltaic or solar thermal collectors) and the difficulty of
demonstrating and quantifying their impacts are also important. Aspects of
social prestige influence the decisions on efficiency of private households - as
when buying large cars (Sanstad and Howarth, 1994; Jochem, Sathaye, and Bouille,
2000).
OECD countries. Obstacles to and market imperfections for
energy efficiency in end-use sectors have been observed in OECD countries for
more than 20 years.23 While limited, empirical research on the
barriers underscores the diversity of individual investors (with thousands of
firms, hundreds of thousands of landlords, and millions of consumers in a single
country).
Lack of knowledge, know-how, and technical skills and high
transaction costs. Improved energy efficiency is brought about by new
technology, organisational changes, and minor changes in a known product,
process, or vehicle. This implies that investors and energy users are able to
get to know and understand the perceived benefits of the technical efficiency
improvement as well as evaluate possible risks. It also implies that investors
and users have to be prepared to realise the improvement and to take time to
absorb the new information and evaluate the innovation (OTA, 1993; Levine and
others, 1995; Sioshansi, 1991). But most households and private car drivers,
small and medium-size companies, and small public administrations do not have
enough knowledge, technical skills, and market information about possibilities
for energy savings. The construction industry and many medium-size investment
firms face the same problem as small companies on the user’s side.
Managers, preoccupied with routine business, can only engage themselves in the
most immediately important tasks (Velthuijsen, 1995; Ramesohl, 1999). Because
energy efficiency reduces a small share of the energy costs of total production
or household costs, it gets placed on the back burner.
Lack of access to capital and historically or socially formed
investment patterns. The same energy consumers, even if they gain knowledge,
often have trouble raising funds for energy efficiency investments. Their
capital may be limited, and addi-tional credit may be expensive. Especially when
interest rates are high, households and small firms tend to prefer to accept
higher current costs and the risk of rising energy prices instead of taking a
postponed energy credit (DeCanio, 1993; Gruber and Brand, 1991).
Disparity of profitability expectations of energy supply and
demand. The lack of knowledge about energy efficiency among small energy
consumers raises their perceptions of risk, so energy consumers and suppliers
expect different rates of return on investments (Hassett and Metcalf, 1993).
Energy supply companies in countries with monopolistic energy market structures
are willing to accept nominal internal rates of return of 8-15 percent (after
tax) for major supply projects (IEA, 1987). But for efficiency investments,
energy consumers demand - explicitly or without calculating - payback periods
between one and five years, which are equivalent to a nominal internal rate of
return of 15-50 percent (DeCanio, 1993; Gruber and Brand, 1991). This disparity
in rate of return expectations also seems to apply to international loans,
putting energy efficiency investments in developing countries at a disadvantage
(Levine and others, 1995).
The impact of grid-based price structures on efficient energy
use. Grid-based forms of energy play a dominant role in OECD countries. The
structure of gas, electricity, and district heat tariffs for small consumers and
the level of the load-independent energy charge are important for energy
conservation. Tariff structures are designed in two parts to reflect two
services - the potential to obtain a certain amount of capacity at any given
time, and the delivered energy. The capacity charge plays an important role in
profitability calculations for investments where efficiency improvements do not
reduce capacity demand, such as inverters on electric engines or control
techniques in gas or district heating (IEA, 1991). In addition, in most OECD
countries utilities still do not offer time-of-use or seasonal rates to small
consumers, which would reward them for using energy during off-peak hours. This,
however, may change in fully liberalised electricity and gas markets.
Legal and administrative obstacles. There are legal and
administrative obstacles in almost all end-use sectors. They are mostly country
specific, and often date back to before 1973, when energy prices were low and
declining in real terms and there was no threat of global warming. For most
local government authorities the budgeting format is an ‘annual budgeting
fixation’, which means that they cannot transfer funds from the recurrent
to the investment budget. With a lot of other urgent needs calling for capital
investment, energy efficiency measures are given low priority. The poor
perception of public goods adds to the obstacles confronting energy efficiency
in developing and transition economies (see below).
Other market barriers. The investor-user dilemma points
to the fact that for rented dwellings or leased buildings, machines, or
vehicles, there are few incentives for renters to invest in property that they
do not own. Similarly, landlords, builders, and owners have few incentives to
invest because of the uncertainty of recovering their investment through higher
rent (Fisher and Rothkopf, 1989; Golove, 1994). Finally, the quality of
delivered energy (as with unstable frequencies or voltages of electricity or
impurities in gasoline or diesel) may pose a severe barrier for effi-ciency
investments (electronic control or high efficiency motors).
|
Because energy efficiency
reduces a small share of
the
energy costs of total production or
household costs, it gets
placed
on the back burner. |
Additional barriers in transition economies.24
Transition economies did not experience the sharp increase in world energy
prices in the 1970s. As a result opportunities for more efficient energy use
were scarcely realised in these countries. Most transition economies suffer from
all the barriers described above for OECD countries, as well as from additional
market problems stemming from the legacy of central planning. The deep economic
and structural crisis during the early years of transition shifted the
investment priorities of industrial and commercial companies to short-term
decisions, helping them to survive. Technological innovations that increase
energy efficiency are hardly considered a priority in many transition economies
(Borisova and others, 1997). There are, however, substantial differences among
most Eastern European countries and members of the Commonwealth of Independent
States.
Unpaid energy bills. The economic crisis in transition
economies created special obstacles to investing in energy efficiency, including
non-payments and non-monetary payments (barter, promissory notes, and other
surrogates by energy consumers, mutual debt clearing between companies). In
Georgia less than 30 percent of residential electricity rates were paid in 1994;
industrial payments fell to 16 percent, and 25-50 percent of the electricity
supply was not accounted or billed (World Bank, 1996; TACIS, 1996). In Russia
about 25 percent of generated electricity was not paid for by customers in
1995-97 (BEA, 1998). Industrial and commercial customers covered up to 80
percent of their energy bills using non-monetary and surrogate means (Russian
Federation Ministry of Fuel and Energy, 1998). The use of barter is contributing
to the neglect of potential reductions in energy costs through efficiency
measures. Experience in Eastern Europe, however, demonstrates that cutting
customers off from the electricity or gas supply persuades them to pay (box
6.10).
|
BOX 6.10. THE IMPLICATIONS OF TERMINATING ELECTRICITY
SUBSIDIES IN HUNGARY
Raising energy prices to cost-covering levels can produce
miracles. Until 1997 Hungary spent $5-10 million a year on energy efficiency
improvements. In January 1997 energy prices were raised to market-based levels -
and in just two years, investments in energy efficiency jumped to $80 million a
year. The usual argument against correct energy pricing, that consumers cannot
pay the bills, is not proven in Hungary. Just 10 percent of the national energy
bill remained unpaid, and that just partly. True, retirees with low incomes have
difficulties. But they are not the big consumers with high bills. The problem is
a social problem, and has been solved by special payment schemes in the social
policy framework of local and national budgets. |
Barriers to energy metering. Many energy customers in
transition economies are still not equipped with meters and controllers or have
simplistic, outdated meters. In particular, residential customers in the
Commonwealth of Independent States often have no meters to measure the use of
natural gas, heat, and hot water, reflecting a long-held view that heat and fuel
are public goods. According to the Russian Federation Ministry of Fuel and
Energy (1998), only about 10 percent of heat customers (and no more than 15
percent of hot water and natural gas customers) are equipped with meters. Since
1994, however, significant efforts have been made to manufacture modern meters
and controllers and to develop related services (certification, maintenance, and
verification) (Minfopenergo, 1996). Meters are far more common in Eastern
Europe, because since the 1980s these countries have had to import needed
energies in exchange for hard currency.
Lack of cost-based tariffs for grid-based energies.
Natural gas, electricity, heat, and hot water are supplied to users in the
Commonwealth of Independent States and some Eastern European countries by
regional or local energy monopolies with government participation and municipal
distribution companies. Energy tariffs are still set by federal and regional
energy commissions in most of the Commonwealth of Independent States. In Russia
a large portion of customers are subsidised; fuels are of poor quality,
expensive, or both; resellers charge excessive costs and receive large profits;
detailed information is lacking on the production costs of suppliers; and the
decisions of regional commissions do not sufficiently reflect cost
considerations, but depend on the political priorities of the local authorities
(Vasiliev and others, 1998).
Subsidies. In all Commonwealth of Independent States
countries and a few Eastern European countries the grid-based energy supply of
residential and agricultural customers is still subsidised. Subsidies are driven
by traditional concepts of public goods or social policy. In addition, some
groups (war veterans, low income families) pay discounted residential tariffs.
In Ukraine the government paid 20 percent of the cost of natural gas for
residential customers in 1996 (Gnedoy, 1998). Russian municipalities spend 25-45
percent of their budgets on residential heat subsidies, covering more than half
of heat bills (Bashmakov, 1997a).
Subsidised energy prices reduce the economic attractiveness
of energy efficiency measures. Cross-subsidies for electric power in the
Commonwealth of Independent States distort price signals between groups of
customers. For instance, cross-subsidies for residential electricity account for
20-60 percent of prices for industrial customers in different regions of Russia
(Moloduik, 1997; Kretinina, Nekrasov, and Voronina, 1998). In principle, this
price structure would lead to large investments in efficiency in Russian
industry. But non-payment of energy bills prevents that from happening. The case
for abolishing electricity subsidies in most Eastern European countries
demonstrates that the social aspects of such a pricing policy can be addressed
by social policy at the municipality level (see box 6.10).
|
Subsidised energy
prices reduce the
economic
attractiveness of energy
efficiency measures. |
Additional barriers in developing countries. The general
obstacles to efficient energy use are sometimes more intense in developing
countries than in OECD or transition economies.25 But there are
similarities between subsidies and pricing policies in developing and transition
economies. The situation in developing countries may be more complex given the
big differences in energy use, income, development, and infrastructure between
urban and rural areas in India, China, Latin America, and Africa.
Lack of awareness of potential benefits. The limited
awareness of the potential for energy efficiency is the most important obstacle
to wide-scale adoption of energy efficiency measures and technologies in
developing countries. Limited awareness is a by-product of inadequate
information infrastructure to raise awareness of the potential for energy
efficiency and of available technologies and proven practices. The media used to
raise awareness in most developing countries limit the audience. Awareness
campaigns rely on radio, television, and newspapers, which most rural
populations - the majority of the population in developing countries - do not
have access to. In addition, managers in industry do not have timely information
on available efficiency technology (Reddy, 1991), and many producers of end-use
equipment are unacquainted with energy-efficient technology and related
knowledge.
Many developing countries still lack an effective energy
efficiency policy at the national level. Energy supply policies are
preferred in most developing countries because of the focus on development
policies. This pattern may also be due to the fact that grid-based energy
supplies are often owned by national or local governments, a pattern that
supports rigid hierarchical structures and closed networks of decision-makers.
Energy supply constraints. In some developing countries,
energy supply constraints provide no alternative fuel and technology options for
consumers. The limited availability of commercial fuels (petroleum products,
electricity) in rural areas impedes switching to more energy-efficient stoves,
dryers, and other technologies, posing a major challenge for energy policy (see
chapter 10).
Inappropriate energy pricing and cross-subsidies. Energy
prices are still below marginal opportunity costs in many developing countries,
reflecting the desire of governments to use energy supply to achieve political
objectives. Successive governments have upheld energy subsidies over decades,
making it politically difficult to raise energy prices to the level of marginal
opportunity costs (box 6.11; Nadel, Kothari, and Gopinath, 1991).
Lack of trained staff, operators, and maintenance workers.
Insufficient energy workers are an important constraint to the investment
and operation of buildings, machines, plants, and transport systems (Suzuki,
Ueta, and Mori, 1996).
Lack of capital and import of inefficient used plants and
vehicles. Many energy efficiency measures are delayed by a lack of
financing. The availability of credit at high interest rates tends to make
energy efficiency investments a low priority. In many developing countries there
is also a conflict among investment priorities. Growing economies generally
favour investments in additional capacity over investments in energy efficiency.
This tendency and lack of capital lead to imports of used plants, machinery, and
vehicles, aggravating the problem (see the section on technology transfer,
above).
Proliferation of inefficient equipment and the desire to
minimise initial costs. In the absence of energy labelling schemes and of
standards for energy efficiency, energy-inefficient products continue to be
manufactured and marketed. Examples include diesel-fuelled irrigation pumps,
motors, and transformers. Many users focus on minimising initial costs, with
little regard for operating efficiency and life-cycle costs. Thus they tend to
opt for cheaper, locally manufactured, inefficient
equipment.
Target group-specific and technology-specific obstacles
Many target group-specific and technology-specific obstacles
also impede investments in energy efficiency.26
Buildings. Lack of information and knowledge is a problem
not only among building owners, tenants, and users in industrialised
countries, but also among architects, consulting engineers, and installers
(IEA, 1997a; Enqu�te Commission, 1991). These groups have a remarkable influence
on the investment decisions of builders, small and medium-size companies, and
public authorities. The separation of spending and benefits (or the
landlord-tenant dilemma) is common in rented buildings because the owner of a
building is not the same as the user (IEA, 1991). This obstacle impedes the
adoption of efficient space heating, air conditioning, ventilation, cooling, and
lighting equipment in leased buildings and appliances. It is also a problem in
the public sector, where schools, sports halls, hospitals, and leased office
buildings may have a variety of owners - or where local governments operate and
use buildings owned by state or federal governments. Building managers are often
not sufficiently trained and do not receive adequate incentives for excellent
performance. Planners and architects are often reimbursed based on the total
investment cost, not the projected life-cycle cost of the planned building or
equipment.
|
BOX 6.11. DISTORTED ENERGY PRICES RESULT IN BIG LOSSES FOR
INDIAN SUPPLIERS
Distorted energy prices are a major obstacle to energy
efficiency. In India electricity tariffs vary considerably between states and
types of users. The average cost of supply for the country’s electricity
boards is $0.049 a kilowatt-hour - yet revenue collection averages just $0.037 a
kilowatt-hour. Utility losses are mounting and were reported to be $1.49 billion
in 1994/95 (GOI, 1995). High commercial losses are mainly caused by the
irrational tariff structure, which provides large subsidies to agricultural and
domestic uses (see table). |
|
Electricity tariffs in Indian states, 1998 (U.S. cents per
kilowatt-hour) |
|
State electricity board |
User |
|
Domestic |
Commercial |
Agriculture/ irrigation |
Industry |
Rail transport |
Exports to other states |
Average |
|
Haryana |
4.7 |
7.5 |
1.2 |
7.5 |
7.5 |
3.2 |
5.3 |
|
Himachal Pradesh |
1.6 |
4 |
1.4 |
3.5 |
n.a. |
3.5 |
2.8 |
|
Jammu, Kashmir |
0.7 |
1.2 |
0.2 |
0.9 |
n.a. |
n.a. |
0.8 |
|
Kerala |
1.4 |
4.6 |
0.5 |
2.4 |
n.a. |
n.a. |
2.2 |
|
Madhya, Pradesh |
1.7 |
7.3 |
0.1 |
7.4 |
11.8 |
2.1 |
5.1 |
|
West Bengal |
1.9 |
4.7 |
0.6 |
5.9 |
6.7 |
n.a. |
3.3 |
|
Average |
2.9 |
6.7 |
0.5 |
6.9 |
8.5 |
2.9 |
4.1 |
n.a. Not available.
Source: Ministry of Power,
Government of India (http://powermin.nic.in/plc72.htm).
In many developing countries building design has been
imitated from industrialised countries regardless of different climates,
domestic construction materials, and construction traditions. This approach
often results in an extremely energy-consuming design for cooling equipment in
office buildings in warm developing countries. Houses in higher-income
developing countries are often built by the affluent with a view to projecting
prestige rather than reflecting economic concerns. Such buildings are generally
devoid of energy efficiency aspects. Lack of information on energy-efficient
architecture also undermines energy-efficient building standards and
regulations. And in countries where such standards and regulations exist,
non-compliance is a constraint.
Household appliances and office automation. Residential
consumers in industrialised countries substantially underinvest in
energy-efficient appliances or require returns of 20 to more than 50 percent to
make such investments (Sioshansi, 1991; Lovins and Hennicke, 1999). Related
obstacles include a lack of life-cycle costing in a culture of convenience,
longstanding ties to certain manufacturers, aspects of prestige, and the
investor-user dilemma in the case of rented apartments or office equipment.
Low incomes make it difficult for households in developing
countries to switch from lower efficiency to higher efficiency (but more
expensive) devices (improved biomass cook stoves, and liquefied petroleum gas
and kerosene stoves). Similarly, fluorescent and compact fluorescent lamps are
often not bought due to the lack of life-cycle costing by households.
Small and medium-size companies and public
administration. In most small and medium-sized companies, all investments
except infrastructure are decided according to payback periods instead of
internal interest rate calculations. If the lifespan of energy-saving
investments (such as a new condensing boiler or a heat exchanger) is longer than
that of existing production plants and machinery and if the payback period is
expected to be even for both investments, entrepreneurs expect (consciously or
unconsciously) higher profits from energy-saving investments (table 6.13).
Lack of funds is a severe constraint for small and medium-size
local governments in many countries. Many communities with high unemployment are
highly indebted. Making matters worse, municipalities often receive a
significant share of their annual budgets through some kind of tax or surcharge
on electricity, gas, or district heat sales to their residents, lowering the
enthusiasm of local politicians for promoting energy conservation. Finally, in
public budget planning, budgets for operating costs are often separate from
budgets for investment. Thus possible savings in the operating budget from
energy efficiency investments are often not adequately considered in the
investment budget.
For small and medium-sized enterprises and communities,
installing new energy-efficient equipment is far more difficult than simply
paying for energy (Reddy, 1991). Many firms (especially with the current shift
towards lean firms) suffer from a shortage of trained technical staff (OTA,
1993) because most personnel are busy maintaining production. In the Netherlands
a lack of available personnel was considered a barrier to investing in
energy-efficient equipment by one-third of surveyed firms (Velthuijsen, 1995).
Insufficient maintenance of energy-converting systems and
related control equipment causes substantial energy losses. Outsiders (external
consultants, utilities) are not always welcome, especially if proprietary
processes are involved (OTA, 1993). Many companies cannot evaluate the risks
connected with new equipment or control techniques in terms of their possible
effects on product quality, process reliability, maintenance needs, or
performance (OTA, 1993). Thus firms are less likely to invest in new,
commercially unproven technology. An aversion to perceived risks is an
especially powerful barrier in small and medium-size enterprises (Yakowitz and
Hanmer, 1993).
In transition economies small companies and local
authorities may not be able to afford an energy manager.
In developing countries lack of information and technical
skills is an enormous problem for small and medium-sized firms, because such
firms often account for a large portion of the economy. In addition, the
possible disruption of production is perceived as a barrier to investments in
energy efficiency. Although such an investment may be economically attractive,
unexpected changes in production increase the risk that the investment will not
be fully depreciated.
TABLE 6.13 PAYBACK CALCULATIONS AS A RISK INDICATOR LEAD TO
UNDER-INVESTMENT IN PROFITABLE, LONG-LASTING ENERGY EFFICIENCY INVESTMENTS
|
Useful life of plant (years) |
|
3 |
4 |
5 |
6 |
7 |
10 |
12 |
15 |
|
Payback |
2 |
24% |
35% |
41% |
45% |
47% |
49% |
49.5% |
50% |
|
time |
3 |
0% |
13% |
20% |
25% |
27% |
31% |
32% |
33% |
|
requirement |
4 |
|
0% |
8% |
13% |
17% |
22% |
23% |
24% |
|
(years) |
5 |
|
|
0% |
6% |
10% |
16% |
17% |
18.5% |
|
6 |
|
|
|
0% |
4% |
10.5% |
12.5% |
14.5% |
|
8 |
Unprofitable |
|
|
|
4.5% |
7% |
9% |
Note: Percentages are annual internal rates of
return. Continuous energy saving is assumed over the entire useful life of the
plant. Profitable investment possibilities are eliminated by a four-year payback
time requirement.
Large enterprises and public administrations. Mechanisms
are often lacking to acknowledge energy savings by local administrations, public
or private. Public procurement is generally not carried out on the basis of
life-cycle cost analysis. Instead, the cheapest bidder gets the contract - and
as long as the offered investment meets the project’s specifications for
energy use, it need not be energy efficient. The industrial sector, where
managers are motivated to minimise costs, poses the fewest barriers to
energy-efficient investment (Golove, 1994). But DeCanio (1993) shows that firms
typically establish internal hurdle rates for energy efficiency investments that
are higher than the cost of capital to the firm. This fact reflects the low
priority that top managers place on increasing profits by raising energy
productivity.
Developing countries often lack sufficient human
resources to implement energy efficiency projects and to adequately operate and
service them. Thus, even when firms recognise the potential of energy efficiency
and want to harness the benefits of energy efficiency measures, they are often
hampered by a dearth of skilled staff and consultants and by a lack of competent
energy service companies. Capital constrains also impede rational energy use in
these countries. Furthermore, low capacity use (sometimes as low as 30 percent;
World Bank, 1989) affects efficient energy use by industry. Low capacity use is
caused by many factors, including poor maintenance, lack of spare parts and raw
materials, and unsuitable scale and design of plants.
These factors are often complicated by the risk-averse
management of big firms. This attitude usually stems from resistance to change,
limited knowledge on the technical and economic analysis of energy efficiency
technology, and a paucity of data on the experiences of previous users of such
measures or technology.
Transportation. The transport policies of most countries
rarely view transportation as an energy issue. Rather, transportation is
considered a driver of economic growth with the development of infrastructure
for moving goods and people. This policy is strongly supported by associations
of car drivers, the road transport and aviation industries, and vehicle
manufacturers. Most countries have no fuel efficiency standards for new
vehicles; the exceptions are for cars as in Canada, Japan, and the United States
(Bradbrook, 1997) and a recent voluntary agreement among Western European car
manufacturers to improve fuel efficiency by 25 percent between 1995 and 2008. In
nearly all countries, cars owned by companies or public authorities are often
inappropriately powered. Bad driving habits, especially of government- and
company-owned vehicles, also impede the rational use of energy in road
transportation.
The benefits of fuel efficiency standards are evident from the
success of mandatory Corporate Average Fuel Economy (CAFE) standards being
introduced in North America (though the standards do not apply to light
vehicles). Many voters in OECD countries consider driving a car to be an
expression of individual freedom. As a result most drivers and politicians do
not pay much attention to fuel efficiency.
The weak finances of local and national governments in
transition economies make it difficult to introduce modern public
transport systems or to upgrade existing ones. The limited financial resources
of households and small companies are the main reason for heavy imports of used
cars from Western Europe and Japan.
In developing countries road transportation increases
mobility without the huge public upfront investment needed for railways,
subways, and trams. Thus one major obstacle to improved energy efficiency is the
limited number of alternative transport modes. In many developing countries
vehicles are either assembled or imported. Economic problems and devaluations of
local currencies have driven up vehicle prices. As a result many people and
small firms cannot afford new vehicles, so a lot of car buyers opt for imported
used vehicles that have been used for several years in the country of origin.
Similar problems are being encountered with the pricing of spare parts. In
addition, most developing countries lack regulation on regular car inspections.
Together these problems have resulted in poor vehicle maintenance that has
exacerbated energy inefficiency.
The Intergovernmental Panel on Climate Change report on aviation
(IPCC, 1999a) projects a 20 percent improvement in fuel efficiency by 2015 and a
40 percent improvement by 2050 relative to aircraft produced today. Improvements
in air traffic management would reduce fuel demand by another 8-18 percent.
Environmental levies and emissions trading can help realise these improvements
by encouraging technological innovation and reducing the growth in demand for
air travel.
Agriculture. Agriculture is the main beneficiary of
subsidised electricity in developing countries. In some cases electricity
is even provided to agricultural consumers free of charge. One major fallout of
this approach is the phenomenal growth in electricity consumption by this
sector. In the 1980s agriculture consumed 18 percent of India’s
electricity; by 1994 it consumed 30 percent (CMIE, 1996). Even after accounting
for the additional pump sets installed during this period, extremely low
electricity prices are one of the main reasons for the increase in the
sector’s energy intensity.
Cogeneration. Cogeneration has considerable potential in
industrial sites and district heating systems. Yet the monopolistic structure of
the electricity sector in many countries has led to high prices for maintenance
and peak power, rather low buyback rates and costly technical standards for grid
connection, and to dumping prices in the case of planning new cogeneration
capacity (VDEW, 1997). As a result many auto producers restrict the capacity of
the cogeneration plant to their minimum electricity and heat needs, although
they may wish to produce more heat by cogeneration. This situation is changing
now in countries (such as France) with liberalised electricity markets and
regulated or competitive buyback rates.
In Central and Eastern Europe centralised district
heating remains a widespread solution for heating big housing estates. The
economics of centralising the heat supply of a certain area is regarded not as a
question of profitability, but a historical fact. But inadequate pricing,
inefficient operation, mismanagement, and lack of full use of cogeneration
potential are encouraging heat consumers to disconnect from the district heating
grid. The easy availability of natural gas, existence of small and medium-size
cogeneration units (namely, gas engines and gas turbines), and desire for
independence also encourage consumers to disconnect. This tends to make the heat
demand density leaner, driving the system in a negative spiral that may end in
the economic collapse of many district heating enterprises in transition
economies.
|
Low incomes make it difficult for
households in developing
countries
to switch from lower efficiency
to higher efficiency (but
more
expensive) devices. |
The potential for industrial cogeneration is estimated at 20-25
percent of industrial and commercial electricity demand in several developing
countries (TERI, 1994; Alnakeeb, 1998). India’s sugar industry, for
instance, generates 3,500 megawatts of bagasse-based cogenerated power. But the
full potential of industrial cogeneration in China, India, and Latin America has
yet to be realised because of slow progress on power buyback arrangements and
the wheeling and banking of cogenerated power by state electricity boards.
Although institutional barriers are considered the main obstacle in this regard,
limited indigenous capacity to manufacture high-pressure boilers and turbines is
also an important barrier, as hard currency is scarce in developing countries
(TERI, 1994).
For every obstacle and market imperfection discussed in this
section, there are interrelated measures of energy efficiency policy that could
remove or reduce them (figure 6.5). But the choice of which policies to pursue
must be made with care, because their effectiveness depends on many regional,
cultural, and societal circumstances and on the different weights of the
obstacles in different
regions.
National and international policies to exploit the economic potential of energy efficiency in end-use sectors
Despite the clear warnings of the scientific community (IPCC,
1995) and the commitments made under the Kyoto Protocol, and despite possible
reductions in energy costs and the benefits of energy efficiency for employment
and economic development (see box 6.3), many scientists and non-governmental
organisations (NGOs) feel that “policy makers are still doing too little to
use energy efficiency potentials in order to safeguard their citizens and their
future” (Lovins and Hennicke, 1999, pp. 7-10; Phylipsen, Blok, and
Hendriks, 1999; further citations).27 These authors ask for more
activity in policy areas such as energy efficiency, transportation, and
renewables.
Over the past 25 years individual and ad hoc policy measures -
such as information, training, grants, or energy taxes - have often produced
limited results (Dasgupta, 1999). But integrated energy demand policies - which
consider simultaneous obstacles and the interdependence of regulations,
consultations, training programmes, and financial incentives - and long-lasting
programmes have been relatively successful. Energy demand policy is not only
initiated by governments. Companies, utilities, industrial associations, and
NGOs may also play an important part.
An integrated energy, transportation, financial, and economic
policy is one of the main opportunities for realising the huge economic energy
saving potentials not only of individual parts and technologies, but also of a
country’s energy-using systems. There is a strong need to formulate a
long-term strategy that promotes energy efficiency improvements in all sectors
of the economy and that takes into account general obstacles, market
imperfections, and target group-specific barriers. This section presents the
policy initiatives to be taken in different end-use sectors in a linear manner,
but such initiatives have to be implemented together to contribute to
sustainable development (see figure 6.5). These policies include general policy
instruments such as energy taxes, direct tax credits, emissions trading, a
general energy conservation law, general education on energy issues in schools,
and research and development (see chapter 11). In some cases international
cooperation by governments and industrial associations may play an important
supporting
role.
General policy measures
General policies to promote energy efficiency try to overcome
general obstacles and market imperfections. They may also be implemented in the
context of broader economic issues, such as shifting the tax burden from labour
to non-renewable resources through an ecotax at the national or multinational
level (see chapter 11). Or new regulation may be needed to limit the ambiguous
impacts of liberalised electricity and gas markets in their transition phase.
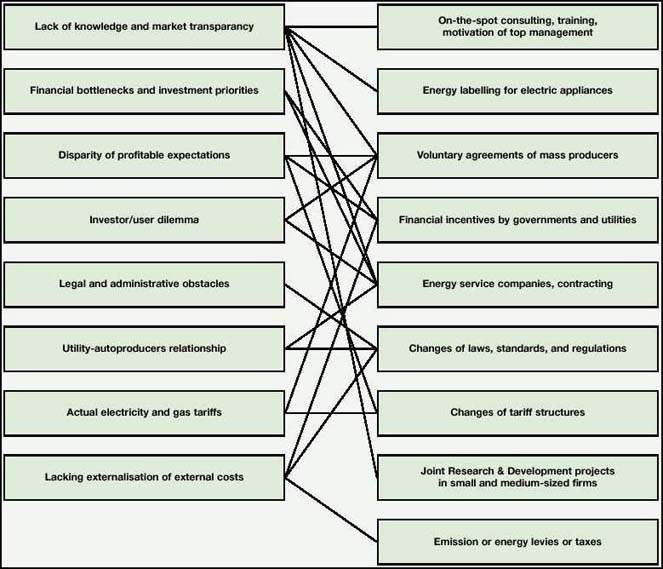
FIGURE 6.5. OBSTACLES AND MARKET
IMPERFECTIONS FOR ENERGY EFFICIENCY AND RELATED POLICIES: A SCHEME FOR POLICY
OPTIONS AND INTEGRATED EFFICIENCY POLICY
The acceptance of such policy measures differs by country and
varies over time depending on how much an energy policy objective is violated or
in question. Energy efficiency policy was widely accepted in OECD countries in
the 1970s and early 1980s, when dependence on oil imports from OPEC countries
was high and higher fuel prices had changed cost structures and weakened
competitiveness in energy-intensive industries. With declining world energy
prices between 1986 and 1999, reduced dependence on energy imports in many OECD
countries, and stagnating negotiations on the implementation of the Kyoto
Protocol, public interest in energy efficiency policy has fallen in many OECD
countries.
By contrast, energy efficiency receives considerable attention
from governments, industries, and households in Eastern European countries, in
some Commonwealth of Independent States countries without indigenous energy
resources, and in many emerging economies facing problems with sufficient and
reliable supplies of commercial energy.
Energy conservation laws have been passed in many countries
(Australia, Canada, China, Finland, Germany, Japan, Russia, Switzerland, the
United States) or are in the process of being passed (India). Such laws are
important for establishing a legal framework for sector regulation (building
codes, labelling, technical standards for equipment and appliances) and for
implementing other measures (energy agencies, financial funds for economic
incentives or public procurement). In many countries with federal structures,
however, much of the legislative power to enact energy conservation laws rests
with individual states - posing problems for compliance and joint action.
Education on energy efficiency issues in primary or secondary
schools, along with professional training, raises consciousness and basic
knowledge about the efficient use of energy and the most recent technologies.
Direct subsidies and tax credits were often used to promote
energy efficiency in the past. Direct subsidies often suffer from a free-rider
effect when they are used for investments that would have been made anyway.
Although it is difficult to evaluate this effect, in Western Europe 50-80
percent of direct subsidies are estimated to go to free riders (Farla and Blok,
1995). Low-interest loans for energy efficiency projects appear to be a more
effective subsidy, although they may have a distribution effect.
Energy service companies are a promising entrepreneurial
development, as they simultaneously overcome several obstacles by providing
professional engineering, operational, managerial, and financial expertise,
along with financial resources. Such companies either get paid a fee based on
achieved savings or sign a contract to provide defined energy services such as
heating, cooling, illumination, delivery of compressed air, or hot water.
|
Energy demand policy is not only
initiated by governments.
Companies,
utilities, industrial associations,
and NGOs may also
play
an important part. |
Transition economies. From a policy perspective,
efficient energy use creates enormous opportunities in light of huge
reinvestments in industry and infrastructure and large new investments in
buildings, vehicles, and appliances. In the Commonwealth of Independent States
and Eastern Europe increased energy efficiency was made a top political priority
in the early and mid-1990s - as with Russia’s 1994 National Energy Strategy
(IEA, 1995). But according to the Russian Federation Ministry of Fuel and Energy
(1998), government support for such activities was less than 8 percent of the
planned funding in 1993-97.
Transition economies that were relatively open under central
planning (defined as those for whom foreign trade accounted for more than 30
percent of GDP) have had an easier time adjusting to world markets.
Multinational companies from Western Europe and other OECD countries maintain
their technical standards when building new factories in transition economies.
In addition, Eastern European countries are trying to approach (and later, to
meet) Western European technical standards as part of their eventual accession
to the European Union (Krawczynski and Michna, 1996; Michna, 1994).
Energy efficiency policies developed differently according to
the speed of transition and economic growth in these countries. Some elements of
efficiency programmes have been quite successful despite economic difficulties:
laws, energy agencies, energy auditing of federal buildings. In most transition
economies the first energy service companies were established with the support
of international institutions. Some industrial enterprises established internal
energy monitoring and control, reinforced by incentives and sanctions for
particular shops and their management. The results of such activities differed
considerably among transition economies, reflecting levels of organisation,
human and financial capital, trade experience, foreign investment, energy
subsidies, and other factors.
Developing countries. The phasing out of substantial
energy subsidies can often be complemented by capacity building, professional
training, and design assistance. Utilities in Mexico and Brazil, for example,
have been active in demand-side management programmes with cost-benefit ratios
of more than 10 to 1 (Dutt and others, 1996). Given the shortage of capital in
many developing countries, financial incentives seem to have a large impact on
energy efficiency (unlike in OECD countries). An example is China in the 1980s,
where such incentives contributed to the remarkable decline in China’s
industrial energy intensity (Sinton and Levine,
1994).
Sector- and technology-specific policy measures
Given the many obstacles that keep economic energy-saving
potential from being realised on a sectoral or technological level, any actor
will look for a single instrument that can alleviate all obstacles. For mass
products, performance standards are considered an efficient instrument because
they can be developed after discussions with scientists, engineers, and
industrial associations, manufacturers, and importers. Standards and labelling
avoid the need for information, high transaction costs, and dissemination to,
consultations with, and training of millions of households, car drivers, and
small and medium-size companies (Natural Resources Canada, 1998).
|
BOX 6.12. THE MULTIMEASURE CHARACTER OF NATIONAL ENERGY
EFFICIENCY POLICY - A 20-YEAR LEARNING CURVE FOR MULTIFAMILY BUILDINGS IN WEST
GERMANY
After the oil shocks of the 1970s, German professional
organisations made recommendations for new building standards. In addition, the
federal government enacted an ordinance for boiler efficiencies to accelerate
the replacement of old boilers by new, more efficient ones. Building codes and
boiler standards have since been tightened three times, and regulations on
individual heat metering were introduced in the early 1980s. Research and
development enabled the new standards to be met. Twenty-five years later, the
results are convincing. New buildings are 50-70 percent more efficient, and
retrofits have cut energy consumption by 50 percent in Germany (and by at least
30 percent in most Western European countries).
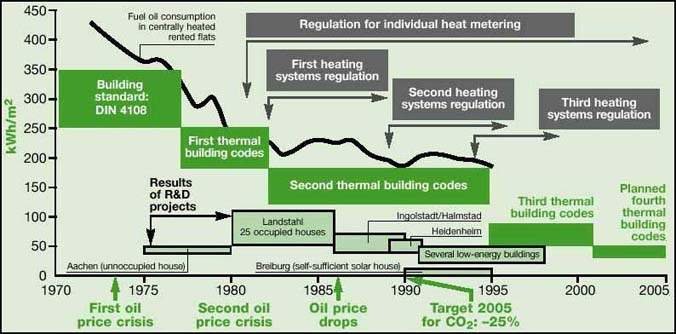
Interrelation between research to
lower costs, proof of technical feasibility, and heating and insulation
regulation in Germany
Source: EC, 1999b. |
|
But no single, highly efficient instrument will be available in
all cases (as with the refurbishing of buildings or efficiency improvements in
industrial plants). In these cases a package of policy measures has to be
implemented to alleviate obstacles (see figure 6.5).
Buildings. There seems to be an intellectual barrier
between planners and architects for buildings in cold and warm climates,
although building codes may offer huge efficiency potential in most countries.
Jochem and Hohmeyer (1992) conclude that if comprehensive policy strategies are
implemented, governments will discover that the economics of end-use efficiency
are far more attractive than is currently believed. A good example is the
refurbishing of residential buildings. Homes and apartment buildings consume
about 20 percent of final energy in many countries. Refurbishing a building may
be primarily an individual event, but its effectiveness depends on such
political and social remedies as:
· Advanced education
and training of architects, planners, installers, and builders, as carried out
in the Swiss ‘impulse programme’, which has had outstanding results
since 1978.
· Information and education for
landlords and home owners (particularly on the substitution of energy costs for
capital costs).
· Training professional advisers
to perform audits and provide practical recommendations. These audits should be
subsidised; otherwise they may be considered too costly by landlords or home
owners. Such subsidies have proven cost-effective.
· Investment subsidies tied to a
registered energy consultant and a formal heat survey report and minimum energy
efficiency level.
· Investment subsidies for
specific groups of home owners or multifamily buildings to overcome financial
bottlenecks or risks of the investor-user dilemma. The cost-effectiveness of
such subsidies has often been overestimated, however.
· Economically justified
insulation and window design secured by new building codes that also cover the
refurbishing of buildings.
· Research and development to
improve building design (low-energy houses, passive solar buildings), insulation
material, or windows, or to reduce construction costs.
Energy-saving programs in Denmark, Finland, Germany, Sweden, and
Switzerland owe much of their success to this multimeasure approach, which is
increasingly being adopted by other countries (box 6.12). The combination of
measures has increased capacity in the construction sectors of those countries.
Energy labelling for buildings has been introduced in a few OECD countries and
is being considered in several others (Bradbrook, 1991). Such labelling provides
information on a building’s energy costs when it is being rented or bought
(Hicks and Clough, 1998). Building standards for cooling have been adopted in
Indonesia, Mexico, Singapore, and Thailand. Compliance with building codes is
uncertain in many countries, however, because (expensive) controls are lacking
(Duffy, 1996).
Household appliances and office automation. Household
appliances and office equipment are well suited for technical standards and
labelling. Varone (1998) compared instruments used between 1973 and 1997 in
Canada, Denmark, Sweden, Switzerland, and the United States to promote
energy-efficient household appliances and office equipment. About 20 instruments
were identified (table 6.14). Various attempts have been made in the past 10
years to coordinate and harmonise policies at an international level. Some
analysts consider international cooperation to be the only real means for
inducing a market transformation in office equipment. Varone and Aebischer
(1999) prefer to keep a diversity of instruments in different countries - an
approach that allows for the testing of new instruments, offers the possibility
of testing diverse combinations of instruments, and takes advantage of political
windows of opportunity specific to each country (as with the Energy Star Program
for office equipment in the United States) (Geller, 1995).
Some developing countries (China, India) try to follow
OECD policies on technical standards and energy labelling. OECD governments
should be aware of this implication (box 6.13).
Small and medium-sized companies and public
administrations. Small and medium-sized companies and public administrations
are typical targets when several policy measures have to be taken
simultaneously: professional training, support for initial consulting by
external experts, demonstration projects to increase trust in new technical
solutions, energy agencies for several tasks (see above), and soft loans. These
companies and administrations are also affected by standards for labelling and
for cross-cutting technologies such as boilers and electrical motors and drives
(Bradbrook, 1992).
This policy mix seems to be successful for this target group in
almost all countries. In Russia and most Eastern European countries, energy
agencies are responsible for energy efficiency initiatives in end-use sectors.
These agencies are playing an important role, supported by energy service
companies that provide financial and technical assistance to realise the
identified potentials. Brazil and Mexico have also established national agencies
for energy efficiency (see box 6.8). With the privatisation of Brazilian
utilities, the new concessionaires are required to spend 1 percent of their
revenues (less taxes) on energy efficiency, with 0.25 percent specifically for
end-use efficiency measures.
Big enterprises and public administrations. Big
enterprises and public administrations have specialised staff and energy
managers, but they still need specific policy measures to achieve their economic
potential. The government of India occasionally uses expert committees to
develop policy recommendations. The reports of the committees include several
recommendations to encourage energy efficiency improvements (box 6.14). A
‘minister’s breakfast’ is a key tool for motivating top managers
of companies and administrations and for raising awareness of energy efficiency
potential. In addition, keynote speakers at the annual meetings of industrial
associations can help convey positive experiences with new efficient
technologies among the responsible middle managers.
|
BOX 6.13. FAST TRANSMISSION OF EFFICIENCY PROGRAMMES FROM
OECD TO DEVELOPING COUNTRIES: THE CASE OF EFFICIENT LIGHTING
Mexico was the first developing country to implement a
large-scale energy-efficient lighting programme for the residential sector. The
programme was funded by the Mexican Electricity Commission, ($10 million), the
Global Environment Facility ($10 million), and the Norwegian government ($3
million). Between 1995 and 1998 about 1 million compact fluorescent lamps were
sold in the areas covered by the programme. Use of the lamps avoided 66.3
megawatts of peak capacity and resulted in monthly energy savings of 30
gigawatt-hours. Given the lifetime of the efficient lamps, the impacts of the
programme are expected to last until 2006 (Padilla, 1999).
Economic evaluations show positive returns to households, the
power sector, and society. The programme, ILUMEX (Illumination of Mexico), has
also helped generate direct and indirect jobs, training and building indigenous
capacity to design and implement large-scale efficiency programmes (Vargas
Nieto, 1999). Smaller residential energy-efficient lighting programmes have been
introduced in other Latin American countries, including Bolivia, Brazil, Costa
Rica, Ecuador, and Peru. |
Local governments should consider using life-cycle costs and
increasing flexibility between investment and operating budgets. This move may
require changes in legislation in some countries.
TABLE 6.14. POLICIES TO INCREASE EFFICIENCY IN ELECTRIC
APPLIANCES AND OFFICE EQUIPMENT, VARIOUS OECD COUNTRIES
|
Area |
Canada |
Denmark |
Sweden |
Switzerland |
United States |
|
Household appliances |
Mandatory labelling (1978)
Standards (1992) |
Mandatory labelling (1982)
Standards (1994) |
Mandatory labelling (1976)
Technology procurement (1988)
|
Negotiated target values (1990)
Voluntary labelling (1990)
|
Voluntary labelling (1973)
Negotiated target values
(1975)
Mandatory labelling (1975)
Standards (1978)
Technology
procurement (1992) |
|
Office equipment |
|
|
|
Negotiated target values (1990)
Quality labelling
(1994)
Public purchasing (1994) |
Quality labelling (1992)
Public purchasing (1993) |
Source: Varone 1998, p. 143.
Transportation. Policies on road transportation may
include efficiency standards for vehicles imposed by national governments or
technical objectives achieved through voluntary agreements among car
manufacturers and importers (Bradbrook, 1994). Similar measures can be taken by
aeroplane, truck, and bus manufacturers. High fuel taxes in countries with low
taxation may support technical progress. A more systemic view relates to several
areas of transport systems and policy measures (IEA, 1997a):
· Subsidies for
mobility (such as for daily commuting, national airlines, or public urban
transport) increase the demand for transportation, especially road transport,
and should be removed where socially acceptable. An untaxed benefit for
employees driving a car bought by companies or institutions should also be
removed.
· Road user charges and parking
charges may reduce driving in cities, cut down on congestion and road accidents,
and shift some mobility to public transport. Car sharing also has implications
for car use and occupancy levels.
· It is possible to lower the
cost of public transport through automation and international procurement, as is
a better organisation of rail freight crossing national borders.
· In the long term, intelligent
city planning that does not divide an urban area by functions and related
sections creates substantial potential for reduced mobility.
|
BOX 6.14. ENERGY EFFICIENCY POLICY RECOMMENDATIONS BY
EXPERT COMMITTEES FOR COMPANIES IN INDIA
Technical and operational measures
· Detailed energy
audit should be made mandatory in all large and medium-sized enterprises.
· Potential cogeneration
opportunities should be identified and pursued by providing financial assistance
· Energy consumption norms
should be set for each industry type and penalties and rewards instituted based
on the performance of the industry.
Fiscal and economic measures
· Creation of an
energy conservation fund by levying energy conservation taxes on industrial
consumption of petroleum products, coal, and electricity.
· Customs duty relief on energy
conservation equipment.
Energy pricing
· Energy pricing
policies must ensure that sufficient surplus is generated to finance energy
sector investments, economical energy use is induced, and interfuel substitution
is encouraged.
Industrial licensing, production, and growth
· Before licenses
are given to new units, the capacity of existing units and the capacity use
factor should be taken into consideration.
· In setting up new units, the
technology should be the least energy-intensive option.
· The possibility of using waste
heat from power plants by setting up appropriate industries in the vicinity
should be considered.
Organisational measures
· The appointment of
energy managers in large and medium-sized industries should be mandatory. For
small-scale enterprises, a mechanism should be instituted for energy auditing
and reporting.
Energy equipment
· Better standards
should be set for energy-consuming equipment.
· Restrictions must be placed on
the sale of low-efficiency equipment.
· Manufacture of instruments
required to monitor energy flows must be encouraged. Imports of such instruments
and spare parts should be free of customs duty.
Research and development
· Each industrial
process should be reviewed to identify the research and development required to
reduce energy consumption.
· Research and development on
energy efficiency should be sponsored by the government as a distinct component
of the science and technology plan.
Other measures
· Formal training to
develop energy conservation expertise should be introduced in technical
institutions.
· The government should
recognise and honour individuals and organisations for outstanding performance
on energy conservation.
·
Efforts to raise awareness on energy conservation should be intensified. |
Source: Bhattacharjee, 1999.
In higher-income developing countries there are concerns
that a shift from fuel-efficient to fuel-inefficient transport is threatening
the oil security of these countries. To address these concerns, policies should
encourage a shift from road transport to subways and rail transport by reducing
travel times and increasing the costs of road transportation. These countries
should also search for new financing to replace old bus fleets.
Agriculture. Two main issues affect the energy efficiency
of agriculture in developing countries. The first is related to
subsidised electricity tariffs for this sector; the second is the use of highly
inefficient prime movers for agricultural pump sets and the ineffective
configuration in which they are often used. Increases in electricity tariffs
should be accompanied by free consultation by experts and an expansion of credit
and savings schemes to help rural people keep their energy costs at an
acceptable level. Efficient prime movers and appliances and organisational
measures in water use efficiency and irrigation management would help achieve
that goal.
Cogeneration. Liberalisation of the electricity market
may have different implications for cogeneration in different countries (Jochem
and T�nsing, 1998; AGFW, 2000). Earlier obstacles, such as low buyback rates and
high rates for maintenance and emergency power, are alleviated by competition.
But a legal framework for wheeling and public control seems to be necessary to
level the playing field, particularly during the adaptation phase of
liberalisation and for small and medium-size cogeneration plants of independent
power producers. Lack of expertise and the trend of outsourcing cogeneration
plants in industry can be addressed by supporting energy service companies with
training, standardised contracts for small units, and deductions on fuels for
cogeneration.
Maintaining energy-efficient cogeneration with district heating
in industrialised and transition economies requires determination, a
legal framework, technical and economic skills, and financial resources. Several
steps are needed to make or to keep centralised district heating systems
competitive:
· A possibility of
switching between fuels (lowering gas prices by switching to storable oil in the
coldest 100-200 hours of the winter) and using cheap fuel (‘puffer’
gas, coal, municipal solid waste, garbage incineration, sewage treatment
biogas).
· Proper and economic sharing of
heat generation between centralised heat units and peak load boilers, and an
increase in the electricity production planted on the given heat demand by
turning to higher parameters in the power-generating cycle (such as combined gas
and steam cycles).
· Better performance control of
the heating system, variable mass-flow in addition to temperature control in hot
water systems, lower temperatures in the heating system, and the use of heat for
cooling (through absorption techniques) to improve the seasonal load of the
system.
· One-by-one metering and price
collection for consumers in transition economies.
· A minimum buyback rate for
cogenerated electricity in the adaptation phase of liberalisation (AGFW,
2000).
Such a bundle of measures can assure the competitiveness of
other options and the realisation of the huge potential for cogeneration in
centralised heating systems.
In developing countries a lack of knowledge, capital, and
hard currency may constrain cogeneration investments. Thus policy measures and
incentives are often needed - and were recommended, for example, by a task force
in India in 1993. The Ministry of Non-Conventional Energy Sources launched a
national programme promoting bagasse-based cogeneration. The process of agreeing
on mutually acceptable buyback rates and wheeling of power by state electricity
boards is still under way, but there is hope that the institutional barriers
will give way to large-scale cogeneration, particularly in liberalised
electricity
markets.
International policy measures
The globalisation of many industrial sectors creates enormous
potential for improving energy efficiency at the global scale. Harmonising
technical standards for manufactured goods offers new opportunities for
economies of scale, lowering the cost of energy-efficient products. To avoid the
import of energy-inefficient products, governments, associations of importers,
and NGOs may consider negotiating efficiency standards for appliances and other
mass-produced products imported from industrialised countries. Imported
vehicles, used cars, buses, and trucks should not be more than five or six years
old (as in Bangladesh and Hungary). Similar rules could be introduced for major
imported and energy-intensive plants.
The Energy Charter Protocol on Energy Efficiency and Related
Environmental Aspects entered into force in April 1998. The protocol is legally
binding but does not impose enforceable obligations on nations to take specified
measures. It is a ‘soft law’ requiring actions such as:
· Formulating aims
and strategies for improving energy efficiency and establishing energy
efficiency policies.
· Developing, implementing, and
updating efficiency programmes and establishing energy efficiency bodies that
are sufficiently funded and staffed to develop and implement policies.
· Creating the necessary legal,
regulatory, and institutional environment for energy efficiency, with
signatories cooperating or assisting each other in this area.
The protocol received significant political support from the EU
Environmental Ministers Conference in June 1998. By December 1998, however, it
had only about 40 signatories, mainly Western European countries and transition
economies. Thus it has no world-wide support (Bradbrook, 1997).
|
The globalisation
of many industrial sectors
creates
enormous potential for
improving energy efficiency
at the global scale.
|
Commitments to the Kyoto Protocol by Annex B countries are a
major driver of energy efficiency, as about 70 percent of these countries’
greenhouse gas emissions are related to energy use. Although energy efficiency
is a major contributor for achieving the targets of the protocol, there are few
references to it in the text of the document. Ratification of the protocol and
implementation of the flexible instruments will be important for developing
policy awareness in industrialised countries of the substantial potential that
improved energy efficiency offers for meeting the objectives.
Better air traffic management will likely reduce aviation fuel
burn by some 10 percent if fully implemented in the next 20 years - provided the
necessary international regulatory and institutional arrangements have been put
in place in time. Stringent aircraft engine emission and energy efficiency
regulations or voluntary agreements among airlines can expedite technological
innovations. Efforts to remove subsidies, impose environmental levies (charges
or taxes), and promote emissions trading could be negotiated at the
international level (IPCC, 1999b). These economic policies - though generally
preferred by industry - may be highly
controversial.
Conclusion
As the long-term potential for energy efficiency reduces useful
energy demand and the proceeding levels of energy conversion, future energy
policy of most countries and on the international level will have to broaden
substantially its scope from energy supply to energy services. This kind of
policy will be much more demanding in designing target group-specific and
technology-specific bundles of policy measures. But the success of this new
policy process will be worth the effort from the economic, social and
environmental perspective.
Notes
1. Lee Schipper was the lead author of this section.
2. Eberhard Jochem was the lead author of this box.
3. Inna Gritsevich and Eberhard Jochem were the lead authors of
this section.
4. Anthony Adegbulugbe was the lead author of this section.
5. Somnath Bhattacharjee was the lead author of this section.
6. Eberhard Jochem was the lead author of this section.
7. Eberhard Jochem was the lead author of this box.
8. Bernard Aebischer and Eberhard Jochem were the lead authors
of this section.
9. Ernst Worrell, Allen Chen, Tim McIntosch, and Louise Metirer
were the lead authors of this section.
10. This means that the cost-effective potential is probably
equivalent to the microeconomic potential (see the introduction to the section
on potential economic benefits).
11. The estimates of the economic potential are based on supply
curves for each sector developed by Bailie and others (1998). It is unclear what
discount rate was used to estimate the economic potential. Hence we cannot
determine if the study estimates a microeconomic or macroeconomic potential (see
box 6.2).
12. It is unclear what discount rate was used to estimate the
economic potential. In some economic assessments in this report a discount rate
of 50 percent is used for investments in the transportation sector.
13. Bidyut Baran Saha and David Bonilla were the lead authors of
this section.
14. Tamas Jaszay was the lead author of this section.
15. Inna Gritsevich was the lead author of this section.
16. Somnath Bhattacharjee was the lead author of this section.
17. Fengqi Zhou was the lead author of this section.
18. Gilberto M. Jannuzzi was the lead author of this section.
19. Anthony Adegbulugbe was the lead author of this section.
20. Eberhard Jochem was the lead author of this section.
21. Eberhard Jochem was the lead author of this section.
22. Eberhard Jochem was the lead author of this section.
23. Jean Pierre Des Rosiers was the lead author of this section.
24. Inna Gritsevich and Tamas Jaszay were the lead authors of
this section.
25. Somnath Bhattacharjee, Gilberto Jannuzzi, and Fengqi Zhou
were the lead authors of this section.
26. Eberhard Jochem was the lead author of this section.
27. Eberhard Jochem was the lead author of this section.
References
ADB (Asian Development Bank), GEF (Global Environment Facility),
and UNDP (United Nations Development Programme). 1998. “Asia Least Cost
Greenhouse Gas Abatement Strategy.” Manila, Philippines.
Adegbulugbe, A.O. 1992a. “The Energy-Environment Nexus: The
Role of Energy Efficiency.” In Energy Issues in Nigeria: Today and
Tomorrow. Proceedings of a conference held at the Nigerian Institute of
International Affairs, Victoria Island, Lagos.
Adegbulugbe, A.O., ed. 1992b. “Energy for Tomorrow’s
World: The Realities, the Real Options and the Agenda for Achievement.”
Sub-Saharan Africa Regional Report. Presented at the 15th World Energy
Council Congress, Madrid.
Adegbulugbe, A.O. 1993. “Energy Efficiency in Industry: A
Regional Perspective.” In S. Karekezi and G.A. Mackenzie, eds., Energy
Options for Africa: Environmentally Sustainable Alternatives. London: Zed
Books.
Adi Cahyono A. 1999. Personal communication. Ministry for Mines
and Energy, Indonesia.
Aebischer, B., J. Schwarz, and D. Spreng. 1996.
“Perspectives of Energy Demand of the Tertiary Sector: Scenarios I to III,
1990-2030 [in German].” Federal Office of Energy, Bern, Switzerland.
AGFW (Arbeitsgemeinschaft Fernw�rme). 2000. “ Strategien
und Technologien einer pluralistischen Fern- und Nahw�rmeversorgung in einem
liberalisierten Energiemarkt unter besonderer Ber�cksichtigung der
Kraft-W�rme-Kopplung und erneuerbaren Energien.” Studie
Kurzzusammenfassung, Frankfurt.
Aim Project Team. 1994. “An Energy Technology Model for
Forecasting Carbon Dioxide Emissions in Japan [in Japanese].” Report
F-64-94. National Institute for Environmental Studies.
ALGAS, 1998. Asian Least-Cost Greenhouse Gas Abatement Study.
Tokyo, Japan.
Almeida, A., P. Bertoldi, and W. Leonhard, eds. 1997. Energy
Efficiency Improvements in Electric Motors and Drives. Berlin: Springer.
Alnakeeb, H. 1998. “Co-generation Potential in Egyptian
Industry.” Organization for Energy Consumption and Planning, Cairo.
Alnakeeb, H., M. El Gazzar, and M. Emam. 1998. “Demand Side
Management of Efficient Lighting: A Case Study of an Administrative
Building.” Organization for Energy Consumption and Planning, Cairo.
Altner, G., H.-P. D�rr, and G. Michelsen. 1995. Zuk�nftige
Energiepolitik: Vorrang f�r rationelle Energienutzung und regenerative
Energiequellen [Future Energy Policy Priority for Energy Efficiency and
Renewables]. Bonn: Economica Verlag.
Ameling, D., and others. 1998. “Coke Production Technology
in 2000: The State of the Art and New Structures [in German].” Eisen und
Stahl 118 (11): 55-61.
Angerer, G. 1995. “Auf dem Weg zu einer �kologischen
Stoffwirtschaft. Teil I: Die Rolle des Recycling.” GAIA 4 (2): 77.
Arbeitsgemeinschaft. 1992. “Arbeitsgemeinschaft Amstein
& Walthert und Intep AG. Methode zur Optimierung des
Elektrizit�tsverbrauchs. Sparpotentiale beim Elektrizit�tsverbrauch von zehn
ausgew�hlten art-typischen Dienstleistungsbetrieben.” Schlussbericht.
Bundesamt f�r Energie, Bern.
ARENA-ECO (Agency for Rational Energy Use and Ecology). 1997.
Ukraine: On the Way to Energy Efficiency. Kiev, Ukraine.
Argentina Secretaria de Energ�a. 1997. “Prospectiva del
sector el�ctrico 1997 [in Spanish].” [https://www.mecon.ar/energia/].
Argentina Secretaria de Energ�a. 1998a. “Balances
energ�ticos [in Spanish].” [http://energia.mecon.
gov.ar/Balances%20/Energeticos/balances.asp].
Argentina Secretaria de Energ�a. 1998b. “Cogeneraci�n de
energ�a: Analisis sectoriales [in Spanish].”
[https://www.mecon.ar/energia/ure/anlisis.htm].
Argentina Secretaria de Energ�a. 1998c. “Cogeneraci�n de
energ�a en el sector industrial [in Spanish].”
[http://energia.mecon.ar/ure/oportunidades.htm].
Argentina Secretaria de Energ�a. 1998d. “Cogeneraci�n de
energ�a en el sector terci�rio [in Spanish].”
[http://energia.mecon.ar/ure/].
Argentina Secretaria de Energ�a. 1998e. “Equipos para
conservaci�n de alimentos en hogares [in Spanish].”
[http://energia.mecon.ar/ure/oportunidades.htm].
Argentina Secretaria de Energ�a. 1998f. “Uso racional de la
energ�a en el sector transporte [in Spanish].”
[http://energia.mecon.ar/ure/anlisis.htm].
ATLAS Report Compendium of Technology Modules. 1997.
“Industry: Energy Technology Information Base 1980-2010.” European
Commission, Brussels.
Ayres, R. 1996. Industrial Ecology: Towards Closing the
Materials Cycle. London: Edward Elgar.
Bailie, A., B. Sadownik, A. Taylor, M. Nanduri, R. Murphy, J.
Nyboer, M. Jaccard, and A. Pape. 1998. “Cost Curve Estimations for Reducing
CO2 Emissions in Canada: An Analysis by Province and Sector.”
Simon Fraser University, Energy Research Group, Vancouver, Canada.
Bandala, A. 1995. “Importance of the Mexican Lighting
Systems in Commerce and Services.” Proceedings of the third European
Conference on Energy-Efficient Lighting, Newcastle upon Tyne, England.
Bashmakov, I. 1997a. “Heat, Money and Housing Reform.”
Energy Efficiency 14 (January-March).
Bashmakov, I. 1997b. “Strengthening the Russian Economy
through Climate Change Policies.” Energy Efficiency Bulletin 17.
Centre for Energy Efficiency, Moscow.
Bashmakov, I., I. Gritsevich, and S. Sorokina. 1996.
“System of Institutional Measures to Stimulate Energy Efficiency in Russia
as Part of the GHG Mitigation Strategy.” Report to the Country Study
Program. Centre for Energy Efficiency, Moscow.
Baumgartner, W., and C. Muggli. 1996. “Perspectives of
Energy Demand of the Industrial Sector: Scenarios I to III, 1990-2030 [in
German].” Federal Office of Energy, Bern, Switzerland.
Baxter, L.W. 1995. “Assessment of Net Lost Revenue
Adjustment Mechanisms for Utility DSM Programs.” Oak Ridge National
Laboratory, Oak Ridge, Tenn.
BEA (Bureau of Economic Analysis). 1998. “Survey on
Economic Policy in Russia in 1997.” Moscow.
Beer, de, Jeroen. 1998. “Potential for Industrial Energy
Efficiency Improvement in the Long Term.” PhD. diss. University of Utrecht,
Netherlands.
Bernadini, R. 1993. “Dematerialization: Long-term Trends in
the Intensity of Use of Materials and Energy.” Futures 25: 431-47.
Bhattacharjee, S. 1999. Personal communication. Tata Energy
Research Institute, Mumbai, India.
Blanc, A., and O. de Buen. 1994. “Residential Lighting
Efficiency in Mexico: The Road to ILUMEX.” In Proceedings of the ACEEE
Summer Study on Energy Efficiency in Buildings. Asilomar, Calif.: American
Council for an Energy-Efficient Economy.
Blok, K., W.C. Turkenburg, W. Eichhammer, U. Farinelli, and T.B.
Johansson. 1996. “Overview of Energy RD&D Options for a Sustainable
Future.” European Commission, Luxembourg.
B�de, U., and others. 1999. “Efficient Energy Use: A
Literature Survey [in German].” BWK 86 (4): 86-90.
Boardman, B., T. Fawcett, H. Griffin, M. Hinnels, K. Lane, and
J. Palmer. 1997. “DECADE: Domestic Equipment and Carbon Dioxide
Emissions.” University of Oxford, Energy and Environment Program.
Borisova, I., and others. 1997. “Energy Intensity of
Russian Economy.” Problems of Forecasting 6: 11-36.
Bradbrook, A. 1991. “The Development of Energy Conservation
Legislation for Private Rental Hosing.” Environmental and Planning Law
Journal 8 (2): 91-1107.
Bradbrook, A. 1992. “Energy Conservation Legislation for
Industry.” Journal of Energy and Natural Resources Law 1 (2):
145-63.
Bradbrook, A. 1994. “Regulation for Fuel Efficiency in the
Road Transportation Sector.” Australian Journal of Natural Resources Law
and Policy 1 (1): 1-31.
Bradbrook, A. 1997. “Energy Efficiency and the Energy
Charter Treaty.” Environmental and Planning Law Journal 14 (5):
327-40.
Brechb�hl B. 1992. “Energiesparma�nahmen in L�ftungsanlagen
mittels adaptiver Einzelraumregulierung.” Proceedings of an international
symposium on Energy for Urban Areas, August 25-26, Z�rich.
Brewer, W.M., and S.F. Lopez. 1998. “Successful Closed-loop
Olefins Plant Optimisation.” Hydrocarbon Processing 6: 83-89.
Brown, M., M. Levine, J. Romm, and A. Rosenfeld. 1998.
“Engineering Economic Studies of Energy Technologies to Reduce Greenhouse
Gas Emissions: Opportunities and Challenges.” Annual Review of Energy
and the Environment 23.
Brunner, C.U., and R. Gartner. 1999. Energieeffizienz im
Schienenverkehr. Neue Eisenbahnkonzepte senken den Energieverbrauch um 50%.
Bulletin SEV/VSE 11/99.
CADDET (Centre for the Analysis and Dissemination of
Demonstrated Energy Technology). 1997. “International Data on Successfully
Demonstrated Energy Efficiency Projects.” Sittard, Netherlands.
Carter, A.P. 1996. “The Economics of Technological
Change.” Scientific American 214: 25-31.
Cavaliero, C.K.N. 1998. “Redu��o das Emiss�es de
CO2 do Segmento Sider�rgico Nacional atrav�s da Inje��o de
Combust�vel Auxiliar em Alto Forno: Estudos de Casos na Acesita e Cosipa.”
Planejamento de Sistemas Energ�ticos thesis. Universidade Estadual de Campinas
(UNICAMP), Faculdade de Engenharia Mec�nica, Brazil.
CENEf (Centre for Energy Efficiency). 1993. Energy Efficiency
Potential and Strategy for Russia [in Russian]. Moscow.
CENEf (Centre for Energy Efficiency). 1998. Russian Energy
Picture Statistical Yearbook. Moscow.
CIECC (China International Engineering Consultant Corporation).
1997. “Comparison between China and Foreign Countries on Unit Energy
Consumption of Energy Intensive Industries.” State Development Planning
Commission, Beijing.
CII (Confederation of Indian Industry). 1994. “Specific
Energy Consumption Norm in Indian Pulp and Paper Industry.” CII Energy
Summit, Madras.
Cleveland, C.J., and M. Ruth. 1999. “ Indicators of
Dematerialization and the Materials Intensity of Use.” Journal of
Industrial Ecology 3 (3): 15-50.
CMIE (Centre for Monitoring the Indian Economy). 1996.
India’s Energy Sector. Mumbai, India.
CMIE (Centre for Monitoring the Indian Economy). 1997.
“Approach Paper to Ninth Five-year Plan.” Mumbai, India.
CODA. 1989. “Household Energy Planning Programme
(HEPP).” Uganda, Ministry of Energy, Kampala.
Dadhich P., and B. Bhatia. 1994. “Co-generation - A DSM
Option for India.” Energy and Environment Monitor 10 (1): 27-34.
Dasgupta, N. 1999. “Energy Efficiency and Environmental
Improvements in Small Scale Industries: Present Initiatives in India Are Not
Working.” Energy Policy 27 (13): 789-800.
Davidson, O., and S. Karekezi. 1991. “A New
Environmentally-Sound Energy Strategy for the Development of Sub-Saharan
Africa.” AFREPREN, Nairobi, Kenya.
Davidson, O.R., A.M. Al-Shatti, and A.O. Adegbulugbe. 1991.
“CO2 Emissions from Developing Countries: Better Understanding
the Role of Energy in the Long Term.” Lawrence Berkeley Laboratory Report
30061 UC-350. Berkeley, Calif.
Davis, S. 1997. “Transportation Energy Data Book Edition
17.” Oak Ridge National Laboratory, Oak Ridge, Tenn.
DeCanio, S.J. 1993. “Barriers within Firms to
Energy-Efficient Investments.” Energy Policy 21: 906-14.
Diekmann, J., and others. 1999. “Energy Efficiency
Indicators: Statistical Bases, Theoretical Foundation, and Basis for Orientation
in Policy Practice [in German].” Physica-Verlag, Heidelberg
Dobozi, I. 1991. “Impacts of Market Reforms on USSR Energy
Consumption.” Energy Policy 19 (4): 303-24.
Duffy J. 1996. “Energy Labelling Standards and Building
Codes: A Global Survey and Assessment for Selected Developing Countries.”
International Institute for Energy Conservation, Washington, D.C.
Dutt, G., and C. Tanides. 1994. “Potencial de Uso Eficiente
de la Energ�a El�ctrica: Una Primera Aproximaci�n.” Proceedings of Actas de
la 17ª Reuni�n de Trabajo de la Asociaci�n Argentina de Energ�a Solar,
Rosario, Argentina.
Dutt, G., C. Tanides, and M. Brugnoni. 1996. “DSM
(Demand-Side Management) y Empresas Distribuidoras en Mercados Desregulados:
Possibilidades para Argentina.” Proceedings of the International Conference
on Electricity Distribution, Buenos Aires, Argentina.
EC (European Commission). 1999a. Energy in Europe: Energy
Outlook 2020. Special issue. Brussels.
EC (European Commission). 1999b. Foundations of Energy
Policy:Energy in Europe: Special Issue. Brussels.
EC (European Commission). Various years. Energy in Europe:
Annual Energy Review. Special issue. Brussels.
ECODROME. 1998. “Etude experimentale des appareils
electrom�nagers � haute �fficacit� �n�rg�tique places en situation reelle.”
SAVE programme 4.1031./S/94-093. Auteur Cabinet Olivier Sidler. Partenaire:
DGXVII, ADEME, OSRAM, Groupe Brant, Electrolux, Liebher.
EIA (Energy Information Agency). 1996. Annual Energy Outlook
1997: With Projections to 2015. DOE/EIA-0383 (97). Washington, D.C.: U.S.
Department of Energy.
EIA (Energy Information Agency). 1999a. “Country Profile:
Argentina.” [https://www.eia.doe.gov/ emeu/cabs/argentna.html].
EIA (Energy Information Agency). 1999b. “Energy in the
Americas.” [https://www.eia.doe.gov/ emeu/cabs/theamerics].
Enqu�te Commission (German Bundestag). 1991. Protecting the
Earth: A Status Report with Recommendations for a New Energy Policy. vol. 2.
Bonn: Bonner University Press.
ETSU (Energy Technical Support Unit). 1994. “An Appraisal
of UK Energy Research, Development, Demonstration and Dissemination.” Her
Majesty’s Stationery Office, London.
Farla, J.C.M., and K. Blok. 1995. “Energy Conservation
Investment Behaviour of Firms: Business as Usual?” In Proceedings of the
1995 ECEEE Summer Study: Sustainability and the Reinvention of the Government -
A Challenge for Energy Efficiency. Stockholm.
Faruaui, A., M. Mauldin, S. Schick, K. Seiden, and G. Wilder.
1990. “Efficient Electricity Use: Estimates for Maximum Energy
Savings.” Prepared by Barakat & Chamberlin, Inc. for the Electric Power
Research Institute, Palo Alto, Calif.
Fesharaki, F. 1998. “Asia As the Center of Gravity of the
World Energy System.” Energy: The International Journal 19 (4):
85-105.
Fisher, A., and C. Rothkopf. 1989. “Market Failure and
Energy Policy.” Energy Policy 17: 397-406.
Friedmann, R. 1994. “Saving Electricity in Mexican Homes:
Potential and Accomplishments to Date.” In Proceedings of the ACEEE
Summer Study on Energy Efficiency in Buildings. Asilomar, Calif.: American
Council for an Energy-Efficient Economy.
Friedrich, R., and W. Krewitt. 1997. Umwelt- und
Gesundheitssch�den durch die Stromerzeugung. Heidelberg/Berlin: Springer.
Gardner, G.T., and P.C Stern. 1996. Environmental Problems
and Human Behaviour. Needham Heights, Mass.: Allyn and Bacon.
GEA (Group for Efficient Appliances). 1995. Washing Machines,
Dryers and Dishwashers. Final Report. European Energy Network Working Group.
Copenhagen: Danish Energy Agency.
Geiger, B., W. Eichhammer, E. Gruber, D. K�wener, H. Kottmann,
W. Mannsbart, U. Mielicke, M. Patel, and D. Saage. 1999. Energieverbrauch und
Energieeinsparung in Handel, Gewerbe und Dienstleistung. Heidelberg:
Physica-Verl.
Geller, H. 1995. National Appliance Efficiency Standards:
Cost-effective Federal Regulations. Washington D.C.: American Council for an
Energy-Efficient Economy.
Geller, H., G. M. Jannuzzi, R. Schaeffer, and M. T. Tolmasquim.
1998. “The Efficient Use of Electricity in Brazil: Progress and
Opportunities.” Energy Policy 26 (11): 859-72.
Geller, H., P. Leonelli, R. Abreu, I. Ara�jo, and H. Polis.
1997. “Energy-Efficient Lighting in Brazil: Market Evolution, Electricity
Savings and Public Policies.” In Proceedings of the Fourth European
Conference on Energy-Efficient Lighting. Copenhagen: International
Association of Energy-Efficient Lighting.
German Statistical Office, various years. Statisches
Jahrbuch. Wiesbaden, Germany.
Gnedoy, N. 1998. “Energy Situation in Ukraine.”
Industrial Energy 5: 10-14.
Gnedoy, N. 1983. “Inter Ministerial Working Group Report on
Utilisation and Conservation of Energy.” New Delhi.
Gnedoy, N. 1985. “Report of the Advisory Board on
Energy.” New Delhi.
Gnedoy, N. 1994. “Consultancy Capabilities in Energy
Conservation and Management for the Industrial Sector in India.” New Delhi.
Gnedoy, N. 1995. “State Electricity Boards and Electricity
Departments.” Planning Commission, Power and Energy Division, New Delhi.
Gnedoy, N. 1996. Ninth Plan Document (1997-2002). New
Delhi.
Gnedoy, N. 1997. “Handbook of Industrial Policy and
Statistics.” Ministry of Industry, Office of the Economic Adviser, New
Delhi.
Golove, W. 1994. “Are Investments in Energy Efficiency Over
or Under: An Analysis of the Literature.” In Proceedings of the 1994
ACEEE Summer Study on Energy Efficiency in Buildings. Asilomar, Calif.:
American Council for an Energy-Efficient Economy.
Goscomstat of Russia. 1996. Industry of Russia. Moscow.
Goscomstat of Russia. 1997. Russian Statistical Yearbook.
Moscow.
Goto, N. 1996. “Macroeconomic and Sectoral Impacts of
Carbon Taxation: A Case Study for the Japanese Economy.” In A. Amano, ed.,
Global Warming, Carbon Limitation and Economic Development. National
Institute for Environmental Studies and Environment Agency of Japan, Centre for
Global Environmental Research, Tokyo.
Goushin, S., and G. Stavinski. 1998. “Case of
Implementation of Energy Saving Technologies at Kirishi Refinery Plant
‘Kirishinefteorgsyntez’.” Energomeneger 12: 20-23.
Greene, David, 1998. “Why CAFE Worked.” Energy
Policy 26 (8): 595-613.
Gritsevich, I. 1993. “Energy Conservation Problem under
Conditions of Transition to Market Economy.” Economics and Mathematical
Methods 29 (2): 209-16.
Gritsevich, I., Y. Dashevsky, and V. Zhuze. 1997.
“Prospects for Western Technologies in Improving District Heating Energy
Efficiency in Russia.” In Greenhouse Gas Mitigation: Technologies for
Activities Implemented Jointly. Proceedings of the International Conference
on Technologies for Activities Implemented Jointly, May, Vancouver, Canada.
Gruber, E., and M. Brand. 1991. “Promoting Energy
Conservation in Small and Medium-sized Companies.” Energy Policy
279-87.
Hagler Bailly Services, Inc. 1997. “The Energy Efficiency
Market in Developing Countries: Trends and Policy Implications.” Business
Focus Series. U.S. Agency for International Development, Office of Energy,
Environment, and Technology, Washington, D.C.
Hallenga, R.J., and I.C. Kok. 1998. “Inventory of Office
Equipment Energy Efficiency.” Report 98 PO/PRO 606. TNO Institute of
Industrial Technology. Delft, Netherlands.
Hassett, K.A., and G.E. Metcalf. 1993. “Energy Conservation
Investment: Do Consumers Discount the Future Correctly?” Energy Policy
21: 710-16.
Hennicke, P., and others. 1995. “Integrierte
Ressourcenplanung.” Die LCP-Fallstudie der Stadtwerke Hannover AG.
Ergebnisband, Hannover, Germany.
Hennicke, P., and others. 1998. “Interdisciplinary Analysis
of Successful Implementation of Energy Efficiency in the Industrial, Commercial
and Service Sectors.” Final report. Copenhagen, Karlsruhe, Kiel, Vienna,
Wuppertal.
Hicks, T.W., and D.W. Clough. 1998. “The ENERGY STAR
Building Label: Building Performance through Benchmarking and Recognition.”
In Proceedings of the ACEEE Summer Study on Energy Efficiency in Buildings.
Asilomar, Calif.: American Council for an Energy-Efficient Economy.
Hiessl, H., F. Meyer-Krahmer, and M. Sch�n. 1995. “Auf dem
Weg zu einer �kologischen Stoffwirtschaft. Teil II: Die Rolle einer
ganzheitlichen Produktpolitik.” GAIA 4 (2): 89.
Hinterberger, F., F. Luks, and F. Schmidt-Bleek. 1997.
“Material Flows versus ‘Natural Capital’: What Makes an Economy
Sustainable?” Ecological Economics 23: 1-14.
Hirst, E. 1991. “Improving Energy Efficiency in the USA:
The Federal Role.” Energy Policy 19 (6): 567-77.
Hohmeyer, O., R.L. Ottinger, and K. Rennings, eds. 1997.
Social Costs and Sustainability: Valuation and Implementation in the Energy
and Transport Sector. Berlin/Heidelberg: Springer.
Hu, X. 1997. “Chart for Energy System Network of China and
Energy Efficiency Study Report.”
Hu, X., and K. Jiang. 1997. “The Structure and Simulation
Results Analysis of China AIM Energy Emission Model.”
Huang, J., and others. 1998. “A Commercial Building Energy
Standard for Mexico.” In Proceedings of the ACEEE Summer Study on Energy
Efficiency in Buildings. American Council for an Energy-Efficient Economy,
Asilomar, Calif.
IEA (International Energy Agency). 1987. Energy Conservation
in IEA Countries. Paris.
IEA (International Energy Agency). 1991. Energy Efficiency
and the Environment. Paris.
IEA (International Energy Agency). 1995. Energy Policies of
the Russian Federation. Paris.
IEA (International Energy Agency). 1997a. Energy Efficiency
Initiative. vol. 1. Paris
IEA (International Energy Agency). 1997b. Energy Efficiency
Initiative. vol. 2. Paris.
IEA (International Energy Agency). 1998. Energy Statistics
and Balances of Non-OECD Countries, 1995-1996. Paris.
IEA (International Energy Agency). 1999. Energy Policies of
IEA Countries: Hungary 1999 Review. Paris.
IIEC (International Institute of Energy Conservation). 1995.
Asian Energy Efficiency Success Stories. Washington D.C.
IIP (Indian Institute of Petroleum). 1995. State of the Art
Report on Vehicular Pollution.
Interlaboratory Working Group on Energy Efficient and Low-Carbon
Technologies. 1997. “Scenarios of U.S. Carbon Reductions: Potential Impacts
of Energy Technologies by 2010 and Beyond.” Lawrence Berkeley National
Laboratory, Berkeley, Calif.
IPCC (Intergovernmental Panel on Climate Change). 1995.
Second Assessment Report. Cambridge: Cambridge University Press.
IPCC (Intergovernmental Panel on Climate Change). 1999a.
Aviation and the Global Atmosphere. Cambridge: Cambridge University
Press.
IPCC (Intergovernmental Panel on Climate Change). 1999b.
Methodological and Technological Issues in Technology Transfer.
Cambridge: Cambridge University Press.
IPSEP (International Project for Sustainable Energy Paths).
1995. “Negawatt Power: The Cost and Potential of Efficiency Resources in
Western Europe.” Part 3B in Energy Policy in the Greenhouse, vol.
II. El Cerrito, Calif.
Ishiguro, M., and T. Akiyama. 1995. Energy Demand in Five
Major Asian Developing Countries: Structure and Prospects. World Bank
Discussion Paper 277. Washington, D.C.
Jaccard, M.K., and Willis Energy Services. 1996.
“Industrial Energy End-Use Analysis & Conservation Potential in Six
Major Industries in Canada.” Natural Resources Canada, Ottawa.
Jaenicke M. 1998. “Towards an End to the ‘Era of
Materials’? Discussion of a Hypothesis.” Forschungsstelle f�r
Umweltpolitik, Berlin.
Jannuzzi, G.M. 1998. “A Sectoral Review of Energy in
Brazil: Supply and Demand and Opportunities for Reducing Carbon Emissions.”
M. Kaplan. Denver, Colorado, Institute for Policy Research and Implementation,
Graduate Studies of Public Affairs, University of Colorado at Denver and C�mara
de Com�rcio Brasil-Estados Unidos.
JISF (Japan Iron and Steel Federation). 1993. “Energy
Efficient Measures and Energy Reduction in Integrated Steel Mills in Japan [in
Japanese].” Tokyo.
Jochem, E., 1991. “Long-Term Potentials of Rational Energy
Use - The Unknown Possibilities of Reducing Greenhouse Gas Emissions.”
Energy Environment 2 (1): 31-44.
Jochem, E., and H. Bradke.1996. Energieeffizienz, Strukturwandel
und Produktionsentwicklung der deutschen Industrie: IKARUS. Instrumente f�r
Klimagas-Reduktionsstrategien. Abschlu�bericht Teilprojekt 6
“Industrie”. J�lich: Forschungszentrum J�lich, Zentralbibliothek,
Germany.
Jochem, E., and E. Gruber. 1990. “Obstacles to Rational
Electricity Use and Measures to Alleviate Them.” Energy Policy 18
(5): 340-50.
Jochem, E., and O. Hohmeyer. 1992. “The Economics of
Near-Term Reductions in Greenhouse Gases.” In J.M. Mintzer, ed.,
Confronting Climate Change. Cambridge: Cambridge University Press.
Jochem, E., and E. T�nsing. 1998. “The Impact of the
Liberalisation of Electricity and Gas Supply on Rational Energy Use in Germany
[in German].” UWF 6 (3): 8-11.
Jochem, E., J. Sathaye, and D. Bouille, eds. 2000. Society,
Behaviour, and Climate Change Mitigation. Kluwer: Dordrecht, Netherlands.
Kashiwagi, T. 1994. “Industrial Energy Efficiency Policies
and Programmes.” Presented at the International Energy Agency International
Workshop, May 26-27, Washington D.C.
Kashiwagi, T. 1995: “Second Assessment Report of the
Intergovernmental Panel on Climate Change.” Cambridge: Cambridge University
Press.
Kashiwagi, T. 1999. “The Future Vision of Urban Energy
Systems by the Introduction of Polymer Electrolyte Fuel Cell Technology.”
Osaka Research and Development Forum, Japan.
Kashiwagi T., B.B. Saha, and A. Akisawa. 1998.
“Technological Breakthrough for the Environmental Issues in Japan.”
Japan Society of Mechanical Engineers News 9 (1): 3-10.
Kaya, Y., Y. Fujii, R. Matsuhashi, K. Yamaji, Y. Shindo, H.
Saiki, I. Furugaki, and O. Kobayashi. 1991. “Assessment of Technological
Options for Mitigating Global Warming.” Paper presented to the Energy and
Industry Subgroup, WG 3 of IPCC, August, Geneva.
Kishimba, M., and F. Musomba. 1996. “Production of Energy
from Biomass and Biomass Waste.” African Energy Policy Research Network
Working Paper 103.
Kos, M. 1999. “Energy Efficiency in Post-Communist
Countries.” Written communication. Ljubljana, Slovenia.
Krause, F. 1996. “The Costs of Mitigating Carbon Emissions:
A Review of Methods and Findings from European Studies.” Energy Policy,
Special Issue on the Second UN IPCC Assessment Report, Working Group III, 24
(10/11): 899-915.
Krawczynski, F., and J. Michna. 1997. “Effektivit�t
westlicher Hilfe im Energiesektor.” Energiewirtschaftliche Tagesfragen
47(1/2): 23.
Kretinina, Yu., A. Nekrasov, and S. Voronina. 1998. “Energy
Price for Population.” Studies on Russian Economic Development (6):
44-55.
Kuldip, K., and others. 1995. “Energy Conservation in
Agricultural Pumping Systems.” Proceedings of the National Workshop on
Energy Conservation, September 8-9, New Delhi.
Laitner, S., St. Bernow, and J. DeCicco. 1998. “Employment
and Other Macroeconomic Benefits of an Innovation-led Climate Strategy for the
United States.” Energy Policy 26 (5): 425-32.
Lapir, M. 1997. “On Energy Saving Activities in the City of
Moscow [in Russian].” Industrial Energy (9): 7-10.
Levine, M.D., and R. Sonnenblick. 1994. “On the Assessment
of Utility Demand-side Management Programs.” Energy Policy 22.
Levine, M.D., E. Hirst, J.G Koomey, J.E. McMahon, and A.H.
Sanstad. 1994. “Energy Efficiency, Market Failures, and Government
Policy.” Lawrence Berkeley National Laboratory, Berkley, Calif.; and Oak
Ridge National Laboratory, Oak Ridge, Calif.
Levine, M.D., J. Koomey, J. McMahin, A. Sanstad, and E. Hirst.
1995. “Energy Efficiency Policies and Market Failures.” Annual
Review of Energy and the Environment 20: 535-55.
Levine, M.D., A. Gadgil, S. Meyers, J. Sathaye, J. Stafurik, and
Wilbanks. 1991. “Energy Efficiency, Developing Nations and Eastern
Europe.” A report to the U.S. Working Group on Global Energy Efficiency,
Lawrence Berkeley Lab, Berkeley, Calif.
Livinski, A., 1998. “On Energy Saving Activities in
Russia.” Energomeneger (10): 4-6.
Lovins, A., and P. Hennicke. 1999. “Voller Energie [in
German; Full of Energy].” Campus Frankfurt/N.Y.
MACEBUR. 1998. “Energy-Efficient Office Technologies: The
One Watt-One Ampere Challenge.” European Commission. Contract No
XVII/4.1301/s/94-87. Brussels.
Machado, A.C., and R. Shaeffer. 1998. “Estimativa do
Potencial de Conserva��o de Energia El�trica Pelo Lado da Demanda no
Brasil.” PROCEL/COPPETEC/ PNUD BRA/93/032, COPPE, Rio de Janeiro.
Mengistu T. 1995. “Energy in the Transport Sector: The Case
of Ethiopia.” African Energy Policy Research Network Newsletter 19.
M�xico Secretar�a de Energ�a. 1997. “Prospectiva Del Sector
El�ctrico 1996-2006.” Mexico City.
Michna, J., 1994. “Energy Conservation during the
Transition Period. Special Issue on Central and Eastern European Energy
Policy.” International Journal of Global Energy Issues 6: 183- 90.
Mintopenergo. 1996. “Federal Target Programme of
Development of Manufacturing of Certified Metering Devices and System and
Equipping Customers in 1996-2000.”
Moloduik, V. 1997a. “ Main Directions of Restructuring
Natural Monopolies in Fuels and Energy Complex.” Energomeneger 8:
6-8.
Moloduik, V. 1997b. “ Problems of Electricity Tariffs
Regulation.” Energomeneger 6: 14- 17.
Morovic, T. 1989. Energy Conservation Indicators II.
Heidelberg, N.Y.: Springer.
Moscow Government. 1997. “Moscow City Energy Saving
Programme in 1998-2003.” Moscow.
Mungwititkul W., and B. Mohanty. 1997. “Energy Efficiency
of Office Equipment in Commercial Buildings: The Case of Thailand.”
Energy The International Journal 22 (7): 673-80.
Nadel, S., V. Kothari, and S. Gopinath. 1991.
“Opportunities for Improving End-use Electricity Efficiency in India.”
American Council for an Energy-Efficient Economy, Washington, D.C.
National Energy Efficiency Agency at the Council of Ministers of
Bulgaria. 1998. “National Energy Efficiency Program of Bulgaria.”
Sofia, Bulgaria.
Natural Resources Canada. 1998. “Energy Efficiency Trends
in Canada, 1990 to 1996.” Ottawa.
Nelson, K. 1994. “Finding and Implementing Projects that
Reduce Waste.” In R.H. Socolow, C. Andres, F. Berkhout, and V. Thomas, eds.
Neyer A., and M. Strebel. 1996. “Grundlagenarbeiten f�r
Perspektiven des Energieverbrauchs in Dienstleistungsbetrieben und
Landwirtschaft. Schlussbericht. Z�rich.”
Nikiforov, G. 1998. “On Approaches to Reducing Production
Energy Use at MMK.” Energomeneger (11): 21-23.
Nguyen Thuong. 1998. “Energy Saving Potential in Industry
in Vietnam and Climate Friendly Technology.” Presented at the First
CTI/Industry Joint Seminar on Technology Diffusion in Asia, May, Beijing.
Nyoike, P.M., and Okech, B., 1992. “Energy Management in
the Manufacturing Industry - The Case of Kenya.” In M.R. Bhagavan and S.
Karekezi, eds., Energy Management in Africa. London: Zed Books.
Opam M. 1992. “Country Paper on Efficiency and Conservation
in Energy Resource Development: The Ghanaian Experience.” Energy Sector
Workshop, Abidjan, C�te d’Ivoire.
Organizaci�n Latino-americana de Energ�a. 1998.
“Energy-Economic Information System (SIEE).” Quito, Ecuador.
OTA (Office of Technology Assessment), U.S. Congress. 1991.
Changing by Degrees: Steps to Reduce Greenhouse Gases. OTA-0-482.
Washington, D.C.: U.S. Government Printing Office.
OTA (Office of Technology Assessment), U.S. Congress. 1992.
Building Energy Efficiency. OTA-E-518. Washington, D.C.: U.S. Government
Printing Office.
OTA (Office of Technology Assessment), U.S. Congress. 1993.
“Industrial Energy Efficiency.” Washington, D.C.
Ottoboni, and others. 1998. “Efficiency of Destruction of
Waste Used in the Co-incineration in the Rotary Kilns.” Energy
Conversion and Management 39 (16-18): 1899-909.
Padilla, A.M. 1999. “Evaluaci�n del Impacto El�ctrico de
ILUMEX.” In Proceedings International ILUMEX Seminar. Puerto
Vallarta, Mexico.
Patel, M. 1999. “Closing Carbon Cycles. Carbon Use for
Materials in the Context of Resource Efficiency and Climate Change.”
Dissertation, University of Utrecht, Netherlands.
Phylipsen, D., K. Blok, and Ch. Hendriks. 1999. “A Review
of the Stage of Implementation of European Union Policies and Measures for
CO2 Emission Reduction.” Report no. 98077. University of
Utrecht, Netherlands.
Phylipsen, G.J.M. K Blok, and E. Worrell. 1998. “Handbook
on International Comparisons of Energy Efficiency in the Manufacturing
Industry.” University of Utrecht, Netherlands.
Poland Ministry of Industry. 1990. “Status and Assumptions
for Future Development of the Polish Energy Sector in the Years 1990 to
2010.” Warsaw.
President’s Committee of Advisors on Science and
Technology. 1999. “Powerful Partnerships: The Federal Role in International
Cooperation on Energy Innovation.” Washington, D.C.
Radetzki, M. 1991. “USSR Energy Exports
Post-perestroika.” Energy Policy 19 (4): 291-302.
Raghuraman, V. 1989. “Study Report on Reducing Energy
Intensity in Selected Indian Industrial Sectors.”
Ramesohl, S., 1999. “Opening the Black Box - What Can Be
Learned from Socio-economic Research for Energy Policy Analysis?” In IEA
and U.S. Department of Energy, eds., Proceedings of the International
Workshop “Technology to Reduce Greenhouse Gas Emissions:
Engineering-Economic Analysis of Conserved Energy and Carbon.”
Washington, D.C.
Rath, U., M. Hartmann, A. Pr�ffcke, and C. Mordziol. 1997.
“Climate Protection by Reducing the Losses of Electrical Motors [in
German].” Research report 204.08 541 UBA-FB 97-071. Umweltbundesamt,
Berlin.
Ravel. 1994. Praxislehrst�cke, wie Ausgaben f�r einen
rationelleren Stromeinsatz zur lohnenden Investition werden. Bundesamt f�r
Konjunkturfragen, Bern.
Reddy, A.K. 1991. “Barriers to Improvement in Energy
Efficiency.” Energy Policy 19: 953-61.
Reddy, A.K., R.H. Williams, and R.B. Johansson. 1997. Energy
After Rio - Prospects and Challenges. United Nations Development Programme,
New York.
Refining Processes. 1998. “Flow Diagrams and Summary
Descriptions Represent Typical Processes Used by Modern Refineries.”
Hydrocarbon Processing 77 (11): 53-114L.
Ritt, A. 1997. “Acme Rolls 0.030 Inch Hot Band.”
New Steel 13 (5).
Romm, J.J. 1999. Cool Companies - How the Best Businesses
Boost Profits and Productivity by Cutting Greenhouse Gas Emissions. London:
Earthscan.
Rosemann, H., and H.G. Ellerbrock. 1998. “Milling
Technology of Cement Production [in German].” ZKG International
51(2): 51-62.
Rumsey P.R., and T. Flanagan. 1995a. “South East Asian
Energy Efficiency Success Stories, Singapore, Malaysia and Indonesia.”
International Institute for Energy Conservation.
Rumsey P.R., and T. Flanagan. 1995b. “Standards and
Labelling: The Philippines Residential Air Conditioning Market.”
International Institute for Energy Conservation.
Russian Federation, Ministry of Fuel and Energy. 1998.
“Federal Target Program ‘Energy Saving in Russia’.” Moscow.
Russian Federation, Ministry of Transport. 1995. “Target
Programme ‘Fuels and Energy Saving in Transport’ [in Russian].”
SADC (South African Development Cooperation). 1996: “Focus
on Zambia: Energy Conservation in Zambia.” Energy Management Newsletter
1 (4).
SADC (South African Development Cooperation). 1997. “Focus
on Mozambique: Potential for Energy Conservation in Mozambique.” Energy
Management Newsletter 3 (1).
Saha B.B., and T. Kashiwagi. 1997. “Experimental
Investigation of an Advanced Adsorption Refrigeration Cycle.” ASHRAE
Trans. 103: 50-57.
Sanstad, A.H., and R.B. Howarth. 1994. “‘Normal’
Markets, Market Imperfections and Energy Efficiency.” Energy Policy
22: 811-18.
Schipper, L. 1997. “Indicators of Energy Use and
Efficiency: Understanding the Link Between Energy and Human Activity.”
International Energy Agency and Organisation for Economic Co-operation and
Development, Paris.
Sheinbaum, C, and L. Ozawa. 1998. “Energy Use and
CO2 Emissions for Mexico’s Cement Industry.” Energy
Policy 23 (9): 725-32.
Sheinbaum, C., and V. Rodr�guez. 1997. “Recent Trends in
Mexican Industrial Energy Use and Their Impact on Carbon Dioxide
Emissions.” Energy Policy 25 (7-9): 825-31.
Sheinbaum, C., S. Meyers, and J. Sathaye. 1994.
“Transportation Energy Used in Mexico.” Lawrence Berkeley National
Laboratory. LBL-35919. Berkeley, Calif.
Shimazaki Y., A. Akisawa, and T. Kashiwagi. 1997. “ A Model
Analysis on the Effects of Energy Cascaded Systems.” Proceedings of the
Thermodynamic Analysis and Improvement of Energy Systems, Beijing.
Sinton, J.E., and M.D. Levine. 1994. “Changing Energy
Intensity in Chinese Industry.” Energy Policy 22: 239-55.
Sinyak, Yu. 1991. “USSR: Energy Efficiency and
Prospects.” Energy 16 (5): 791-815.
Sioshansi, F.P. 1991. “The Myths and Facts of Energy
Efficiency.” Energy Policy 19: 231-43.
SNAP (Strategic National Action Plan). 1999. Climate Change
Action Plan Report to the Country Study Programme. Moscow.
Soares, J.A., and R.P. Tabosa. 1996. “Motores El�tricos:
Uma An�lise Comparativa de Mercado e Efici�ncia.” Proceedings: VII
Congresso Brasileiro de Energia. Rio de Janeiro, COPPE/UFRJ.
Suzuki Y., K. Ueta, and S. Mori, eds. 1996. Global
Environmental Security. Berlin: Springer.
TACIS (Technical Assistance for CIS Countries). 1996.
“Development of Energy Policy in Georgia.” TACIS/92/EG001. Brussels.
Tanides, C., M. Brugnoni, and G. Dutt. 1996.
“Characterisation of Residential Electricity Use in Argentina and
Implications for Energy Conservation Programmes.” Proceedings of the 31st
Universities Power Engineering Conference (UPEC 96), Heraklion, Creece.
TAU of SADCC, Energy Sector. 1991. “Experience in Energy
Conservation: Zimbabwe Case.” Paper presented at the International Seminar
on Energy in Africa, Abidjan, C�te d’Ivoire.
TERI (Tata Energy Research Institute). 1992. “State of the
Art Report on Use of CNG in the Transport Sector.” New Delhi.
TERI (Tata Energy Research Institute). 1994. “National
Programme in Bagasse Based Co-generation.” TERI Energy and Environment
Monitor 10 (1).
TERI (Tata Energy Research Institute). 1996a. “Research on
Energy-intensive Industries in India.” New Delhi.
TERI (Tata Energy Research Institute). 1996b. “Sector
Analysis, Aluminium Industry.” Prepared for the Energy Efficiency Support
Project, New Delhi.
TERI (Tata Energy Research Institute). 1997a. “Capacity
Building for Technology Transfer in the Context of the Climate Change.” New
Delhi.
TERI (Tata Energy Research Institute). 1997b. “Report on
Small-scale Brick Industry in India.” New Delhi.
TERI (Tata Energy Research Institute). 1997c. “Technical
Paper on GHG Mitigation/Abatement Options.” New Delhi.
TERI (Tata Energy Research Institute). 1998. “Action
Research Project in Small Scale Foundry Industry.” New Delhi.
TERI (Tata Energy Research Institute). 1999. TERI Energy Data
Directory and Yearbook 1998-99 (TEDDY). New Delhi.
TERI (Tata Energy Research Institute), and FAI (Fertilizer
Association of India). 1995. “Development of Oil Consumption Norm for the
Fertilizer Industry.” New Delhi.
TIFAC (Technology Information Forecasting and Assessment
Council). 1992. “Recommendations on Energy Conservation in Cement
Industry.” Government of India, Department of Scientific and Industrial
Research.
Turyareeba, P. 1993. “Mobilizing Local Financial Resources
- The Case of Uganda.” In S. Karekezi and G.A. Mackenzie, eds., Energy
Options for Africa - Environmentally Sustainable Alternatives. London: Zed
Books.
UN (United Nations). 1999. Yearbook of Industrial Statistics,
1999. Vol. II. New York.
UNDP (United Nations Development Programme). 1999. Energy as
a Tool for Sustainable Development for African, Caribbean and Pacific Countries.
New York.
UNFCCC (United Nation Framework Convention on Climate Change).
1997. Horticultural Project in Tyumen. Uniform Report on Activities
Implemented Jointly Under the Pilot Phase. UNFCCC Secretariat, Bonn.
UNFCCC (United Nation Framework Convention on Climate Change).
1998. 1998 Annual Energy Review. Washington, D.C.
Vakulko, A.G., and A.A. Zlobin. 1997. “Energy Saving
Measures in Electricity Supply Systems of Industrial Enterprices.”
Vestnik Glavgosenergonadzora Rossii no.1, Moscow.
Valdes-Arrieta, F. 1993. “Saving Energy in Chile: an
Assessment of Energy Use and Potential Efficiency Improvements.”
International Institute for Energy Conservation, Santiago, Chile.
Vargas Nieto, E. 1999. “ILUMEX Project: A General
Vision.” In Proceedings International ILUMEX Seminar. Puerto
Vallarta, Mexico.
Varone, F. 1998. “Le choix des instruments des politiques
publiques. Une analyse comar�e des politique d’efficience �nerg�tique du
Canada, du Danmark, des Etats-Unis, de la Su�de et de la Suisse.” Editions
Paul Haupt. Bern, Switzerland.
Varone, F., and B. Aebischer. 1999. “From National Policies
to Global Market Transformation: The Challenges of (International) Policy
Design.” In Proceedings of the 1999 ECEEE Summer Study “Energy
Efficiency and CO2 Reduction: The Dimensions of the Social
Challenge” Paris: ADEME Editions.
Vasiliev, A., and others. 1998. “Improvements of Tariffs
Regulations at End-users Energy Markets.” Energomeneger (11): 12-14
[in Russian].
VDEW (German Electricity Utility Association). 1997.
“Stromversorger r�sten sich f�r den Wettbewerb.” Stromthemen 7:
1-2.
Velthuijsen, J.W. 1995. “Determinants of Investment in
Energy Conservation.” SEO, University of Amsterdam, Netherlands.
Wanwacharakul V. 1993. “Reducing CO2 Emission in
Thailand.” Quarterly Environmental Journal, Thailand Environment
Institute 1 (1): 50-65.
WBCSD (World Business Council for Sustainable Development).
1996. “Eco-efficient Leadership for Improved Economic and Environmental
Performance.” Geneva.
WBNSS (World Bank National Strategy Study). 1999. “Study on
Russian National Strategy of Greenhouse Gas Emissions Reduction.” Task 4.
Moscow.
Wereko-Brobby C. 1993. “Innovative Energy Policy
Instruments and Institutional Reform - The Case of Ghana.” In S. Karekezi
and G.A. Mackenzie, eds., Energy Options for Africa - Environmentally
Sustainable Alternatives. London: Zed Books.
Werling, E., J. Hall, and D. Meseigeier. 1998. “Lessons
Learned in the ENERGY STAR Homes Program.” In Proceedings of the ACEEE
Summer Study on Energy Efficiency in Buildings. Asilomar, Calif.: American
Council for an Energy-Efficient Economy.
Wirtschaftvereinigung Stahl. 1998. Statistical Yearbooks of
the Steel Industry [in German].
World Bank. 1989. Sub-Saharan Africa: From Crisis to
Sustainable Growth. Washington, D.C.
World Bank. 1993. “Energy Efficiency and Conservation in
the Developing World. The World Bank’s Role.” Policy Paper,
Washington, D.C.
World Bank. 1996. Georgia: Energy Sector Review.
Washington, D.C.
Worrell, E., N. Martin, and L. Price. 1999. “Energy
Efficiency and Carbon Emissions Reduction Opportunities in the U.S. Iron and
Steel Industry.” Lawrence Berkeley National Laboratory, LBNL-41724.
Berkeley, Calif.
Yakowitz, H. and R. Hanmer. 1993. “Policy Options -
Encouraging Cleaner Production in the 1990s.” In: T. Jackson, ed., Clean
Production Strategies. Boca Raton, Fla.: Lewis Publishers.
Ziesing, H.-J., and others. 1999. “Scenarios and Measures
for Mitigating CO2-Emissions in Germany until 2005.” In G. Stein
and B. Strobel, eds., Policy Scenarios for Climate Protection [in
German]. Forschungszentrum J�lich,
Germany.
Chapter 7. Renewable Energy Technologies
Wim C. Turkenburg (Netherlands)
LEAD AUTHORS: Jos Beurskens (Netherlands), Andr� Faaij
(Netherlands), Peter Fraenkel (United Kingdom), Ingvar Fridleifsson (Iceland),
Erik Lysen (Netherlands), David Mills (Australia), Jose Roberto Moreira
(Brazil), Lars J. Nilsson (Sweden), Anton Schaap (Netherlands), and Wim C. Sinke
(Netherlands)
CONTRIBUTING AUTHORS: Per Dannemand Andersen (Denmark),
Sheila Bailey (United States), Jakob Bj�rnsson (Iceland), Teun Bokhoven
(Netherlands), Lex Bosselaar (Netherlands), Suani Teixeira Coelho (Brazil),
Baldur Eliasson (Switzerland), Brian Erb (Canada), David Hall (United Kingdom),
Peter Helby (Sweden), Stephen Karekezi (Kenya), Eric Larson (United States),
Joachim Luther (Germany), Birger Madson (Denmark), E.V.R. Sastry (India), Yohji
Uchiyama (Japan), and Richard van den Broek (Netherlands)
|
ABSTRACT
In 1998 renewable energy sources supplied 56 ± 10
exajoules, or about 14 percent of world primary energy consumption. The supply
was dominated by traditional biomass (38 ±10 exajoules a year). Other major
contributions came from large hydropower (9 exajoules a year) and from modern
biomass (7 exajoules). The contribution of all other renewables - small
hydropower, geothermal, wind, solar, and marine energy - was about 2 exajoules.
That means that the energy supply from new renewables was about 9 exajoules
(about 2 percent of world consumption). The commercial primary energy supply
from renewable sources was 27 ± 6 exajoules (nearly 7 percent of world
consumption), with 16 ± 6 exajoules from biomass.
Renewable energy sources can meet many times the present
world energy demand, so their potential is enormous. They can enhance diversity
in energy supply markets, secure long-term sustainable energy supplies, and
reduce local and global atmospheric emissions. They can also provide
commercially attractive options to meet specific needs for energy services
(particularly in developing countries and rural areas), create new employment
opportunities, and offer possibilities for local manufacturing of equipment.
There are many renewable technologies. Although often
commercially available, most are still at an early stage of development and not
technically mature. They demand continuing research, development, and
demonstration efforts. In addition, few renewable energy technologies can
compete with conventional fuels on cost, except in some niche markets. But
substantial cost reductions can be achieved for most renewables, closing gaps
and making them more competitive. That will require further technology
development and market deployment - and boosting production capacities to mass
production.
For the long term and under very favourable conditions, the
lowest cost to produce electricity might be $0.01 - 0.02 a kilowatt-hour for
geothermal, $0.03 a kilowatt-hour for wind and hydro, $0.04 a kilowatt-hour for
solar thermal and biomass, and $0.05 - 0.06 a kilowatt-hour for photovoltaics
and marine currents. The lowest cost to produce heat might be $0.005 a
kilowatt-hour for geothermal, $0.01 a kilowatt-hour for biomass, and $0.02 -
0.03 a kilowatt-hour for solar thermal. The lowest cost to produce fuels might
be $1.5 a gigajoule for biomass, $6 - 7 a gigajoule for ethanol, $7 - 10 a
gigajoule for methanol, and $6 - 8 a gigajoule for hydrogen.
Scenarios investigating the potential of renewables reveal
that they might contribute 20 - 50 percent of energy supplies in the second half
of the 21st century. A transition to renewables-based energy systems would have
to rely on:
· Successful
development and diffusion of renewable energy technologies that become more
competitive through cost reductions from technological and organisational
developments.
· Political will to
internalise environmental costs and other externalities that permanently
increase fossil fuel prices.
Many countries have found ways to promote renewables. As
renewable energy activities grow and require more funding, the tendency in many
countries is to move away from methods that let taxpayers carry the burden of
promoting renewables, towards economic and regulatory methods that let energy
consumers carry the burden. |
Renewable energy sources have been important for humans
since the beginning of civilisation. For centuries and in many ways, biomass has
been used for heating, cooking, steam raising, and power generation - and
hydropower and wind energy, for movement and later for electricity production.
Renewable energy sources generally depend on energy flows through the
Earth’s ecosystem from the insolation of the sun and the geothermal energy
of the Earth. One can distinguish:
· Biomass energy
(plant growth driven by solar radiation).
·
Wind energy (moving air masses driven by solar energy).
· Direct use of solar energy (as for heating and
electricity production).
·
Hydropower.
· Marine energy (such as wave
energy, marine current energy, and energy from tidal barrages).
· Geothermal energy (from heat stored in rock by the
natural heat flow of the Earth).
|
Many renewables technologies are
suited to small off-grid
applications,
good for rural, remote areas, where
energy is often crucial
in
human development. |
If applied in a modern way, renewable energy sources (or
renewables) are considered highly responsive to overall energy policy guidelines
and environmental, social, and economic goals:
· Diversifying
energy carriers for the production of heat, fuels, and electricity.
· Improving access to clean energy sources.
· Balancing the use of fossil fuels, saving them for
other applications and for future generations.
· Increasing the flexibility of power systems as
electricity demand changes.
· Reducing
pollution and emissions from conventional energy systems.
· Reducing dependency and minimising spending on
imported fuels.
Furthermore, many renewables technologies are suited to small
off-grid applications, good for rural, remote areas, where energy is often
crucial in human development. At the same time, such small energy systems can
contribute to the local economy and create local jobs.
The natural energy flows through the Earth’s ecosystem are
immense, and the theoretical potential of what they can produce for human needs
exceeds current energy consumption by many times. For example, solar power
plants on 1 percent of the world’s desert area would generate the
world’s entire electricity demand today. With ample resources and
technologies at hand for renewable energy use, the question of future
development boils down to economic and political competitiveness with other
energy sources. Since the performance and costs of conversion technologies
largely determine the competitiveness of renewables, technological development
is the key. Still, the World Energy Council, Shell, the Intergovernmental Panel
on Climate Change (IPCC), and several UN bodies project a growing role for
renewable energy in the 21st century with major contributions from biomass,
hydropower, wind, and solar.
TABLE 7.1. CATEGORIES OF RENEWABLE ENERGY CONVERSION
TECHNOLOGIES
|
Technology |
Energy product |
Application |
|
Biomass energy |
|
|
|
Combustion(domestic scale) |
Heat (cooking, space heating) |
Widely applied; improved technologies available |
|
Combustion(industrial scale) |
Process heat, steam, electricity |
Widely applied; potential for improvement |
|
Gasification/power production |
Electricity, heat (CHP). |
Demonstration phase |
|
Gasification/fuel production |
Hydrocarbons, methanol, H2 |
Development phase |
|
Hydrolysis and fermentation |
Ethanol |
Commercially applied for sugar/starch crops; production from
wood under development |
|
Pyrolysis/production of liquid fuels |
Bio-oils |
Pilot phase; some technical barriers |
|
Pyrolysis/production of solid fuels |
Charcoal |
Widely applied; wide range of efficiencies |
|
Extraction |
Biodiesel |
Applied; relatively expensive |
|
Digestion |
Biogas |
Commercially applied |
|
Wind energy |
|
|
|
Water pumping and battery charging |
Movement, power |
Small wind machines, widely applied |
|
Onshore wind turbines |
Electricity |
Widely applied commercially |
|
Offshore wind turbines |
Electricity |
Development and demonstration phase |
|
Solar energy |
|
|
|
Photovoltaic solar energy conversion |
Electricity |
Widely applied; rather expensive; further development needed
|
|
Solar thermal electricity |
Heat, steam, electricity |
Demonstrated; further development needed |
|
Low-temperature solar energy use |
Heat (water and space heating, cooking, drying) and cold |
Solar collectors commercially applied; solar cookers widely
applied in some regions; solar drying demonstrated and applied |
|
Passive solar energy use |
Heat, cold, light, ventilation |
Demonstrations and applications; no active parts |
|
Artificial photosynthesis |
H2 or hydrogen rich fuels |
Fundamental and applied research |
|
Hydropower |
Power, electricity |
Commercially applied; small and large scale applications |
|
Geothermal energy |
Heat, steam, electricity |
Commercially applied |
|
Marine energy |
|
|
|
Tidal energy |
Electricity |
Applied; relatively expensive |
|
Wave energy |
Electricity |
Research, development, and demonstration phase |
|
Current energy |
Electricity |
Research and development phase |
|
Ocean thermal energy conversion |
Heat, electricity |
Research, development, and demonstration phase |
|
Salinity gradient/osmotic energy |
Electricity |
Theoretical option |
|
Marine biomass production |
Fuels |
Research and development phase |
|
BOX 7.1. LAND USE REQUIREMENTS FOR ENERGY PRODUCTION
Biomass production requires land. The productivity of a
perennial crop (willow, eucalyptus, switchgrass) is 8 - 12 tonnes of dry matter
per hectare a year. The lower heating value (LHV) of dry clean wood amounts to
about 18 gigajoules a tonne; the higher heating value about 20 gigajoules a
tonne. Thus 1 hectare can produce 140 - 220 gigajoules per hectare a year (LHV;
gross energy yield; taking into account energy inputs for cultivation,
fertiliser, harvest, and so on, of about 5 percent in total). The production of
1 petajoule currently requires 4,500 - 7,000 hectares. To fuel a baseload
biomass energy power plant of 600 megawatts of electricity with a conversion
efficiency of 40 percent would require 140,000 - 230,000 hectares. Annual
production of 100 exajoules (one-quarter of the world’s current energy use)
would take 450 - 700 million hectares. |
A wide variety of technologies are available or under
development to provide inexpensive, reliable, and sustainable energy services
from renewables (table 7.1). But the stage of development and the
competitiveness of those technologies differ greatly. Moreover, performance and
competitiveness are determined by local conditions, physical and socioeconomic,
and on the local availability of fossil fuels.
All renewable energy sources can be converted to electricity.
Since some major renewable energy sources are intermittent (wind, solar),
fitting such supplies into a grid creates challenges. This is less of a problem
for biomass, hydropower, and geothermal. Only a few of them produce liquid and
gaseous fuels as well as heat
directly.
Biomass energy
Biomass is a rather simple term for all organic material that
stems from plants (including algae), trees, and crops. Biomass sources are
therefore diverse, including organic waste streams, agricultural and forestry
residues, as well as crops grown to produce heat, fuels, and electricity (energy
plantations).
Biomass contributes significantly to the world’s energy
supply - probably accounting for 45 ± 10 exajoules a year (9 - 13 percent
of the world’s energy supply; IEA, 1998; WEC, 1998; Hall, 1997). Its
largest contribution to energy consumption - on average between a third and a
fifth - is found in developing countries. Compare that with 3 percent in
industrialised countries (Hall and others, 1993; WEC, 1994b; IEA REWP, 1999).
Dominating the traditional use of biomass, particularly in
developing countries, is firewood for cooking and heating. Some traditional use
is not sustainable because it may deprive local soils of needed nutrients, cause
indoor and outdoor air pollution, and result in poor health. It may also
contribute to greenhouse gas emissions and affect ecosystems (chapters 3 and
10). The modern use of biomass, to produce electricity, steam, and biofuels, is
estimated at 7 exajoules a year. This is considered fully commercial, based on
bought biomass or used for productive purposes. That leaves the traditional at
38 ± 10 exajoules a year. Part of this is commercial - the household
fuelwood in industrialised countries and charcoal and firewood in urban and
industrial areas in developing countries. But there are almost no data on the
size of this market. If it can be estimated at between 10 percent and 30 percent
(9 ± 6 exajoules a year), which seems probable, the total commercial use of
biomass in 1998 was 16 ± 6 exajoules.
Since the early 1990s biomass has gained considerable interest
world-wide. It is carbon neutral when produced sustainably. Its geographic
distribution is relatively even. It has the potential to produce modern energy
carriers that are clean and convenient to use. It can make a large contribution
to rural development. And its attractive costs make it a promising energy source
in many regions. With various technologies available to convert biomass into
modern energy carriers, the application of commercial and modern biomass energy
systems is growing in many countries.
TABLE 7.2. POTENTIAL CONTRIBUTION OF BIOMASS TO THE
WORLD’S ENERGY NEEDS
|
Source |
Time frame (year) |
Total projected global energy demand (exajoules a year)
|
Contribution of biomass to energy demand (exajoules a
year) |
Comments |
|
RIGES (Johansson and others, 1993) |
2025
2050 |
395
561 |
145
206 |
Based on calculation with the RIGES model |
|
SHELL (Kassler, 1994) |
2060 |
1,500
900 |
220
200 |
Sustained growth scenario
Dematerialization scenario |
|
WEC (1994a) |
2050
2100 |
671 - 1,057
895 - 1,880 |
94 - 157
132 - 215 |
Range given here reflects the outcomes of three scenarios |
|
Greenpeace and SEI (Lazarus and others, 1993) |
2050
2100 |
610
986 |
114
181 |
A scenario in which fossil fuels are phased out during the 21st
century |
|
IPCC (Ishitani and Johansson, 1996) |
2050
2100 |
560
710 |
280
325 |
Biomass intensive energy system development |
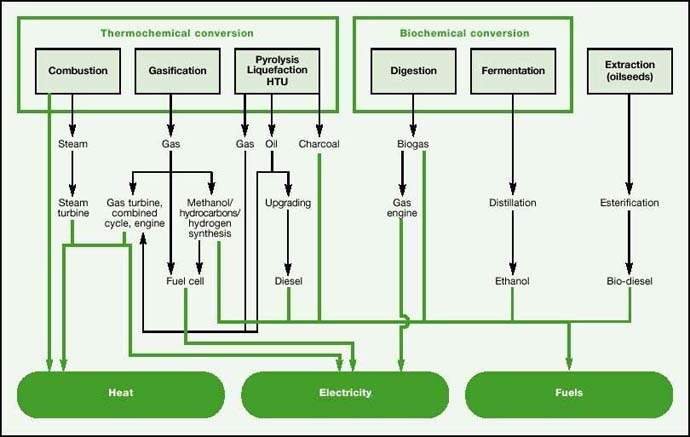
FIGURE 7.1. MAIN BIOMASS ENERGY
CONVERSION ROUTES
The potential of biomass energy
The resource potential of biomass energy is much larger than
current world energy consumption (chapter 5). But given the low conversion
efficiency of solar to biomass energy (less than 1 percent), large areas are
needed to produce modern energy carriers in substantial amounts (box 7.1). With
agriculture modernised up to reasonable standards in various regions, and given
the need to preserve and improve the world’s natural areas, 700 - 1,400
million hectares may be available for biomass energy production well into the
21st century (Hall and others, 1993; Larson and others, 1995; Ishitani and
others, 1996; IIASA and WEC, 1998; Larson, Williams, and Johansson, 1999). This
includes degraded, unproductive lands and excess agricultural lands. The
availability of land for energy plantations strongly depends on the food
supplies needed and on the possibilities for intensifying agricultural
production in a sustainable way.
A number of studies have assessed the potential contribution of
biomass to the world energy supply (table 7.2). Although the percentage
contribution of biomass varies considerably, especially depending on expected
land availability and future energy demand, the absolute potential contribution
of biomass in the long term is high - from 100 - 300 exajoules a year.
World-wide annual primary energy consumption is now about 400
exajoules.
Biomass energy conversion technologies
Conversion routes to produce heat, electricity, and/or fuels
from biomass are plentiful (figure 7.1).
Production of heat. In developing countries the
development and introduction of improved stoves for cooking and heating can have
a big impact on biomass use (chapters 3 and 10). Especially in colder climates
(Scandinavia, Austria, Germany) domestic biomass-fired heating systems are
widespread. Improved heating systems are automated, have catalytic gas cleaning,
and use standard fuel (such as pellets). The benefit over open fireplaces is
considerable, with advanced domestic heaters obtaining efficiencies of more than
70 percent and producing far fewer atmospheric emissions. The present heat-
generating capacity is estimated to be more than 200 gigawatts of thermal
energy.
Production of electricity. Some features of the main
thermochemcial biomass energy conversion routes to electricity and combined heat
and power (CHP) are presented in table 7.3. Combustion of biomass to produce
electricity is applied commercially in many regions, with the total installed
capacity estimated at 40 gigawatts of electricity. The application of fluid bed
combustion and advanced gas cleaning allows for efficient production of
electricity (and heat) from biomass. At a scale of 20 - 100 megawatts of
electricity, electrical efficiencies of 20 - 40 percent are possible (van den
Broek and others, 1996; Solantausta and others, 1996). Often the electricity is
produced along with heat or steam (CHP) in Denmark and Sweden. In Southeast
Asia, through the Association of Southeast Asian Nations - European Union COGEN
Programme, sawmill factories in Indonesia, Malaysia, and Thailand have
cogeneration systems, using wood-waste from the factories.
Co-combustion systems - combining, say, natural gas and coal
with biomass - are built in such places as Denmark with the benefits of greater
economies of scale and reduced fuel supply risks. Co-combustion of biomass in
coal-fired power plants is a popular way to increase biomass-based power
generation capacity with minimal investment (chapter 8). Other advantages over
coal-based power production are the higher efficiencies (due in most cases to
the large scale of the existing power plant) and lower sulphur dioxide
(SO2) and nitrogen oxide (NOx) emissions (Meuleman and
Faaij, 1999).
Large gasification. Gasification technologies can convert
biomass into fuel gas, cleaned before its combustion in, say, a gas turbine.
Biomass integrated gasification/combined cycle (BIG/CC) systems combine flexible
fuel characteristics and high electrical efficiency. Electrical conversion
efficiencies of 40 percent (LHV) are possible at a scale of about 30 megawatts
of electricity (Consonni and Larson, 1994a, b; Faaij and others, 1997).
Demonstration projects are under way in various countries and
for various gasification concepts. In Brazil a project supported by the World
Bank and Global Environment Facility will demonstrate a 30 megawatts-electric
BIG/CC unit fired with cultivated eucalyptus (Elliott and Booth, 1993).
Sweden’s first BIG/CC unit, based on pressurised gasification, has several
thousands of hours of operational experience. Three other demonstration units
around the 6 - 10 megawatts-electric scale are under way. An atmospheric BIG/CC
system is being commissioned in Yorkshire, United Kingdom. In the United States
an indirect gasification process is under demonstration at the Burlington power
station.
The first generation of BIG/CC systems shows high unit capital
costs. Depending on the scale, prices are $2,800 - 5,000 a kilowatt of
electricity. But cost reduction potential is considerable for BIG/CC systems -
capital costs might come down to $1,100 - 2,000 a kilowatt (Williams, 1996;
Solantausta and others, 1996; Faaij, Meuleman, and Van Ree, 1998).
Co-gasification of biomass, another option, is being applied in the United
States and Europe. An interesting alternative for fuel gas produced through
biomass gasification is its use in existing (or new) natural gas-fired combined
cycles. In this way, economies of scale come with a safe fuel supply (Walter and
others, 1998). This option has not been demonstrated yet, but more research is
under way.
Small gasification. Small (fixed bed) gasifiers coupled
to diesel or gasoline engines (typically for systems of 100 - 200 kilowatts of
electricity with an approximate electrical efficiency of 15 - 25 percent) are
commercially available on the market. But high costs and the need for gas
cleaning and careful operation have blocked application in large numbers. Some
systems are being applied fairly successfully in rural India and in China and
Indonesia (Kaltschmitt and others, 1998; Stassen, 1995).
Biogas production. Anaerobic digestion of biomass has
been demonstrated and applied commercially with success in many situations and
for a variety of feedstocks - such as organic domestic waste, organic industrial
wastes, manure, and sludges. Large advanced systems are developed for wet
industrial waste streams and applied in many countries. In India there is
widespread production of biogas from animal and other wastes for cooking,
lighting, and power generation (chapter 10).
TABLE 7.3. MAIN THERMOCHEMICAL BIOMASS ENERGY CONVERSION
ROUTES TO HEAT AND ELECTRICITY
|
Conversion system |
Range |
Net efficiency (percent, LHV) |
Investment cost (dollars a kilowatt of electricity)
|
|
Combustion |
|
|
|
|
Combined heat and power (CHP) |
100 kWe to 1 MWe |
60 - 90 (overall) |
|
|
1 - 10 MWe |
80 - 99 (overall) |
|
|
Standalone |
20 - 100 MWe |
20 - 40 (electrical) |
1,600 - 2,500 |
|
Co-combustion |
5 - 20 MWe |
30 - 40 (electrical) |
250 plus costs of existing power plant |
|
Gasification |
|
|
|
|
CHP |
|
|
900 - 3,000 (depending on location and configuration) |
|
|
Diesel |
100 kWe to 1 MWe |
15 - 25 (electrical) |
|
|
|
Gas turbine |
1 - 10 MWe |
25 - 30 (electrical) |
|
|
BIG/CC |
30 - 100 MWe |
40 - 55 (electrical) |
1,100 - 2,000 (when commercially proven) |
|
Digestion |
|
|
|
|
Wet biomass materials |
Up to several MWe |
10 - 15 (electrical) |
5,000 |
Digestion has a low overall electric conversion efficiency
(roughly 10 - 15 percent, depending on the feedstock) and is particularly suited
for wet biomass materials. Landfills contribute to atmospheric methane
emissions. In many situations the collection of landfill gas and its conversion
to electricity using gas engines is profitable, and such systems are becoming
more widespread (Faaij, Hekkert, and others, 1998).
Production of liquid and gaseous fuels from biomass (bio-oil
and biocrude). At temperatures around 500 degrees Celsius in the absence of
oxygen, pyrolysis converts biomass to liquid (bio-oil), gaseous, and solid
(charcoal) fractions. With flash pyrolysis techniques (fast pyrolysis) the
liquid fraction can be up to 70 percent of the thermal biomass input. Bio-oil
contains about 40 weight-percent of oxygen and is corrosive and acidic. The oil
can be upgraded to reduce the oxygen content, but that has economic and energy
penalties. Pyrolysis and upgrading technology are still largely in the pilot
phase (Bridgewater, 1998).
Hydrothermal upgrading (HTU), originally developed by Shell,
converts biomass at a high pressure and at moderate temperatures in water to
biocrude. Biocrude contains far less oxygen than bio-oil produced through
pyrolysis, but the process is still in a pre-pilot phase (Naber and others
1997).
Ethanol. Production of ethanol by fermenting sugars is a
classic conversion route for sugar cane, maize, and corn on a large scale,
especially in Brazil, France, and the United States. Zimbabwe also has a
considerable fuel ethanol programme using sugar cane (Hemstock and Hall, 1995).
The U.S. and European programmes convert surplus food crops to a useful(by)
product. But ethanol production from maize and corn is far from being
competitive with gasoline and diesel. Nor is the overall energy balance of such
systems very favourable.
An exception is Brazil’s PRO-ALCOOL programme, due to the
high productivity of sugar cane (Rosillo-Calle and Cortez, 1998). This programme
is discussed in some detail later in this chapter. In 1998 world production of
ethanol was estimated at 18 billion litres (equivalent to 420 petajoules).
Ethanol can also be produced by the hydrolysis of
lignocellulosic biomass, a potentially low-cost and efficient option. Hydrolysis
techniques are gaining more development attention, particularly in Sweden and
the United States, but some fundamental issues need to be resolved. If these
barriers are lowered and ethanol production is combined with efficient
electricity production from unconverted wood fractions (such as lignine),
ethanol costs could come close to current gasoline prices - as low as $0.12 a
litre at biomass costs of about $2 a gigajoule (Lynd, 1996). Overall system
conversion efficiency could go up to about 70 percent (LHV).
Esters from oilseeds. Oilseeds, such as rapeseed, can be
extracted and converted to esters and are well suited to replace diesel.
Substantial quantities of RME (rape methyl esters) are produced in the European
Union and to a lesser extent in North America. But RME requires substantial
subsidies to compete with diesel. Energy balances for RME systems are less
favourable than those for perennial crops (Ishitani and Johansson, 1996), so the
net energy production per hectare is low. These balances can be improved if
by-products (such as straw) are also used as an energy source.
|
Biomass has gained
considerable interest world-
wide. It
is carbon neutral
when produced
sustainably. |
Methanol, hydrogen, and hydrocarbons through
gasification. Production of methanol and hydrogen using gasification
technology and traditional syngas conversion processes could offer an attractive
conversion route for biomass over the long term. Although such concepts received
serious attention in the early 1980s, low oil prices made them unattractive. New
technology - such as liquid phase methanol production (combined with electricity
generation) and new gas separation technology - offers lower production costs
and higher overall conversion efficiencies. With large-scale conversion and the
production of both fuel and electricity, methanol and hydrogen from
lignocellulosic biomass might compete with gasoline and diesel (Spath and
others, 2000; Faaij and others, 1999). In addition, synthetic hydrocarbons and
methanol can be produced from syngas using Fischer-Tropsch synthesis (Larson and
Jin, 1999a,
b).
Environmental impacts of biomass energy systems
Biomass energy can be carbon neutral when all biomass produced
is used for energy (short carbon cycle). But sustained production on the same
surface of land can have considerable negative impacts on soil fertility, water
use, agrochemical use, biodiversity, and landscape. Furthermore, the collection
and transport of biomass increases the use of vehicles and infrastructure and
the emissions to the atmosphere (Tolbert, 1998; Borjesson, 1999; Faaij,
Meuleman, and others, 1998). Seen world-wide, climatic, soil, and socioeconomic
conditions set strongly variable demands for what biomass production will be
sustainable.
Erosion. Erosion is a problem related to the cultivation
of many annual crops in many regions. The best-suited energy crops are
perennials, with much better land cover than food crops. And during harvest, the
removal of soil can be kept to a minimum, since the roots remain in the soil.
Another positive effect is that the formation of an extensive root system adds
to the organic matter content of the soil. Generally, diseases (such as
eelworms) are prevented, and the soil structure is improved.
Water use. Increased water use caused by additional
demands of (new) vegetation can become a concern, particularly in arid and
semi-arid regions. The choice of crop can have a considerable effect on
water-use efficiency. Some eucalyptus species have a very good water-use
efficiency, considering the amount of water needed per tonne of biomass
produced. But a eucalyptus plantation on a large area could increase the local
demand for groundwater and affect its level. On the other hand, improved land
cover generally is good for water retention and microclimatic conditions. Thus
the impacts on the hydrological situation should be evaluated at the local
level.
Agrochemicals. Pesticides affect the quality of
groundwater and surface water and thus plants and animals. Specific effects
depend on the type of chemical, the quantity used, and the method of
application. Experience with perennial crops (willow, poplar, eucalyptus,
miscanthus) suggests that they meet strict environmental standards. Compared
with food crops like cereals, application rates of agrochemicals per hectare are
a fifth to a twentieth for perennial energy crops (Faaij, Meuleman, and others,
1998; Borjesson, 1999).
Nutrients. The abundant use of fertilisers and manure in
agriculture has led to considerable environmental problems in various regions:
nitrification of groundwater, saturation of soils with phosphate,
eutrophication, and unpotable water. Phosphates have also increased the heavy
metal flux of the soil. But energy farming with short rotation forestry and
perennial grasses requires less fertiliser than conventional agriculture
(Kaltschmitt and others, 1996). With perennials, better recycling of nutrients
is obtained. The leaching of nitrogen for willow cultivation can be a half to a
tenth that for food crops, meeting stringent standards for groundwater
protection. The use of plantation biomass will result in removal of nutrients
from the soil that have to be replenished in one way or the other. Recycling of
ashes is feasible for returning crucial trace elements and phosphates to the
soil, already common practice in Austria and Sweden. In Brazil stillage, a
nutrient rich remainder of sugar cane fermentation, is returned to sugar cane
plantations.
Biodiversity and landscape. Biomass plantations can be
criticised because the range of biological species they support is much narrower
than what natural forests support (Beyea and others, 1991). Although this is
generally true, it is not always relevant. It would be if a virgin forest is
replaced by a biomass plantation. But if plantations are established on degraded
lands or on excess agricultural lands, the restored lands are likely to support
a more diverse ecology.
Degraded lands are plentiful: estimates indicate that about 2
billion hectares of degraded land are ‘available’ in developing
countries (Larson, Williams, and Johansson, 1999; IIASA and WEC, 1998). It would
be desirable to restore such land surfaces anyway - for water retention, erosion
prevention, and (micro-) climate control. A good plantation design, including
areas set aside for native plants and animals fitting in the landscape in a
natural way, can avoid the problems normally associated with monocultures,
acknowledging that a plantation of energy crops does not always mean a
monoculture.
Other risks (fire, disease). Landscaping and managing
biomass production systems can considerably reduce the risks of fire and
disease. Thus they deserve more attention in coming projects, policies, and
research.
Conversion and end use. Conversion of biomass to desired
intermediate energy carriers and their use for energy services should meet
strict environmental standards as well. Problems that could occur (such as
emissions to air) can be easily countered with technology that is well
understood and available. Clean combustion of biomass is now common practice in
Scandinavia. Gasification allows for cleaning fuel gas prior to combustion or
further processing. Care should be paid to small (less than 1 megawatts of
thermal energy) conversion systems: technology to meet strict emission standards
is available but can have a serious impact on the investment and operational
costs of such small systems (Kaltschmitt and others, 1998; Stassen,
1995).
Economics of biomass energy systems
Biomass is a profitable alternative mainly when cheap or even
negative-cost biomass residues or wastes are available. To make biomass
competitive with fossil fuels, the production of biomass, the conversion
technologies, and total bio-energy systems require further optimisation.
TABLE 7.4. MAIN PERFORMANCE DATA FOR SOME CONVERSION ROUTES
OF BIOMASS TO FUELS
|
RME |
Ethanol from sugar or starch crops |
Ethanol from lignocellulosic biomass |
Hydrogen from lignocellulosic biomass |
Methanol from lignocellulosic biomass |
Bio-oil from lignocellulosic biomass |
|
Concept |
Extraction and esterification |
Fermentation |
Hydrolysis, fermentation, and electricity production |
Gasification |
Gasification |
Flash pyrolysis |
|
Net energy efficiency of conversion |
75 percent based onallenergy inputs |
50 percent for sugar beet;
44 percent for sugar cane |
60 - 70 percent (longer term with power generation included)
|
55 - 65 percent
60 - 70 percent (longer term) |
50 - 60 percent
60 - 70 percent (longer term) |
70 percent
(raw bio-oil) |
|
Cost range, short terma |
$15 - 25 a gigajoule (northwest Europe) |
$15 - 25 a gigajoule for sugar beet;
$8 - 10 a gigajoule for
sugar cane |
$10 - 15 a gigajoule |
$8 - 10 a gigajoule |
$11 - 13 a gigajoule |
n.a. |
|
Cost range, long terma |
n.a. |
n.a. |
$6 - 7 a gigajoule |
$6 - 8 a gigajoule |
$7 - 10 a gigajoule |
Unclear |
a. Diesel and gasoline production costs vary widely
depending on the oil price. Longer - term projections give estimates of roughly
$0.25 - 0.35 a litre, or $8 - 11 a gigajoule. Retail fuel transport prices are
usually dominated by taxes of $0.50 - 1.30 a litre depending on the country.
Source: Wyman and others, 1993; IEA, 1994; Williams and
others, 1995; Jager and others, 1998; Faaij, Hamelinck, and Agterberg,
forthcoming.
Biomass production. Plantation biomass costs already are
favourable in some developing countries. Eucalyptus plantations in northeast
Brazil supply wood chips at prices between $1.5 - 2.0 a gigajoule (Carpentieri
and others, 1993). Costs are (much) higher in indus-trialised countries, such as
$4 a gigajoule in parts of northwest Europe (Rijk, 1994; van den Broek and
others, 1997). But by about 2020, with improved crops and production systems,
biomass production costs in the United States could be about $1.5 - 2.0 a
gigajoule for substantial land surfaces (Graham and others, 1995; Turnure and
others, 1995; Hughes and Wiltsee, 1995). It is expected for large areas in the
world that low-cost biomass can be produced in large quantities. Its
competitiveness will depend on the prices of coal (and natural gas), but also on
the costs and net returns from alternative, competing uses of productive land.
Power generation from biomass. With biomass prices of
about $2 a gigajoule, state of the art combustion technology at a scale of 40 -
60 megawatts of electricity can result in electricity production costs of $0.05
- 0.06 a kilowatt-hour (USDOE, 1998b; Solantausta and others, 1996).
Co-combustion, particularly at efficient coal-fired power plants, can obtain
similar costs. If BIG/CC technology becomes available commercially, production
costs could drop further to about $0.04 a kilowatt-hour, especially with higher
electrical efficiencies. For larger scales (more than 100 megawatts of
electricity) it is expected that cultivated biomass will compete with fossil
fuels in many situations. The benefitsoflower specific capital costs and
increased efficiency certainly outweigh the increase in costs and energy use for
transport for considerable distances if a reasonably well-developed
infrastructure is in place (Marrison and Larson, 1995a, b; Faaij, Hamelinck, and
Agterberg, forthcoming).
Decentralised power (and heat) production is generally more
expensive and therefore is better suited for off-grid applications. The costs of
gasifier/diesel systems are still unclear and depend on what emissions and fuel
quality are considered acceptable. Combined heat and power generation is
generally economically attractive when heat is required with a high load factor.
Production of liquid and gaseous fuels from biomass. The
economies of ‘traditional’ fuels like RME and ethanol from starch and
sugar cropsin moderate climate zones are poor and unlikely to reach competitive
price levels. Methanol, hydrogen, and ethanol from lig-nocellulosic biomass
offer better potential in the longer term (table
7.4).
Implementation issues
Modern use of biomass is important in the energy systems of a
number of countries (table 7.5). Other countries can be mentioned as well - as
in Asia, where biomass, mainly traditional biomass, can account for 50 - 90
percent of total energy. India has installed more than 2.9 million biomass
digesters in villages and produces biogas for cooking - and is using small
gasifier diesel systems for rural electrification. Biomass power projects with
an aggregate capacity of 222 megawatts have been commissioned in India, with
another 280 megawatts under construction (MNCES, 1999). And with tens of
millions of hectares of degraded soil, India is involved in wood-for-energy
production schemes. Throughout Southeast Asia the interest in modern bio-energy
applications has increased in recent years, partly because of the fast-growing
demand for power and because biomass residues from various agricultural
production systems are plentiful (box 7.2; Lefevre and others, 1997).
TABLE 7.5. BIOMASS IN THE ENERGY SYSTEMS OF SELECTED
COUNTRIES
|
Country |
Role of biomass in the energy system |
|
Austria |
Modern biomass accounts for 11 percent of the national energy
supply. Forest residues are used for (district) heating, largely in systems of a
relatively small scale. |
|
Brazil |
Biomass accounts for about a third of the energy supply. Main
modern applications are ethanol for vehicles produced from sugar cane (13 - 14
billion litres a year) and substantial use of charcoal in steel industry.
Government supports ethanol. PRO-ALCOOL is moving towards a rationalisation
programme to increase efficiency and lower costs. |
|
Denmark |
A programme is under way to use 1.2 million tonnes of straw as
well as use forest residues. Various concepts have been devised for co-firing
biomass in larger-scale combined heating and power plants, district heating, and
digestion of biomass residues. |
|
Finland |
Twenty percent of its primary energy demand comes from modern
biomass. The pulp and paper industry makes a large contribution through
efficient residue and black liquor use for energy production. The government
supports biomass; a doubling of the contribution is possible with available
resources. |
|
Sweden |
Modern biomass accounts for 17 percent of national energy
demand. Use of residues in the pulp and paper industry and district heating
(CHP) and use of wood for space heating are dominant. Biomass is projected to
contribute 40 percent to the national energy supply in 2020. |
|
United States |
About 10,700 megawatts-electric biomass-fired capacity was
installed by 1998; largely forest residues. Four billion litres per year of
ethanol are produced. |
|
Zimbabwe |
Forty million litres of ethanol are produced a year. Biomass
satisfies about 75 percent of national energy demand. |
Source: Kaltschmitt and others, 1998;
Rosillo-Calle and others, 1996; Rosillo and Cortez, 1998; NUTEK, 1996; USDOE,
1998a; Hemstock and Hall, 1995.
Barriers. Bio-energy use varies remarkably among
countries. Varying resource potentials and population densities are not the only
reasons. Other barriers hamper implementation:
· Uncompetitive
costs. The main barrier is that the energy carriers are not competitive
unless cheap or negative cost biomass wastes and residues are used. Technology
development could reduce the costs of bio-energy. In Denmark and Sweden, where
carbon and energy taxes have been introduced, more expensive wood fuels and
straw are now used on a large scale. But world-wide, the commercial production
of energy crops is almost non-existent. (Brazil is a major exception, having
introduced subsidies to make ethanol from sugar cane competitive with gasoline.)
· The need for efficient,
cheap, environmentally sound energy conversion technologies. Strongly
related to costs issues are the availability and the full-scale demonstration of
advanced conversion technology, combining a high energy conversion efficiency
and environmentally sound performance with low investment costs. Biomass
integrated gasifier/combined cycle (BIG/CC) technology can attain higher
conversion efficiency at lower costs. Further development of gasification
technologies is also important for a cheaper production of methanol and hydrogen
from biomass.
· Required development of
dedicated fuel supply systems. Experience with dedicated fuel supply systems
based on ‘new’ energy crops, such as perennial grasses, is very
limited. Higher yields, greater pest resistance, better management techniques,
reduced inputs, and further development of machinery are all needed to lower
costs and raise productivity. The same is true for harvesting, storage, and
logistics.
· Specific biomass
characteristics. The solar energy conversion efficiencyof biomass production
is low - in practice less than 1 percent. So, fairly large land surfaces are
required to produce a substantially amount of energy. Moreover, biomass has a
low energy density. Compare coal’s energy density of 28 gigajoules a tonne,
mineral oil’s 42 gigajoules a tonne, and liquefied natural gas’s 52
gigajoules a tonne with biomass’s 8 gigajoules a tonne of wood (at 50
percent moisture content). Transport is thus an essential element of biomass
energy systems, and transportation distances can become a limiting factor.
Another complication is that biomass production is usually bound to seasons,
challenging the supply and logistics of a total system. And varying weather
conditions affect production year-to-year.
· Socioeconomic and
organisational barriers. The production of crops based on perennial grasses
or short rotation forestry differs substantially from that of conventional food
crops. Annual crops provide farmers with a constant cash flow for each hectare
of land. For short rotation coppice, however, the intervals between harvests can
be 2 - 10 years, restricting the flexibility of farmers to shift from one crop
to another. In addition, bio-energy systems require complex organisations and
many actors, creating non-technical barriers.
· Public acceptability.
Since biomass energy systems require substantial land areas if they are to
contribute much to the total energy supply, the needed changes in land-use,
crops, and landscape might incite public resistance. And to be acceptable to
most people, the ecological impacts of biomass production systems have to be
minimal. Increased traffic in biomass production areas might also be seen as a
negative.
· Ecological aspects. Not
much is known about the effects of large-scale energy farming on landscapes and
biodiversity. Energy crop plantations have to fit into the landscape both
ecologically and aesthetically. And in addition to minimising the environmental
impact, attention should be paid to fitting biomass production into existing
agricultural systems.
· Competition for land use.
Competition for land or various land claims may turn out to be a limitation
in various regions. Opinions differ on how much (agricultural) land will become
available for energy crops (Dyson, 1996; Brown and others, 1996; Gardner, 1996).
An accepted principle is that biomass production for energy should not conflict
with food production. But given the large potential to increase the productivity
of conventional agriculture (Luyten, 1995; WRR, 1992; Larson, Williams, and
Johansson, 1999), land’s availability is not necessarily a barrier. If
conventional agriculture has higher productivity, it will become more profitable
- so bio-energy will face even stiffer competition from conventional crops than
it does today.
|
BOX 7.2. INDUSTRIAL USES OF BIO-ENERGY
Two large industrial sectors offer excellent opportunities to
use biomass resources efficiently and competitively world-wide: paper and pulp,
and sugar (particularly using sugar cane as feed). Traditionally, these sectors
use biomass residues (wood waste and bagasse) for their internal energy needs,
usually inefficient conversions to low-pressure steam and some power. The
absence of regulations to ensure reasonable electricity tariffs for independent
power producers make it unattractive for industries to invest in more efficient
power generation. But the liberalisation of energy markets in many countries is
removing this barrier, opening a window to reduce production costs and modernise
production capacity.
Efficient boilers have been installed in many production
facilities. Gasification technology could offer even further efficiency gains
and lower costs - say, when applied for converting black liquor (Larson and
others, 1998). The power generated is generally competitive with grid prices. In
Nicaragua electricity production from bagasse using improved boilers could meet
the national demand for electricity (van den Broek and van Wijk, 1998). |
|
Some 700-1,400
million hectares may be
available for
biomass energy
production well into
the 21st century. |
Strategies. Six areas are essential for successful
development and implementation of sustainable and economically competitive
bio-energy systems: technologies, production, markets, polygeneration,
externalities, and policy.
Technological development and demonstration of key conversion
technologies. Research, demonstration, and commercialisation of advanced
power generation technology are essential - especially for BIG/CC technology,
which can offer high conversion efficiencies, low emissions, and low costs.
Another interesting route is producing modern biofuels, using hydrolysis and
gasification. Combining biomass with fossil fuels can be an excellent way to
achieve economies of scale and reduce the risks of supply disruptions.
More experience with and improvement of biomass production.
Local assessments are needed to identify optimal biomass production systems,
and more practical experience is needed with a wide variety of systems and
crops. Certainly, more research and testing are needed to monitor the impact of
energy crops, with particular attention to water use, pest abatement, nutrient
leaching, soil quality, biodiversity (on various levels), and proper
landscaping. Perennial crops (grasses) and short rotation coppice (eucalyptus,
willow) can be applied with minimal ecological impacts.
Cost reduction is essential, though several countries already
obtain biomass production costs below $2 a gigajoule. Larger plantations,
improved species, and better production systems and equipment can reduce costs
further. Another promising way to lower costs is to combine biomass production
for energy with other (agricultural or forest) products (multi-output production
systems). Yet another is to seek other benefits from biomass production -
preventing erosion, removing soil contaminants, and creating recreational and
buffer zones.
Creating markets for biomass production, trade, and use.
At local and regional scales, the starting phase of getting bio-energy
‘off the ground’ can be difficult. The supply and demand for biomass
need to be matched over prolonged periods. Diversifying biomass supplies can be
a key in creating a better biomass market. Flexible conversion capacity to deal
with different biomass streams, as well as fossil fuels, is also important. And
international trade in bio-energy can buffer supply fluctuations.
Production can also be started in niches. Major examples are the
modernisation of power generation in the sugar, in paper and pulp, and in
(organic) waste treatment. Regulations - such as acceptable payback tariffs for
independent power producers - are essential. Niche markets can also be found for
modern biofuels, such as high-value fuel additives, as mixes with gasoline, or
for specific parts of a local transport fleet (such as buses). Successful
biomass markets are working in Scandinavian countries and in Brazil (boxes 7.3
and 7.4).
Polygeneration of products and energy carriers. To
compete with coal (chapter 8), biomass energy may have to follow a
polygeneration strategy - coproducing electricity, fuels, fibres, and food from
biomass. One example would be the generation of electricity by a BIG/CC plant as
well as any fluid that can be produced from the syngas: methanol, dimethyl ether
(DME), other liquids using Fischer-Tropps synthesis (Larson and Jin, 1999a;
Faaij and others, 1999). Another could combine biomass and fossil fuels to
coproduce modern energy carriers (Oonk and others, 1997).
|
BOX 7.3. BRAZIL’S NATIONAL ALCOHOL PROGRAMME
PRO-ALCOOL in Brazil is the largest programme of commercial
biomass utilisation in the world. Despite economic difficulties during some of
its 25 years of operation, it presents several environmental benefits, reduces
import expenditures, and creates jobs in rural areas.
Roughly 700,000 rural jobs in sugar-alcohol are distributed
among 350 private industrial units and 50,000 private sugarcane growers.
Moreover, the cost of creating a job in sugar-alcohol is much lower than in
other industries. But mechanical harvesting could change this.
Despite a small reduction in harvested surface, Brazilian
sugar-cane production has shown a continuous increase, reaching 313 million
tonnes in the 1998/99 season. Alcohol consumption has been steady, even though
almost no new hydrated ethanol powered automobiles are being produced. The
decline in consumption from the partial age retirement of this fleet has been
balanced by significant growth in the number of automobiles using a blend of 26
percent anhydrous ethanol in gasoline.
Subsidies were reduced in recent years in the southeast of
Brazil, where 80 percent of the ethanol is produced, and then fully removed
early in 1999. Some government actions - compulsory increases in the amount of
ethanol blended in gasoline and special financial conditions for acquisition of
new hydrated ethanol powered cars - have favoured producers. Very recently the
alcohol price at the pump stations was reduced, triggering the interest of
consumers and carmakers in hydrated ethanol cars. Other government policies may
include tax reductions on new alcohol cars, ‘green’ fleets, and mixing
alcohol-diesel for diesel motors.
Another promising option is the implementation of a large
cogeneration programme for sugar and alcohol. Revenues from electricity sales
could allow further reductions in the cost of alcohol production, although it is
not yet enough to make it competitive with gasoline in a free market. Even so,
production costs continue to come down from learning by doing.
The programme has positive environmental and economic impacts.
In 1999 it resulted in an emission reduction of almost 13 mega-tonnes of carbon.
And the hard currency saved by not importing oil totals $40 billion over the 25
years since alcohol’s introduction. |
|
BOX 7.4. BIOMASS USE IN SWEDEN
Sweden is probably the world leader in creating a working
biomass market. Its use of biomass for energy purposes - domestic heating with
advanced heating systems, district heating, and combined heat and power
generation - has increased 4 - 5-fold in the past 10 years. And the average
costs of biomass have come down considerably. Swedish forests have met this
growing demand with ease.
The growing contribution of biomass has been combined with a big
increase in the number of companies supplying wood and wood products and in the
number of parties using biomass. As a result competition has led to lower
prices, combined with innovation and more efficient biomass supply systems.
Some 14,000 hectares in short rotation willow plantations have
been established. Sweden also imports some biomass, which make up only a small
part of the total supply but keep prices low.
Sweden plans to increase the 20 percent share of biomass in the
total primary energy supply to 40 percent in 2020, largely by extending and
improving the use of residues from production forests and wood processing
industries (NUTEK, 1996). |
Internalising external costs and benefits. Bio-energy can
offer benefits over fossil fuels that do not show up in its cost - that is, it
can offer externalities. Being carbon-neutral is one. Another is the very low
sulphur content. A third is that biomass is available in most countries, while
fossil fuels often need to be imported. The domestic production of bio-energy
also brings macro-economic and employment benefits (Faaij, Meuleman, and others,
1998). It can offer large numbers of unskilled jobs (van den Broek and van Wijk,
1998). It has fewer external costs than (imported) coal and oil (Borjesson,
1999; Faaij, Meuleman, and others, 1998).
Policies. Carbon taxes, price supports, and long-running
research and development (R&D) programmes are often central in gaining
experience, building infrastructure developing technology, and fostering the
national market. Scandinavia and Brazil - and to a somewhat less extent
northwest Europe and the United States - show that modernisation is essential
for realising the promise of biomass as an alternative energy source
(Ravindranath and Hall, 1995). It may even help in phasing out agricultural
subsidies.
Conclusion
· Biomass can make a
large contribution to the future world’s energy supply. Land for biomass
production should not be a bottleneck, if the modernisation of conventional
agricultural production continues. Recent evaluations indicate that if land
surfaces of 400 - 700 million hectares were used for biomass energy production
halfway into the 21st century, there could be no conflicts with other land-use
functions and the preservation of nature.
· Bio-energy’s current
contribution of 45 ± 10 exajoules a year - of which probably 16 ± 6
exajoules a year is commercial - could increase to 100 - 300 exajoules a year in
the 21st century.
· The primary use of biomass for
modern production of energy carriers accounts for about 7 exajoules a year.
Modern biomass energy production can play an important role in rural
development.
· Although developing countries
are the main consumers of biomass, the potential, production, and use of biomass
in these countries are often poorly quantified and documented.
· Biomass can be used for energy
production in many forms. The resource use, the technologies applied, and the
set-up of systems will depend on local conditions, both physical and
socioeconomic. Perennial crops offer cheap and productive biomass production,
with low or even positive environmental impacts.
· Production costs of biomass
can be $1.5 - 2 a gigajoule in many regions. Genetic improvement and optimised
production systems - and multi-output production systems, cascading biomass, and
multifunctional land use - could bring bio-mass close to the (expected) costs of
coal.
· A key issue for bio-energy is
mod-ernising it to fit sustainable development. Conversion of biomass to modern
energy carriers (electricity, fuels) gives biomass commercial value that can
provide income and development for local (rural) economies.
· Modernised biomass use can be
a full-scale player in the portfolio of energy options for the longer term. The
production of electricity and fuels from lignocellulosic biomass are promising
options. But they require the development of markets, infrastructure, key
conversion technologies (BIG/CC), and advanced fuel production systems.
· Flexible energy systems
combining biomass and fossil fuels are likely to become the backbone for
low-risk, low-cost energy supply systems.
|
An accepted principle
is that biomass production
for
energy should not
conflict with food
production. |
Wind energy
Wind energy, in common with other renewable energy sources, is
broadly available but diffuse. The global wind resource has been described in
chapter 5. Wind energy was widely used as a source of power before the
industrial revolution, but later displaced by fossil fuel use because of
differences in costs and reliability. The oil crises of the 1970s, however,
triggered renewed interest in wind energy technology for grid-connected
electricity production, water pumping, and power supply in remote areas (WEC,
1994b).
In recent decades enormous progress has been made in the
development of wind turbines for electricity production. Around 1980 the first
modern grid-connected wind turbines were installed. In 1990 about 2,000
megawatts of grid-connected wind power was in operation world-wide - at the
beginning of 2000, about 13,500 megawatts. In addition, more than 1 million
water-pumping wind turbines (wind pumps), manufactured in many developing
countries, supply water for livestock, mainly in remote areas. And tens of
thousands of small battery-charging wind generators are operated in China,
Mongolia, and Central Asia (chapter
10).
The potential of wind energy
The technical potential of onshore wind energy to fulfil energy
needs is very large - 20,000 - 50,000 terawatt-hours a year (chapter 5). The
economic potential of wind energy depends on the economics of wind turbine
systems and of alternative options. Apart from investment costs, the most
important parameter determining the economics of a wind turbine system is annual
energy output, in turn determined by such parameters as average wind speed,
statistical wind speed distribution, turbulence intensities, and roughness of
the surrounding terrain. The power in wind is proportional to the third power of
the momentary wind speed.
Because of the sensitivity to wind speed, determining the
potential of wind energy at a specific site is not straightforward. More
accurate meteorological measurements and wind energy maps and handbooks are
being produced and (mostly) published, enabling wind project developers to
better assess the long-term economic performance of their projects.
In densely populated countries the best sites on land are
occupied, and public resistance makes it difficult to realise new projects at
acceptable cost. That is why Denmark and the Netherlands are developing offshore
projects, despite less favourable economics. Sweden and the United Kingdom are
developing offshore projects to preserve the landscape.
Resources offshore are much larger than those onshore, but to be
interesting they have to be close to electric infrastructure. A comprehensive
study by Germanische Lloyd and Garrad Hassan & Partners (Matthies and
others, 1995) concluded that around 3,000 terawatt-hours a year of electricity
could be generated in the coastal areas of the European Union (excluding Finland
and Sweden). With electricity consumption in those 12 countries at about 2,000
terawatt-hours a year, offshore options should be included in assessments of the
potential of wind
electricity.
Development of installed wind power
In 1997 the installed wind power was about 7,400 megawatts, in
1998 close to 10,000 megawatts, and in 1999 another annual 3,600 megawatts was
installed (BTM Consult, 1999 and 2000). Between 1994 and 1999 the annual growth
of installed operating capacity varied between 27 and 33 percent. The
electricity generated by wind turbines can be estimated at 18 terawatt-hours in
1998 and 24 terawatt-hours in 1999.
There are 29 countries that have active wind energy programmes.
Most of the capacity added in 1998 (2,048 megawatts) was in four countries: for
Germany 793 megawatts, for the United States 577 megawatts, for Spain 368
megawatts, and for Denmark 310 megawatts (table 7.6).
Based on an analysis of the national energy policies for the
most relevant countries, BMT Consult expects the global installed power to grow
to around 30,000 megawatts of electricity in 2004.
Several generic scenarios assess the growth of wind power in the
coming decades. One of the most interesting - by BTM Consult for the FORUM for
Energy & Development, presented at the COP-4 of the UN-FCCC in Buenos Aires
in December 1998 - addresses three questions. Can wind power contribute 10
percent of the world’s electricity needs within three decades? How long
will it take to achieve this? How will wind power be distributed over the world?
Two scenarios were developed. The recent trends scenario
extrapolates current market development, while the international agreements
scenario assumes that international agreements are realised. Both scenarios
assumed that integrating up to 20 percent of wind power in the grid (in energy
terms) would not be a problem with present grids, modern fossil fuel power
plants, and modern wind turbines. Analysis of the world’s exploitable wind
resources, with growth of electricity demand as indicated in the World Energy
Outlook (IEA, 1995 and 1996), led to the following conclusions:
· Under the recent
trends scenario - starting with 20,000 megawatts by the end of 2002 and assuming
a 15 percent cost reduction, and later 12 percent and 10 percent, for each
doubling of the accumulated number of installations - 10 percent penetration
is achieved around 2025, and saturation in 2030 - 35, at about 1.1
terawatt. In this scenario the cost of generating wind electricity would come
down to $0.032 a kilowatt-hour (1998 level) on average, ± 15 percent
(depending on wind speed, connection costs to the grid, and other
considerations).
· Under the international
agreements scenario - with the same starting conditions but a slightly different
learning curve - growth is faster and 10 percent penetration is achieved around
2016, with saturation in 2030 - 35 at about 1.9 terawatts. In this scenario the
cost would come down to $0.027 a kilowatt-hour on average, again ± 15
percent.
TABLE 7.6. INSTALLED WIND POWER, 1997 AND 1998
|
Installed megawatts 1997 |
Cumulative megawatts 1997 |
Installed megawatts 1998 |
Cumulative megawatts 1998 |
|
Canada |
4 |
26 |
57 |
83 |
|
Mexico |
0 |
2 |
0 |
2 |
|
United States |
29 |
1.611 |
577 |
2.141 |
|
Latin America |
10 |
42 |
24 |
66 |
|
Total Americas |
43 |
1.681 |
658 |
2.292 |
|
Denmark |
285 |
1.116 |
310 |
1.420 |
|
Finland |
5 |
12 |
6 |
18 |
|
France |
8 |
13 |
8 |
21 |
|
Germany |
533 |
2.081 |
793 |
2.874 |
|
Greece |
0 |
29 |
26 |
55 |
|
Ireland |
42 |
53 |
11 |
64 |
|
Italy |
33 |
103 |
94 |
197 |
|
Netherlands |
44 |
329 |
50 |
379 |
|
Portugal |
20 |
39 |
13 |
51 |
|
Spain |
262 |
512 |
368 |
880 |
|
Sweden |
19 |
122 |
54 |
176 |
|
United Kingdom |
55 |
328 |
10 |
338 |
|
Other Europe |
13 |
57 |
23 |
80 |
|
Total Europe |
1.318 |
4.793 |
1.766 |
6.553 |
|
China |
67 |
146 |
54 |
200 |
|
India |
65 |
940 |
52 |
992 |
|
Other Asia |
9 |
22 |
11 |
33 |
|
Total Asia |
141 |
1.108 |
117 |
1.224 |
|
Australia and New Zealand |
2 |
8 |
26 |
34 |
|
Pacific Islands |
0 |
3 |
0 |
3 |
|
North Africa (incl. Egypt) |
0 |
9 |
0 |
9 |
|
Middle East |
8 |
18 |
0 |
18 |
|
Former Soviet Union |
1 |
19 |
11 |
19 |
|
Total other continents and areas |
11 |
57 |
37 |
83 |
|
Annual installed capacity worldwide |
1.513 |
|
2.577 |
|
|
Cumulative capacity installed worldwide |
|
7.639 |
|
10.153 |
Note: The cumulative installed capacity by the end
of 1998 is not always equal to the 1997 data plus installed capacity during
1998, because of adjustments for decommissioned and dismantled capacity.
Source: BTM Consult, 1999.
In this second scenario, the regional distribution of wind power
is North America 23 percent, Latin America 6 percent, Europe (Eastern and
Western) 14 percent, Asia 23 percent, Pacific OECD 8 percent, North Africa 5
percent, former Soviet Union 16 percent, and rest of the world 5
percent.
Technology developments
Wind turbines become larger. From the beginning of the
modern wind energy technology era in the mid-1970s, there has been gradual
growth in the unit size of commercial machines. In the mid-1970s the typical
size of a wind turbine was 30 kilowatts of generating capacity, with a rotor
diameter of 10 metres. The largest units installed in 1998 had capacities of
1,650 kilowatts with rotor diameters of 66 metres. By 1999, 460 units with a
generating capacity of 1 megawatt or more were installed world-wide. Turbines
with an installed power of 2 megawatts (70 metres diameter) are being introduced
in the market, and 3 - 5 megawatt machines are on the drawing board (table 7.7).
Market demands drive the trend towards larger machines:
economies of scale, less visual impacts on the landscape per unit of installed
power, and expectations that offshore potential will soon be developed. The
average size of wind turbines installed is expected to be 1,200 kilowatts before
2005 and 1,500 kilowatts thereafter. Note, however, that the optimum size of a
turbine - in cost, impact, and public acceptance - differs for onshore (nearby
as well as remote) and offshore applications.
Wind turbines become more controllable and
grid-compatible. The output of stall regulated wind turbines is hardly
controllable, apart from switching the machine on and off. Output varies with
the wind speed until reaching the rated wind speed value. As the application of
the aerodynamic stall phenomena to structural compliant machines gets more
difficult with bigger turbines, blade pitch control systems are being applied to
them. For structural dynamics and reliability, a blade-pitch system should be
combined with a variable speed electric conversion system. Such systems
typically incorporate synchronous generators combined with electronic AC-DC-AC
converters.
TABLE 7.7. AVERAGE SIZE OF INSTALLED WIND TURBINES, 1992 -
99
|
Year |
Size (kilowatts) |
|
1992 |
200 |
|
1994 |
300 |
|
1996 |
500 |
|
1998 |
600 |
|
1999 |
700 |
Modern electronic components have enabled designers to control
output - within the operational envelope of the wind speed - and produce
excellent power quality. These developments make wind turbines more suitable for
integration with the electricity infrastructure and ultimately for higher
penetration. These advantages are of particular interest for weak grids, often
in rural and remote areas that have a lot of wind.
Wind turbines will have fewer components. For lower costs
and greater reliability and maintainability, designers now seek technology with
fewer components - such as directly driven, slow-running generators, with
passive yaw and passive blade pitch control. In Germany 34 percent of the
installed power in 1998 (770 megawatts) was realised with this type of
technology.
Special offshore designs are on the drawing board. With
the first offshore wind farms in Europe, industrial designers are developing
dedicated turbine technologies for large wind farms in the open sea (Beurskens,
2000). Outages onshore can often be corrected quickly so that only a small
amount of energy is lost. But offshore the window for carrying out repairs or
replacing components is often limited. The high cost of complete installations
implies the use of large wind turbines, which will probably have installed
powers of 3 - 6 megawatts. Offshore design features will include novel
installation concepts, electricity conversion and transport systems, corrosion
protection, and integration with external conditions (both wind and wave
loading).
Time to market is becoming shorter than project preparation
time. Although there is a temporary shortage of supply of wind turbines in
some countries, competition among manufacturers is fierce. One way to become
more competitive is to keep implementing innovations and component improvements
to reduce cost. Times to market new products are also becoming short (two to
three years). As a result, just as the construction of a wind farm commences,
the technology is already
outdated.
System aspects
Wind turbines deliver energy, but little capacity.
Because wind energy is intermittent, wind turbines mainly deliver energy, but
little capacity value often 20 percent or less of the installed wind power. And
this percentage falls when the penetration of wind turbines increases, requiring
even more back-up power for a reliable energy supply. But wind-generated
electricity can be transformed from intermittent to baseload power if it is
combined with, say, compressed air energy storage. In this way a high capacity
factor can be achieved with a small economic penalty, potentially about $0.01 a
kilowatt-hour (Cavallo, 1995). This option becomes attractive when wind
electricity generation costs fall below $0.03 a kilowatt-hour. It also opens the
possibility of exploiting wind resources remote from markets, as in the Great
Plains of the United States (Cavallo, 1995) and in inner Mongolia and northwest
China (Lew and others, 1998).
Wind power becomes more predictable. Meteorological
research on predicting the output of wind farms a few hours in advance has
produced computer programs that optimise the operational and fuel costs of
regional electricity production parks (Denmark, Germany). This will increase the
capacity value of wind power and the value of the electricity produced.
Capacity factors are somewhat adjustable. Some general
misconceptions sometimes lead to the wrong decisions or conclusions. The
capacity factor (annual energy output/output based on full-time operation at
rated power) depends on local winds and wind turbines. By optimising the turbine
characteristics to the local wind regime, the capacity factor - now often 20 -
25 percent - can be optimised without losing too much energy output. But extreme
capacity factors - say, 40 percent - automatically means a large loss of
potential energy output.
Renewed interest in autonomous systems. In the mid-1980s
interest grew in the application of wind turbines in isolated areas without an
energy infrastructure. Two systems can be distinguished:
· Hybrid systems, in
which a wind turbine operates in parallel with, for example, a diesel set (to
save fuel consumption and to decrease maintenance and repairs) or a diesel
generator combined with a battery storage unit.
· Standalone units, for charging
batteries, pumping water for irrigation, domestic use, watering cattle, or
desalination and cooling.
More than 30 experimental hybrid systems have been developed and
tested, almost all stopped without a commercial follow up, because of unreliable
and expensive components. The interest in hybrid and standalone systems is being
revived - initiated by the search for new markets for renewable energy systems
and influenced by spectacular improvements in performance and cost for wind
turbines and power electronics (box 7.5 and chapter 10). For successful market
entry, systems have to be modular, and standards for components and subsystems
introduced.
Small battery-charging wind generators are manufactured by the
thousand in China, Mongolia, and elsewhere, making them more numerous than
larger diameter wind generators. Although their contribution to world energy
supply is negligible, their potential impact on the energy needs of rural and
nomadic families is significant (as with photovoltaic home
systems).
Environmental aspects
Environmental aspects come into play in the three phases of a
wind turbine project: building and manufacturing, normal operation during the
turbine’s lifetime, decommissioning
|
Industrial designers
are developing dedicated
turbine
technologies for
large wind farms in
the open sea. |
Building and manufacturing. No exotic materials or
manufacturing processes are required in producing a wind turbine or building the
civil works. The energy payback time of a large wind turbine, under typical
Danish conditions, is 3 to 4 months (Dannemand Andersen, 1998).
Normal operation. Negative environmental aspects
connected to the use of wind turbines are: acoustic noise emission, visual
impact on the landscape, impact on bird life, moving shadows caused by the
rotor, and electromagnetic interference with radio, television, and radar
signals. In practice the noise and visual impact cause the most problems.
Acoustic noise emission prevents designers from increasing the tip speed of
rotor blades, which would increase the rotational speed of the drive train shaft
and thus reduce the cost of gearboxes or generators. Aero-acoustic research has
provided design tools and blade configurations to make blades considerably more
silent, reducing the distance needed between wind turbines and houses.
The impact on bird life appears to be minor if the turbines are
properly located. A research project in the Netherlands showed that the bird
casualties from collisions with rotating rotor blades on a wind farm of 1,000
megawatts is a very small fraction of those from hunting, high voltage lines,
and vehicle traffic (Winkelman, 1992). In addition, acoustic devices might help
prevent birds from flying into rotor blades (Davis, 1995).
During normal operation a wind turbine causes no emissions, so
the potential to reduce carbon dioxide emissions depends on the fuel mix of the
fossil-fuelled plants the wind turbine is working with. A study by BTM Consult
(1999) indicates that in 2025 wind energy could prevent the emission of 1.4 -
2.5 gigatonnes of carbon dioxide a year.
Decommissioning. Because all components are conventional,
the recycling methods for decommissioning the wind turbine are also
conventional. Most blades are made from glass or carbon fibre reinforced
plastics, processed by incineration. To replace glass and carbon and close the
cycle of material use, wood composites are being applied and biofibres
developed.
|
BOX 7.5. HYBRID WIND, BATTERY, AND DIESEL SYSTEMS IN
CHINA
Since 1994 the 360 inhabitants of the village of Bayinaobao in
Inner Mongolia have been provided with electricity from a hybrid electricity
system that employs two 5-kilowatt wind turbines, a battery storage unit, and a
diesel generator. In this system the wind turbines provide about 80 percent of
the electricity generated. The technology is being developed under a
German-Chinese industrial joint venture aimed at transferring the
German-developed wind turbine and ancillary technologies. By the time 140
systems have been built, local content should account for about 70 percent of
the wind turbine technology, reducing the cost of an imported system by half.
Based on the performance of the first unit and the costs projected for
components, the electricity from the hybrid system will cost less (up to 22
percent less, at a diesel fuel price of $0.38 a litre) than from the
conventional diesel system (Weise and others, 1995). |
Economic aspects
The energy generation costs of wind turbines are basically
determined by five parameters:
· Turnkey project
cost. Initial investment costs (expressed in U.S. dollars a square metre of
swept rotor area), project preparation, and infrastructure make up the turnkey
project costs. The costs of European wind turbines are typically $410 a square
metre (machine cost, excluding foundation). Project preparation and
infrastructure costs depend heavily on local circumstances, such as soil
conditions, road conditions, and the availability of electrical substations.
Turnkey costs vary from $460 a square metre to $660 a square metre (with 1 ECU =
1.1 U.S. dollar).
· Energy output of the
system. The energy output of a wind turbine can be estimated by E =
b. V3 kilowatt-hours a square metre, where E is the annual
energy output, b is the performance factor, and V is the average wind
speed at hub height. The factor b depends on the system efficiency of the
wind turbine and the statistical distribution of wind speeds. In coastal
climates in Europe a value of 3.15 for b is representative for modern
wind turbines and not too far away from the theoretical maximum. On good
locations in Denmark, northern Germany, and the Netherlands annual outputs of
more than 1,000 kilowatt-hours a square metre are often achieved.
· Local average wind speed.
In general, local average wind speed should exceed five metres a second at a
height of 10 metres to allow economic exploitation of grid-connected wind
turbines. Availability of the system. The technical availability of
modern wind farms exceeds 96 percent.
· Lifetime of the system.
Design tools have improved so much that designing on the basis of fatigue
lifetime has become possible. As a result one can confidently use lifetimes of
15 - 20 years for economic calculations.
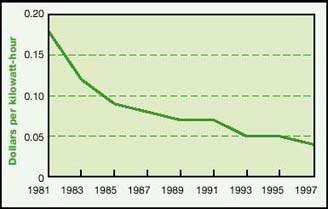
FIGURE 7.2. DEVELOPMENT OF WIND
ELECTRICITY GENERATION COSTS IN DENMARK, 1981 - 1997
Source: BTM Consult, 1999.
For Europe a state-of-the-art reference calculation uses the
following values:
|
Turnkey cost |
$600 a square metre |
|
Interest |
5 percent |
|
Economic lifetime |
15 years |
|
Technical availability |
95 percent |
|
Annual energy output |
3.15 V3 kilowatt-hours a square metre |
|
O & M costs |
$0.005 a kilowatt-hour |
If average wind speeds at the hub height range from 5.6 - 7.5
metres a second, the corresponding electricity production cost is $0.12 - 0.05 a
kilowatt-hour. Because the energy of the wind is proportional to the third power
of the wind speed, the economic calculations are very sensitive to the local
average annual wind speed.
Figure 7.2 illustrates the cost reductions for electricity
generation from wind turbines in Denmark since 1981. But take care in
translating these figures to other regions, for the cost of project preparation,
infrastructure, and civil works in Denmark is low relative to many other
regions. BTM Consult (1999) expects a 35 - 45 percent reduction in generation
costs in the next 15 - 20 years (figure
7.3).
Implementation issues
Manufacturers and project developers usually identify the
following items as serious barriers for efficient implementation of wind turbine
projects:
· Fluctuating demand
for wind turbines as a result of changing national policies and support schemes.
· Uncertainties leading to
financing costs as a result of changing governmental policies.
· Complicated, time-consuming,
and expensive institutional procedures, resulting from a lack of public
acceptance, which varies consid-erablyfrom country to country.
· Project preparation time often
longer than the ‘time to market’ of new wind turbine types.
· Lack of sufficient
international acceptance of certification procedures and standards.
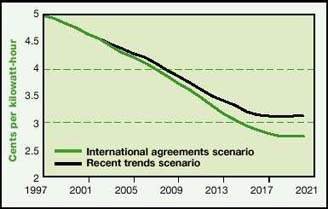
FIGURE 7.3. POTENTIAL COST
REDUCTIONS FOR WIND POWER, 1997 - 2020
Source: BTM Consult, 1999.
Denmark and the United States were the first to introduce an
integrated approach to wind energy, encompassing both technical development and
the introduction of market incentives. Now more than 25 countries use a great
variety of incentives, some very successful and some complete failures. The
applied incentive schemes can be grouped in three categories, or in combinations
of these categories:
· Fixed tariff
systems, such as those of Denmark, Germany, and Spain (favourable payback
tariffs are fixed for a period of, say, 10 years).
· Quota or concession systems,
such as the Non Fossil Fuel Obligation of England and the systems of France,
Ireland, and Scotland (competitive bidding for projects until a set amount of
electricity production is realised).
· Other systems to stimulate the
application of wind energy, such as tax breaks, carbon taxes, green electricity,
and tradable green labels.
With the first schemes, Denmark, Germany, and Spain installed
many more wind turbines than countries using other schemes. Elsewhere in Europe,
the second system has demonstrated success also (table 7.8). But none of the
schemes can be easily translated from one country to another. Legal
circumstances and public acceptance may differ completely. Moreover, several
incentives have been introduced only recently, and their effectiveness is not
yet known.
Under favourable legislation and general acceptance by the
public, a fixed tariff system may be quite successful, because it provides
financial security to project developers, owners, and financiers. In the long
term, however, fixed tariffs will become too expensive to subsidise if they are
not modified. As a result the industry might collapse unless the incentive
program brings the cost of the technology down. Quota systems based on calls for
tenders only once in two or three years may lead to extreme fluctuations in the
market growth. Concessions appear interesting for harnessing large, high-quality
wind resources in regions remote from major electricity markets (PCAST, 1999).
However, very large wind projects for remote wind resources require a different
industry structure from today’s. Needed are large project developers with
deep financial pockets - not wind turbine suppliers. The installation of wind
turbines can also increase if individuals, groups of individuals, or
cooperatives are allowed to own one or more wind turbines as small independent
power producers (IPPs) and to sell electricity to the grid.
It is too early to judge whether tradable green certificates,
connected to a quota system, are viable. Marketing green electricity seems to
developsuccessfully only when the public recognises green electricity as a
product different from regular electricity, worth the additional costs.
TABLE 7.8. TYPE OF INCENTIVE AND WIND POWER ADDED IN
1998
|
Type of incentive |
Country |
Megawatts added |
Percentage increase |
|
Fixed tariffs |
Denmark |
310 |
28 |
|
Germany |
793 |
38 |
|
Spain |
368 |
72 |
|
Total |
1,471 |
40 |
|
Quota or concession systems |
France |
8 |
62 |
|
Ireland |
11 |
21 |
|
United Kingdom |
10 |
3 |
|
Total |
29 |
7 |
Conclusion
· The potential of
wind energy is large, with the technical potential of generating electricity
onshore estimated at 20,000 - 50,000 terawatt-hours a year.
· When investigating the
potential, special attention should go to possibilities offshore. Studies for
Europe indicate that the offshore wind resources that can be tapped are bigger
than the total electricity demand in Europe.
· The average growth rate of the
cumulative capacity over the last six years has been about 30 percent a year,
bringing the cumulative installed wind turbine capacity to about 10,000
megawatts at the end of 1998 and about 13,500 megawatts at the end of 1999 - and
wind energy production to 18 terawatt-hours in 1998 and 24 terawatt-hours in
1999.
· Wind turbines are becoming
larger, with the average size installed in 1998 at 600 kilowatts, up from about
30 kilowatts in the mid-1970s. Turbines of megawatt size are being developed and
should soon be commercially available.
· Costs have to come down
further, requiring development of advanced flexible concepts and dedicated
offshore wind energy systems. Cost reductions up to 45 percent are feasible
within 15 years. Ultimately wind electricity costs might come down to about
$0.03 a kilowatt-hour.
· Although wind-generated
electricity is an intermittent resource, it can be transformed to baseload power
supply if combined with energy storage. For compressed air energy storage the
additional costs may be limited to about $0.01 a kilowatt-hour, opening the
possibility of exploiting good wind resources remote from markets.
· The environmental impacts of
wind turbines are limited, with noise and visibility causing the most problems,
increasing public resistance against the installation of new turbines in densely
populated countries.
· Interest in small turbines is
being revived for standalone and autonomous systems in rural
areas.
Photovoltaic solar energy
Photovoltaic solar energy conversion is the direct conversion of
sunlight into electricity. This can be done by flat plate and concentrator
systems.
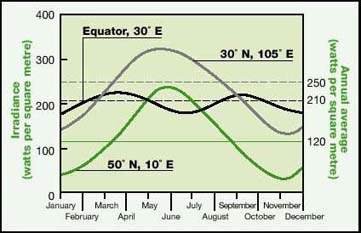
FIGURE 7.4. VARIATIONS IN AVERAGE
MONTHLY INSOLATION OVER THE YEAR IN THREE LOCATIONS
Source: Eliasson, 1998.
TABLE 7.9. POTENTIAL CONTRIBUTION OF SOLAR ENERGY
TECHNOLOGIES TO WORLD ENERGY CONSUMPTION ACCORDING TO DIFFERENT STUDIES
(EXAJOULES OF ELECTRICITY)
|
Study |
2020 - 2025 |
2050 |
2100 |
|
WEC, 1994 a,b |
16 |
|
|
|
IIASA and WEC, 1998 |
2 - 4 |
7 - 14 |
|
|
RIGES, 1993 (solar and wind) |
17 |
35 |
|
|
Shell, 1996 |
<10 |
200 |
|
|
Greenpeace and SEI, 1993(solar and wind) |
90 |
270 |
830 |
|
Reference: total world energy consumption |
400 - 600 |
400 - 1,200 |
|
An essential component of these systems is the solar cell, in
which the photovoltaic effect - the generation of free electrons using the
energy of light particles - takes place. These electrons are used to generate
electricity.
Characteristics of the source
Solar radiation is available at any location on the surface of
the Earth. The maximum irradiance (power density) of sunlight on Earth is about
1,000 watts a square metre, irrespective of location. It is common to describe
the solar source in terms of insolation - the energy available per unit of area
and per unit of time (such as kilowatt-hours per square metre a year). Measured
in a horizontal plane, annual insolation varies over the Earth’s surface by
a factor of 3 - from roughly 800 kilowatt-hours per square metre a year in
northern Scandinavia and Canada to a maximum of 2,500 kilowatt-hours per square
metre a year in some dry desert areas.
The differences in average monthly insolation (June to December)
can vary from 25 percent close to the equator to a factor of 10 in very northern
and southern areas (figure 7.4), determining the annual production pattern of
solar energy systems. The ratio of diffuse to total annual insolation can range
from 10 percent for bright sunny areas to 60 percent or more for areas with a
moderate climate, such as Western Europe. The actual ratio largely determines
the type of solar energy technology that can be used (non-concentrating or
concentrating).
The potential of photovoltaic solar energy
The average power density of solar radiation is 100 - 300 watts
a square metre. The net conversion efficiency of solar electric power systems
(sunlight to electricity) is typically 10 - 15 percent. So substantial areas are
required to capture and convert significant amounts of solar energy to fulfil
energy needs (especially in industrialised countries, relative to today’s
energy consumption). For instance, at a plant efficiency of 10 percent, an area
of 3 - 10 square kilometres is required to generate an average of 100 megawatts
of electricity - 0.9 terawatt-hours of electricity or 3.2 petajoules of
electricity a year - using a photovoltaic (or solar thermal electricity) system.
The total average power available at the Earth’s surface in
the form of solar radiation exceeds the total human power consumption by roughly
a factor of 1,500. Calculated per person, the average solar power available is 3
megawatts, while the consumption varies from 100 watts (least industrialised
countries) to 10 kilowatts (United States), with an average of 2 kilowatts.
Although these numbers provide a useful rough picture of the absolute boundaries
of the possibilities of solar energy, they have little significance for the
technical and economic potential. Because of differences in the solar energy
supply pattern, energy infrastructure, population density, geographic
conditions, and the like, a detailed analysis of the technical and economic
potential of solar energy is best made regionally or nationally. The global
potential is then the sum of these national or regional potentials.
The economic potential of solar energy, a matter of
debate, depends on the perspectives for cost reduction. In the recent past
several scenario studies have assessed the potential application of solar energy
technologies (IIASA and WEC, 1998; WEC, 1994a,b; Johansson and others, 1993a;
Shell, 1996; Greenpeace and SEI, 1993). They provide a picture of different
views on the potential penetration of solar energy in the 21st century (table
7.9).
The technical potential of photovoltaics has been studied
in some detail in several countries. In densely populated countries with a
well-developed infrastructure, there is an emphasis on applications of
grid-connected photovoltaic systems in the built environment (including
infrastructural objects like railways and roads). These systems are necessarily
small- or medium-sized, typically 1 kilowatt to 1 megawatt.1 The
electricity is generated physically close to the place where electricity is also
consumed. In less densely populated countries there is also considerable
interest in ‘ground-based’ systems, generally larger than 1 megawatt.
The area that would be required to generate an average electrical power equal to
the total present human power consumption - assuming 10 percent plant efficiency
and an insolation of 2,000 kilowatt-hours per square metre a year - is roughly
750 x 750 square kilometres. In countries or rural regions with a weak or
incomplete grid infrastructure, small standalone systems and modular electric
systems may be used for electrification of houses or village
communities.
Photovoltaic market developments
Between 1983 and 1999 photovoltaic shipments grew by just over
15 percent a year (figure 7.5). In 1998 around 150 megawatts of solar cell
modules were produced, in 1999 nearly 200 megawatts. In 1998 cumulative
production was around 800 megawatts. Probably about 500 megawatts, perhaps 600
megawatts, of this production was in operation in 1998, generating about 0.5
terawatt-hours a year. In 1993 - 98 operating capacity increased by roughly 30
percent a year.
In 1990 - 94 the market share of solar home systems and village
power systems was 20 percent (based on power volume). Grid-connected systems
accounted for 11 percent, with the rest for water pumping, communication,
leisure, consumer products, and the like (EPIA and Altener, 1996). In 1995 - 98
the relative importance of grid-connected systems increased to 23 percent
(Maycock,
1998).
Current status and future development of photovoltaic solar cells and modules
The major component of photovoltaic solar energy systems is the
solar module, normally a number of solar cells connected in series. The
efficiency of an ideal photovoltaic cell is about 30 percent at most (for a
single cell under natural sunlight). Higher efficiencies can be achieved by
stacking cells with different optical properties in a tandem device, by using
concentrator cells, or by combining these two. The efficiency of practical solar
cells is determined by several loss mechanisms. An overview of efficiencies
achieved through 1999 for different cells and modules is given in table 7.10.
Solar cells and their corresponding modules can be divided into
two main categories: wafer-type and thin-film. Wafer-type cells are made from
silicon wafers cut from a rod or ingot, or from silicon ribbons. Thin-film cells
are deposited directly onto a substrate (glass, stainless steel, plastic). For
flat-plate applications, the individual cells are connected in series to form a
module. Solar cells for concentrator systems are mounted in a one-dimensional or
two-dimensional optical concentrator.
FIGURE 7.5. PHOTOVOLTAIC
SHIPMENTS, 1983 - 1999
Source: Based on a Maycock, 1998; PVIR,
1999.
TABLE 7.10. IMPORTANT PHOTOVOLTAIC SOLAR CELL AND MODULE
TECHNOLOGIES
|
Technology |
Symbol |
Characteristic |
Record efficiency laboratory cells (percent) |
Typical efficiency commercial flat-plate modules
(percent) |
|
Single crystal silicon |
sc-Si |
Wafer-type |
24 |
13 - 15 |
|
Multi-crystalline silicon |
mc-Si |
Wafer-type |
19 |
12 - 14 |
|
Crystalline silicon films on ceramics |
f-Si |
Wafer type |
17 |
(8 - 11) |
|
Crystalline silicon films on glass |
|
Thin film |
9 |
|
|
Amorphous silicon (including silicon-germanium tandems) |
a-Si |
Thin film |
13 |
6 - 9 |
|
Copper-indium/gallium-diselenide |
CIGS |
Thin film |
18 |
(8 - 11) |
|
Cadmium telluride |
CdTe |
Thin film |
16 |
(7 - 10) |
|
Organic cells (including dye-sensitised titanium dioxide cells)
|
|
Thin film |
11 |
|
|
High-efficiency tandem cells |
III-V |
Wafer-type and thin film |
30 |
|
|
High-efficiency concentrator cells |
III-V |
Wafer-type and thin-film |
33 (tandem)
28 (single) |
|
Note: Numbers in parentheses are results from pilot
production or first commercial production.
Source: Green and others, 1999.
For the technologies in table 7.10, sc-Si, mc-Si, and a-Si are
fully commercial, with the first two taking 85 percent of the 1998 commercial
market, and the third 13 percent. (PVIR, 1999). CIGS and CdTe are emerging
commercial technologies, whereas f-Si and one form of crystalline silicon films
on glass appear to be in a pilot production phase. Organic cells are still in a
laboratory stage, though dye-sensitised titanium dioxide cells are considered
for near-term indoor applications. High-efficiency cells are used in
concentrator systems.
It is still too early to identify winners or losers among the
photo-voltaic technologies under development or in production. There is
reasonable consensus that thin-film technologies generally offer the best
long-term perspective for very low production cost. But crystalline silicon
wafer technology also still has a huge potential for cost reduction through
economies of scale and technological improvements. This perspective recently
triggered major investments in new production capacity. So it is not yet clear
when thin films will become dominant in the photovoltaics market.
The conversion efficiency of commercial modules should increase
steadily over the next decades (irrespective of the technology). For the medium
term (2010) the efficiency is likely to be about 12 - 20 percent (Maycock,
1998), and for the longer term (beyond 2020) possibly 30 percent or even
somewhat more (EUREC Agency, 1996). Note, however, that this is based on an
evaluation of what is physically possible, not on what could be done
technologically at low cost. Moreover, it is not expected that these high
efficiencies can be obtained by simple extrapolation of today’s commercial
technologies. It is not very likely that modules with the lowest manufacturing
cost per watt have the highest
efficiency.
System aspects
Photovoltaic system components. To make use of the
electricity from photovoltaic cells and modules, one has to build a complete
system, also comprising electronic parts, support structures, and sometimes
electricity storage. It is customary to use the term balance-of-system (BOS) for
the sum of system components and installation excluding modules.
Type and size of photovoltaic systems. Photovoltaics can
be used in a wide variety of applications, from consumer products and small
standalone units for rural use (such as solar home systems and solar lanterns)
to grid-connected rooftop systems and large power stations. Typical system size
varies from 50 watts to 1 kilowatt for standalone systems with battery storage,
from 500 watts to 5 kilowatts for rooftop grid-connected systems, and from 10
kilowatts to many megawatts for grid-connected ground-based systems and larger
building-integrated systems. Of these market segments, rural electrification for
sustainable development and building-integrated systems (as forerunners of
large-scale implementation) are expected to grow rapidly because of concentrated
marketing efforts and financial incentives.
Need for storage. Because photovoltaic modules offer an
intermittent source of energy, most standalone systems are equipped with battery
storage (usually a lead-acid battery) to provide energy during the night or
during days with insufficient sunshine. In some cases batteries store energy
during longer periods. When using grid-connected photovoltaic systems, the grid
serves as ‘virtual storage’: electricity fed into the grid by
photovoltaics effectively reduces the use of fuel by power plants fired by coal,
oil, or gas.
Performance ratio of photovoltaic systems. It is of great
practical importance to be able to predict the actual energy that a
photo-voltaic system of a certain size feeds into the grid. But that requires
reliable information on the insolation in the plane of the system, on the system
power under standard test conditions, and on the system losses. For simplicity,
all system losses in grid-connected photo-voltaic systems are taken together in
the performance ratio, which is the ratio of the time-averaged system efficiency
to the module efficiency under standard conditions. For grid-connected
photo-voltaic systems the state-of-the-art performance ratio, now typically 0.75
- 0.85, could increase to 0.9 in the longer term. For state-of-the-art
standalone systems the typical performance ratio is
0.6.
Environmental aspects
Environmental life-cycle analysis. Solar technologies do
not cause emissions during operation, but they do cause emissions during
manufacturing and possibly on decommissioning (unless produced entirely by
‘solar breeders’). With the industry growing, there is now
considerable interest in environmental aspects of solar technologies.
Environmental life-cycle analyses of photovoltaic systems and components (Alsema
and Nieuwlaar, 1998) are already leading to the development of different
materials and processes in the manufacturing of photovoltaic modules (see Tsuo
and others, 1998). An example is developing water-based pastes instead of pastes
based on organic solvents for screen printing. In addition, several recycling
processes have been developed for off-spec or rejected modules.
Energy payback time. One of the most controversial issues
for photovoltaics is whether the amount of energy required to manufacture a
complete system is smaller or larger than the energy produced over its lifetime.
Early photovoltaic systems were net consumers of energy rather than producers.
In other words, the energy payback time of these systems was longer than their
lifetime. This situation has changed and modern grid-connected rooftop
photovoltaic systems now have payback times much shorter than their (expected)
technical lifetime of roughly 30 years (Alsema, Frankl, and Kato, 1998) (table
7.11).
For grid-connected ground-based systems the energy payback time
of the balance of system is longer than for rooftop systems, because of
materials used in foundation and support. The energy payback time, now three to
nine years, will decrease to one to two years.
For standalone photovoltaic systems with battery storage (such
as solar home systems) the situation is less favourable than for grid-connected
systems, because of the long energy payback time associated with the (lead-acid)
battery. At an insolation of 2,000 kilowatt-hours per square metre a year, the
energy payback time of modern solar home systems is now seven to 10 years
(Alsema and Nieuwlaar, 1998). This number may come down to roughly six years, of
which five are due to the battery. Since the technical lifetime of a battery in
a photovoltaic system is usually five years or less, the direct effectiveness of
(present generation) solar home systems for the reduction of greenhouse gas
emissions is a matter of debate.
|
The total average power available at the
Earth's surface in
the form of solar
radiation exceeds the total human
power consumption
by
roughly a factor
of 1,500. |
Carbon dioxide mitigation potential. The carbon dioxide
mitigation potential of photovoltaics can be roughly inferred from the data on
energy payback time, assuming that emissions of greenhouse gases (SF6
and CF4) related to photovoltaic cell and module production are
effectively minimised. As an example, a photovoltaic system with an energy
payback time of two years at 1,500 kilowatt-hours per square metre a year and a
technical lifetime of 30 years (ratio 1:15) will produce 15 kilowatt-hours of
electricity without emissions for each kilowatt-hour of electricity
‘invested’ in manufacturing. Specific carbon dioxide emissions are
therefore fifteen times lower than those of the relevant fuel mix - the mix used
in supplying the total photovoltaics industry chain with energy.
Materials availability. The crystalline silicon
photovoltaics industry has so far used off-grade material from the semiconductor
industry as its feedstock. Very fast growth of the crystalline silicon
photo-voltaics industry would require dedicated production of ‘solar
grade’ silicon (Bruton and others, 1997). Although several processes for
solar grade silicon have been developed to a laboratory scale, none has been
taken into commercial production. It is expected, however, that new feedstock
can be made available in time if necessary. The availability of some of the
elements in thin-film photovoltaic modules (like indium and tellurium) is a
subject of concern. There apparently are no short-term supply limitations, but
the match between demand from the photovoltaics industry and world market supply
may become an issue at very large (multiple gigawatts a year) production levels
(Johansson and others, 1993b). CdTe and CIGS may therefore be valuable bridging
technologies (Andersson, 1998).
TABLE 7.11. ESTIMATED ENERGY PAYBACK TIME OF GRID-CONNECTED
ROOFTOP PHOTOVOLTAIC SYSTEMS (YEARS)
|
State of the art |
Near to medium term (<10 years) |
Long term |
|
Modules |
|
|
|
|
Crystalline silicon |
3 - 8 |
1.5 - 2.5 |
<1.5 |
|
Thin film |
2 - 3 |
0.5 - 1.5 |
<0.5 |
|
Balance of system |
<1 |
0.5 |
<0.5 |
|
Total system |
|
|
|
|
Crystalline silicon |
4 - 9 |
2 - 3 |
<2 |
|
Thin film |
3 - 4 |
1 - 2 |
<1 |
Note: Based on an insolation of 1,500 kilowatt-hours
per square metre a year.
Source: Alsema, Frankl and Kato, 1998.
Health. Of special concern is the acceptance of
cadmium-containing photovoltaic modules. The cadmium content of CdTe (and CIGS)
modules appears to be well within limits for safe use (Alsema and Nieuwlaar,
1998). And production processes can fulfil all applicable requirements. But
political and public acceptance is not automatic. Therefore, there are efforts
to eliminate cadmium from CIGS modules even at the cost of a reduced efficiency.
Also a closed cycle for reclaiming and recycling of disposed CdTe modules has
been developed (Bohland and others,
1998).
Economic aspects
Photovoltaic system cost. The turnkey cost of a
photovoltaic system is determined by the module cost and by the
balance-of-system (BOS) costs, which contains the cost of all other system
components, electrical installation costs, and costs associated with building
integration, site preparation, erection of support structures, and so on. The
turnkey price is generally 20 - 40 percent higher than the cost.
In 1998 photovoltaic module prices were $3 - 6 a watt, depending
on supplier, type, and size of order (Maycock, 1998; IEA PVPS, 1998). The prices
of complete photovoltaic systems vary widely with system type and size, and from
country to country (Thomas and others, 1999; IEA PVPS, 1998). But $5 - 10 a watt
for grid-connected systems and $8 - 40 a watt for standalone systems are
considered representative today.
The future cost and price reduction of photovoltaic modules and
systems can be evaluated in two ways. The first is by detailed analysis of
manufacturing costs for a specific technology as function of technology
improvements and innovations - and of production volumes. The second is by
general analysis of photovoltaic markets and industries, using a learning curve
approach. (Note that the second approach deals with prices rather than costs.)
TABLE 7.12. POSSIBLE COSTS OF GRID-CONNECTED PHOTOVOLTAIC
SYSTEMS, BASED ON DIFFERENT EVALUATIONS OF PHOTOVOLTAIC PRODUCTION TECHNOLOGIES
(APPROACH 1) (1998 DOLLARS PER WATT)
|
Element |
1998 |
Short term (to 2005) |
Medium term (2005 - 15) |
Long term (after 2015) |
|
Modules |
3 - 4 |
1 - 2 |
0.5 - 1.0 |
£ 0.5 |
|
Balance of system |
2 - 6 |
1 - 2 |
0.5 - 1.0 |
£ 0.5 |
|
Turnkey systems |
5 - 10 |
2 - 4 |
1 - 2 |
£ 1.0 |
Note: Prices are 20 - 40 percent higher than
costs.
|
It is still too early to identify
winners or losers
among
the photovoltaic technologies
under development or
in production.
|
· Approach 1.
For crystalline silicon technologies, the manufacturing cost of solar cell
modules can be reduced from the present $3 - 4 a watt down to $1.5 - 2 a watt in
the short term and to around $1 a watt in the longer term. For thin films (a-Si,
CdTe, and CIGS), the module costs are expected to fall to $1 - 1.5 a watt in the
short term, $0.5 - 1 a watt in the longer term (Carlson and Wagner, 1993; Bruton
and others, 1997; Little and Nowlan, 1997; Maycock, 1998). EUREC Agency (1996,
p.84) even mentions module costs as low as $0.30 a watt. The corresponding
prices are again 20 - 40 percent higher.
The balance-of-system costs for rooftop and ground-based
grid-connected systems are now typically $2 - 6 a watt. Improvements and
economies of scale in power electronics, integration in the building process,
and standardisation will enable reductions to $1 - 2 a watt in the short term,
$0.5 a watt in the longer term. The turnkey system cost is therefore expected to
decrease to $2 - 4 a watt in the short to medium term and to $1.0 - 1.5 a watt
in the longer term. Ultimately (after 2015) system costs around or even below $1
a watt are foreseen (Johansson and others, 1993b; WEC, 1994b; B�er, 1998),
resulting in prices of roughly $1 a watt (table 7.12). For such extremely low
prices it is necessary to use very cheap modules with high efficiencies (15 - 30
percent), to reduce area-related balance of system costs.
· Approach 2. An
evaluation of the development of photovoltaic (mostly module) costs and prices
using a learning curve can be found in IIASA and WEC (1998), Maycock (1998), ECN
(1999b), and elsewhere. For 1975 - 97 the learning rate has been roughly 20
percent: prices have been reduced by 20 percent for each doubling of the
cumulative sales. When the technology and market mature, as for gas turbines,
the learning rate may fall to 10 percent (IIASA and WEC, 1998). It is not clear,
however, whether this will apply to photovoltaics as well, since the range for
all industries is 10 - 30 percent and the value for the semiconductor industry
is roughly 30 percent (ECN, 1999a). Here it is assumed that the learning rate
stays at 20 percent - and that this rate applies to the total system price, not
just to the module price.
In 1998 cumulative sales were roughly 800 megawatts. Production
was about 150 megawatts. At growth of 15 percent a year (the average over the
past 15 years; IEA PVPS, 1998), annual sales will double every five years - to
about 3 gigawatts a year in 2020, when cumulative sales would be 25 gigawatts.
As a result prices will have fallen in 2020 to a third of the 1998 level. With
far more optimistic growth of 25 percent a year, annual sales would be 20
gigawatts a year in 2020, and cumulative sales 100 gigawatts. Prices will then
have fallen to a fifth of the 1998 level.
Table 7.13 gives an overview of the cost estimates using a
learning curve approach, for a learning rate of 20 percent (historic value).
Results for a low learning rate of 10 percent are given for comparison. The
projections using a learning curve approach show a somewhat slower decrease than
those based on evaluations of photovoltaic production technologies. Note,
however, that new technologies based on the use of thin-film solar cells can
follow a different (lower) learning curve than the sum of all technologies.
Photovoltaic electricity costs. Electricity costs are
determined by turnkey system costs, economic lifetime (depreciation period),
interest rates, operation and maintenance costs (including possible replacement
of components), electricity yields of the system (a function of insolation and
thus of geographic location), insurance costs, and so on (table
7.14).
Implementation issues
Since the cost of photovoltaic electricity is now well above
that of electricity from the grid, photovoltaics are implemented through two
distinct paths. One is market development of commercial high-value applications.
The second is stimulating the installation of grid-connected systems. Both paths
are generally supported through government and international aid programs.
The first path deals mainly with standalone photovoltaic systems
and (more recently but to less extent) with small grid-connected systems for
private use. The photovoltaics industry has survived the past decades by
actively developing niche markets in telecommunication, leisure, lighting,
signalling, water-pumping, and rural electrification. The rural market is now
being actively pursued as potentially huge, since an estimated 2 billion people
in developing countries do not have access to a grid (see chapter 10).
Photovoltaics are often a viable alternative for bringing small
amounts of electricity (less than 1 kilowatt-hour a day) to end users. More than
300,000 solar home systems (typically 50 watts) have been installed over the
past 10 years, only a very modest step towards true large-scale use (B�er,
1998). In addition a large number of even smaller systems has been sold. This
rural market cannot be judged by the total peak power of the systems (300,000 x
50 watts = 15 megawatts). Even if all 2 billion people were to own a 100 watt
photovoltaic system, this would contribute less than 1 exajoule of electricity
to the world’s energy consumption. Instead, it is the large number of
people involved that is significant - and even more that photovoltaics provide
light, radio, television, and other important services to them.
A major barrier for rapid growth and very widespread use is the
lack (in most countries) of properly developed financing schemes and the
infrastructure for distribution, after-sales service, and so on. Financing is
essential because few of those 2 billion people can pay cash of $400 for a
system. But some can pay a smaller amount, or even a monthly rate of a few
dollars up to tens of dollars. This widely acknowledged problem has two
solutions. The first is the full commercial development of very small
photovoltaic systems to meet basic needs and be paid for in cash (mainly
photovoltaic lanterns and other lighting systems in the range of 5 - 20 watts).
The second is financing schemes using a down payment and monthly fees of roughly
$5 - 20 a lease, or fee-for-service (B�er, 1998).
For grid-connected systems it is important to distinguish
between small and medium-sized decentralised systems (typically 500 watts to 1
megawatt) integrated in the built environment and large ground-based, central
systems (typically greater than 1 megawatt). Decentralised integrated systems
have some advantages over central ground-based ones. Their balance of system
costs are generally lower. And they have more technical and non-technical
possibilities to increase their competitiveness.
Photovoltaic market development through government programs in
industrialised countries (IEA PVPV, 1998) applies mainly to systems integrated
in the built environment. The aim of these programs is to boost the development
and application of photo-voltaic technology as an essential step towards future
large-scale use. They provide market volume to the photovoltaics industry to
achieve economies of scale and experience with a completely new way of
sustainable (decentralised) electricity generation. Clearly, this policy-driven
market depends on public support and high expectations for photovoltaics as a
major electricity source for the future.
TABLE 7.13. POSSIBLE EVOLUTION OF TYPICAL COSTS OF
GRID-CONNECTED PHOTOVOLTAIC SYSTEMS USING A LEARNING CURVE (APPROACH 2)
|
1998 |
Medium term (2010) |
Long term (2020) |
|
Average annual market growth rate (percent) |
15
(1983 - 98) |
15 |
25 |
15 |
25 |
|
Annual sales (gigawatts) |
0.15 |
0.8 |
2 |
3 |
20 |
|
Cumulative sales (gigawatts) |
0.8 |
6 |
11 |
25 |
100 |
|
Turnkey system price (1998 dollars per watt) at a learning
rate of 20 percent |
5 - 10 |
2.7 - 5.3 |
2.2 - 4.3 |
1.7 - 3.3 |
1 - 2 |
|
Turnkey system price (1998 dollars per watt) at a learning
rate of 10 percent |
5 - 10 |
3.7 - 7.4 |
3.4 - 6.8 |
3.0 - 5.9 |
2.4 - 4.8 |
TABLE 7.14 ELECTRICITY COST AS A FUNCTION OF COST, ECONOMIC
LIFETIME, AND ELECTRICITY YIELD OF PHOTOVOLTAIC SYSTEMS (DOLLARS A
KILOWATT-HOUR)
|
Turnkey system cost (dollars a watt) |
Economic lifetime (years) |
Electricity yield (kilowatt-hours a year per kilowatt of
installed capacity) |
|
|
750 |
1,500 |
|
5 |
10 |
1.00 - 1.22 |
0.51 - 0.61 |
|
(lower limit 1998) |
25 |
0.61 - 0.87 |
0.31 - 0.44 |
|
1 |
10 |
0.12 - 0.24 |
0.10 - 0.12 |
|
(long term) |
25 |
0.12 - 0.17 |
0.06 - 0.09 |
Note: Operation and maintenance and insurance costs
are 2 percent of the annual system cost. The interest rate is 5 - 10
percent.
|
BOX 7.6 SELECTED NATIONAL AND INTERNATIONAL PHOTOVOLTAIC
PROGRAMMES
Japan. In 1994 the Japanese government adopted the New
Energy Introduction Outline, with targets for renewable energy technologies,
including photovoltaics. The aim is to install 400 megawatts of (mainly
residential grid-connected) photovoltaic systems by 2000 and 4,600 megawatts by
2010 (Luchi, 1998). The program is based on gradually decreasing subsidies
(starting at 50 percent) and net metering.
United States. The Million Solar Roofs program aims to
install 1,000,000 solar hot water systems and photovoltaic systems by 2010 (IEA
PVPS, 1998; B�er, 1998). The trend is from demonstrations and tests towards
market-centred projects with funding primarily from the private sector. The
program works by creating partnerships between communities, federal agencies,
and the Department of Energy (Rannels, 1998).
Germany. The 100,000 Roofs program (300 - 350 megawatts
in 2005) is dedicated to grid-connected photovoltaic systems. Private
investments in photovoltaics are stimulated by interest-free loans and a subsidy
of 12.5 percent (Photon, 1999b). In addition, the government decided recently to
pay nearly 1 deutsche mark a kilowatt-hour to owners of photovoltaic systems,
financed by a small increase of electricity rates.
Italy. The 10,000 Rooftops program aims to install 50
megawatts by around 2005 (Garrozzo and Causi, 1998). With a focus on building
small- and medium-sized integrated, grid-connected photovoltaic systems, funding
may be mixed public (75 percent) and private (25 percent).
European Union. The target for photovoltaics is an
installed capacity of 3 gigawatts by 2010. This has been translated into a
Million Roofs program to install 500,000 grid-connected photovoltaic systems on
roofs and facades in the Union and to export another 500,000 village systems for
decentralised electrification in developing countries (EC, 1997; EC, 1999; IEA
PVPS, 1998).
Indonesia. In 1998 the installed capacity of photovoltaic
systems in Indonesia was 5 megawatts. A new strategy has been developed to
enhance the use of renewable energy technologies, especially photovoltaics. Some
characteristics of this strategy are: establish renewable energy
non-governmental organisations, prepare renewable energy product standards, run
demonstration projects in partnership with the private sector, provide training,
disseminate information, strengthen international cooperation, and institute
policy development and regulation.
India. With a total installed capacity of about 40
megawatts of photovoltaic systems, India has among the world’s largest
national programs in photovoltaics. The five-year national plan 1997 - 2002
envisages a deployment of 58 megawatts in addition to the 28 megawatts installed
as of 1997. Exports of 12 megawatts are also foreseen. Government-sponsored
programs include installing solar lanterns and other lighting systems - and
electrifying villages and grid-connected power plants. Subsidies are available
to rural users (Sastry, 1999).
South Africa. Shell Renewables Ltd. and Eskom are
investing $30 million in rural solar power development in South Africa from 1999
until 2001. This venture should provide standalone photovoltaic units to about
50,000 homes presently without electricity at a cost of about $8 a month (see
chapter 10).
Kenya. Kenya has a high penetration rate of household
photo-voltaic systems. In 1999 more than 80,000 systems were in place and annual
sales are about 20,000 systems. The market operates without significant external
aid or support (see chapter 10).
World Bank. The World Bank has become very active in
developing financial schemes and programs for rural electrification in
developing countries (Photon, 1999a). An example is the photo-voltaic Market
Transformation Initiative. The Bank’s activities, fully integrated on a
national level, mainly aim at removing barriers and building capacity.
Generally, the approach is not to stimulate photovoltaics through subsidies for
system hardware, but to facilitate commercial operations fitted to the local
circumstances. |
A variety of instruments can achieve a self-sustained market:
rate-based measures (favourable feed-in tariffs), fiscal measures, investment
subsidies, soft loans, building codes. Another instrument is the removal of
barriers related, say, to building design and material use. In addition to these
incentives, the added value of photovoltaics - like aesthetics in building
integration, combining electricity generation and light transmission, and
generating part or all of one’s own electricity consumption - are used in
marketing photovoltaics. Green electricity and green certificates for the use of
renewables are also expected to be important in the further development of a
self-sustained market for grid-connected systems. They enable selling
electricity from photovoltaics (or other renewables) to environmentally
conscious electricity consumers.
Several countries have set targets or formulated programs for
renewable energy technologies, specifically solar (box 7.6). In countries with a
well-developed electricity infrastructure, the long-term aim is to achieve a
substantial contribution to the electricity generation from solar energy. In
developing countries and countries with a less-developed electricity
infrastructure, efforts are focused on the large-scale implementation of smaller
standalone solar photovoltaic systems. In these cases the dissemination of solar
energy is a tool for social and economic
development.
Space-based solar energy
A very different approach to exploiting solar energy is to
capture it in space and convey it to the Earth by wireless transmission. Unlike
terrestrial capture of solar energy, a space-based system would not be limited
by the vagaries of the day-night cycle and adverse weather - and so could
provide baseload electricity (Glaser and others, 1997).
In space the maximum irradiance (power density) is much higher
than on Earth - around 1,360 watts per square metre - and is nearly constant.
This energy can be captured and converted to electricity just as it can on
Earth, as is done routinely to power spacecraft. The elements of such a
space-based solar energy system would include:
· Satellites in
geosynchronous or other orbits designed as large solar collectors.
· Power conditioning and
conversion components to turn the electricity generated by the photovoltaic
arrays into radio frequency form.
· Transmitting antennas that
form one or more beams directed from the satellites to the Earth.
· Receiving antennas on Earth
that collect the incoming radio frequency energy and convert it into useful
electricity. Such a device is called a rectenna (for rectifying receiving
antenna). The power yield from typical rectennas at low to middle latitudes
would be on the order of 30 megawatts per square kilometre.
· Power conditioning components
to convert the direct current output from the rectenna to alternating current
for local use.
As with any solar source, space-based energy would not
contribute to greenhouse gas emissions during operation. The high launch rate
required to place a space-based energy system could affect the Earth’s
atmosphere, however. The effects of power transmission to the ground need to be
assessed for at least three factors: influences on the atmosphere (particularly
the ionosphere on the way down), inference between the wireless power
transmission and communications or electronic equipment, and the effects of the
transmitted beam on life forms. Estimates and some experiments indicate that
these effects might be small.
Very preliminary estimates suggest that a cost target of $0.05
per kilowatt-hour may ultimately be achievable for a mature space-based solar
energy system (Mankins, 1998). But several important issues must be addressed:
· A number of key
technologies require maturation.
· The cost
of access to space must be substantially lowered.
· Safety and environmental concerns must be
resolved.
· Optimal designs for space-based
solar systems need to be established.
·
Orbital slots for collecting platforms and frequencies for power transmission
need to be
obtained.
Conclusion
· Since 1983 the
average growth rate of photovoltaic module shipments has been 15 percent a year.
In 1998 the production was 150 megawatts, and in 1999, about 200 megawatts. In
1998 the cumulative production was around 800 megawatts, with the operating
capacity probably about 500 megawatts, perhaps 600 megawatts. The growth of
operating photovoltaic capacity in the last five years can be estimated at
roughly 30 percent a year.
· Since 1975 the learning rate
(cost reduction as function of cumulative production) has been roughly 20
percent. In 1998 turnkey costs of grid-connected photovoltaic systems were $5 -
10 a watt. In the future these costs may come down to about $1 a watt.
· Today photovoltaics generally
cannot compete with conventional power plants in grid-connected applications.
Photovoltaic electricity production costs are about $0.3 - 1.5 a kilowatt-hour,
depending on solar insolation, turnkey costs, depreciation periods, and interest
rates. Under favourable conditions and at favourable sites, the lowest cost
figure may come down to $0.05-0.06 a kilowatt-hour.
· It remains uncertain whether
and when photovoltaics will compete with fossil fuels on a large scale. This
mainly depends on the development of photovoltaics, on the price development of
coal and natural gas, and on possibilities for (or policies on) carbon dioxide
removal at low cost.
· Supplying less than 1 percent
of the world’s energy consumption, photovoltaic systems can play a major
role in rural electrification by reaching many of the 2 billion people in
developing countries who do not have access to electricity.
· There appear to be no
invincible technical problems for solar energy to contribute much to the
world’s energy supply. What matters are policy developments and the market
position of fossil fuels and other energy sources.
|
Photovoltaics are often
a viable alternative for
bringing
small amounts of electricity (less
than 1 kilowatt-hour a
day)
to end users. |
Solar thermal electricity
Solar radiation can produce high-temperature heat, which can
generate electricity. The most important solar thermal technologies to produce
electricity - concentrating - use direct irradiation. Low cloud areas with
little scattered radiation, such as deserts, are considered most suitable for
direct-beam-only collectors. Thus the primary market for concentrating solar
thermal electric technologies is in sunnier regions, particularly in warm
temperate, sub-tropical, or desert areas. About 1 percent of the world’s
desert area used by solar thermal power plants would be sufficient to generate
today’s world electricity demand. Here we will assess the current status
and future development of solar thermal electricity (STE)
technologies.
The potential of solar thermal electricity
STE is probably 20 years behind wind power in market
exploitation. In 1998 operating STE capacity was about 400 megawatts of
electricity, with annual electricity output of nearly 1 terawatt-hour. New
projects in mind mount to a maximum of 500 megawatts of electricity, and it is
probable that 2,000 megawatts of installed capacity will not be reached until
2010 (the capacity wind reached in 1990). Because STE costs are dropping rapidly
towards levels similar to those obtained by wind, STE may grow in a manner
somewhat similar to wind. If the growth rate is 20 - 25 percent after 2010, this
installed STE capacity would be 12,000 - 18,000 megawatts of electricity by
2020. If annual growth rate then averages 15 percent a year, the result would be
800 - 1,200 gigawatts of electricity by 2050. The Cost Reduction Study for Solar
Thermal Power Plants, prepared for the World Bank in early 1999 (Enermodal,
1999), concludes that the large potential market of STE could reach an annual
installation rate of 2,000 megawatts of electricity. In the foregoing scenario
this rate is reached between 2015 and 2020. Advanced low-cost STE systems are
likely to offer energy output at an annual capacity factor of 0.22 or more. So,
the contribution of STE would be about 24 - 36 terawatt-hours of electricity by
2020 and 1,600 - 2,400 terawatt-hours by
2050.
Solar thermal electricity market developments
STE technologies can meet the requirements of two major electric
power markets: large-scale dispatchable markets comprising grid-connected
peaking and baseload power, and rapidly expanding distributed markets including
both on-grid and remote applications.
Dispatchable power markets. Using storage and
hybridisation capabilities (integration of STE with fossil fuel power plants),
dispatchable solar thermal electric technologies can address this market.
Currently offering the lowest-cost, highest-value solar electricity available,
they have the potential to be economically competitive with fossil energy in the
longer term. With continuing development success and early implementation
opportunities, the electricity production cost of dispatchable STE systems is
expected to drop from $0.12 - 0.18 a kilowatt-hour today to about $0.08 - 0.14 a
kilowatt-hour in 2005 and to $0.04 - 0.10 a kilowatt-hour thereafter.
In this market there is a huge existing global capacity of
fossil fuel plant, much of it coal, available for low solar-fraction retrofit as
a transition strategy. Coal-fired plants tend to be much larger individually
than solar thermal standalone plants (600 - 1,200 megawatts of electricity
compared with 5 - 80 megawatts), and usable land around coal-fired plants is
restricted. Any solar retrofit to a typical coal-fired plant will supply only a
small percentage of its total electricity output. But around the world, there
are hundreds of such fossil fuel plants in good insolation areas, many with
sufficient adjacent land area to accommodate a solar field of the size of the
current largest STE units of about 80 megawatts. This market could account for a
large fraction of the 12,000 - 18,000 megawatts by 2020 in the scenario above.
Distributed power markets. The majority of these
applications are for remote power, such as water pumping and village
electrification, with no utility grid. In these applications, diesel engine
generators are the primary current competition. The STE technology appropriate
for smaller distributed applications is the dish/engine system. Each dish/engine
module (10 - 50 kilowatts of electricity) is an independent power system
designed for automatic start-up and unattended operation. Multiple dish/engine
systems can be installed at a single site to provide as much power as required,
and the system can readily be expanded with additional modules to accommodate
future load growth. The systems can be designed for solar-only applications,
easily hybridised with fossil fuels to allow power production without sunlight,
or deployed with battery systems to store energy for later use.
|
BOX 7.7. COMMERCIAL SOLAR THERMAL ELECTRICITY DEVELOPMENTS
NOW UNDER WAY
Australia. Under the Australian Greenhouse Office (AGO)
Renewable Energy Showcase Programme, a 13 megawatt-thermal compact linear
fresnel reflector (CLFR) demonstration unit will be installed in 2001,
retrofitted to an existing 1,400 megawatts-electric coal-fired plant in
Queensland (Burbridge and others, 2000). It is expected to offer the solar
electricity from this first commercial project as green power at a price below
$0.09 a kilowatt-hour. A 2 megawatts-electric demonstration unit, using
paraboloidal dish technology, has also been announced for installation in 2001,
retrofitted to a gas-fired steam generating plant (Luzzi, 2000).
Greece. On the island of Crete, the private venture
capital fund Solar Millennium - together with Greek and European industrial
partners - has established the first solar thermal project company (THESEUS
S.A.) and submitted an application for licensing a 52 megawatt-thermal solar
thermal power plant with 300,000 square metres of parabolic trough solar field.
Spain. New incentive premiums for the generation of
renewable electricity in 1999 caused Spanish companies such as Abengoa, Gamesa,
and Ghersa to engage in solar thermal technologies and to establish various
project companies (Osuna and others, 2000).
United States. Green electricity and renewable portfolio
policies of various states have revived the interest of such industrial firms as
Bechtel, Boeing, and Dukesolar in the further development of STE technologies.
Global Environment Facility. In 1999 the Global
Environmental Facility approved grants for the first solar thermal projects in
Egypt, India, Mexico, and Morocco - about $200 million in total. The proposed
Indian plant uses integrated gas combined cycle and solar thermal (Garg, 2000).
|
The high value of distributed power (more than $0.50 a
kilowatt-hour for some remote applications) provides opportunities for
commercial deployment early in the technology development. The technology
enhancements needed to achieve high reliability and reduce operation and
maintenance costs are understood. With continuing development, the electricity
production costs of distributed STE system are expected to drop from $0.20 -
0.40 a kilowatt-hour today to about $0.12 - 0.20 a kilowatt-hour in 2005 and to
$0.05 - 0.10 a kilowatt-hour in the long run.
STE projects, ranging from about 10 kilowatts to 80 megawatts of
electricity, have been realised or are being developed in Australia, Egypt,
Greece, India, Iran, Jordan, Mexico, Morocco, Spain, and the United States (box
7.7).
Market entry strategy. Three phases can be distinguished
in an STE market entry strategy:
· Solar field
additions. Small solar fields can be integrated into combined cycle and coal
or fuel oil-fired power plants for $700 - 1,500 per kilowatt installed.
· Increased solar share.
With increasing fossil fuel prices or compensation premiums for carbon
dioxide avoidance as well as solar field cost reductions, the share of solar can
be increased to about 50 percent in solar-fossil hybrid power stations.
· Thermal energy storage.
With further improvement in the cost-benefit ratio of STE, thermal energy
storage will further substitute for the need of a fossil back-up fuel source. In
the long run, baseload operated solar thermal power plants without any fossil
fuel addition are in principle possible, and clean bio-energy back-up is also
feasible.
Figure 7.6 presents an outlook on the market introduction of STE
technologies and the associated reduction in electricity generation costs as
presented by SunLab
(1999).
Solar thermal electricity technologies
Five distinct solar thermal electric conversion concepts are
available, each with different operating and commercial features. Two
non-concentrating technologies - solar chimney and solar pond - are not included
in this brief description of emerging solar thermal power concepts, because they
lack significantly sized pilot and demonstration test facilities.
All concentrating solar power technologies rely on four basic
key elements: collector/concentrator, receiver, transport/storage, and power
conversion. The collector/concentrator captures and concentrates solar
radiation, which is then delivered to the receiver. The receiver absorbs the
concentrated sunlight, transferring its heat energy to a working fluid. The
transport/storage system passes the fluid from the receiver to the power
conversion system. In some solar thermal plants a portion of the thermal energy
is stored for later use. As solar thermal power conversion systems, Rankine,
Brayton, Combined, and Stirling cycles have been successfully demonstrated.

FIGURE 7.6 MARKET INTRODUCTION OF
SOLAR THERMAL ELECTRICITY TECHNOLOGIES WITH INITIAL SUBSIDIES AND GREEN POWER
TARIFFS, 1990 - 2020
Source: SunLab, 1999.
An inherent advantage of STE technologies is their unique
ability to be integrated with conventional thermal plants. All of them can be
integrated as a solar boiler into conventional thermal cycles, in parallel with
a fossil-fuelled boiler. They can thus be provided with thermal storage or
fossil fuel back-up firm capacity without the need for separate back-up power
plants and without stochastic perturbations of the grid (figure 7.7). The
potential availability of storage and ability to share generation facilities
with clean biomass suggest a future ability to provide a 100 percent replacement
for high capacity factor fossil fuel plant when needed.
Parabolic trough systems. The parabolic trough (solar
farm) consists of long parallel rows of identical concentrator modules,
typically using trough-shaped glass mirrors. Tracking the sun from east to west
by rotation on one axis, the trough collector concentrates the direct solar
radiation onto an absorber pipe located along its focal line. A heat transfer
medium, typically oil at temperatures up to 400 degrees Celsius, is circulated
through the pipes. The hot oil converts water to steam, driving the steam
turbine generator of a conventional power block.
With 354 megawatts-electric of parabolic trough solar electric
generating systems connected to the grid in southern California since the
mid-1980s, parabolic troughs are the most mature STE technology (Pilkington,
1996). There are more than 100 plant-years of experience from the nine operating
plants. The plants range in size from 14 - 80 megawatts of electricity. Until
the end of 1998, 8 terawatt-hours of solar electrical energy had been fed into
the Californian grid, resulting in sales revenues of more than $1,000 million.
The technology is under active development and refinement to improve its
performance and reduce production costs.
Central receiver/power tower. The solar central receiver
or power tower is surrounded by a large array of two-axis tracking mirrors -
termed heliostats - reflecting direct solar radiation onto a fixed receiver
located on the top of the tower. Within the receiver, a fluid transfers the
absorbed solar heat to the power block where it is used to heat a steam
generator. Water, air, liquid metal, and molten salt have been tested as fluids.
Advanced high-temperature power tower concepts are now under
investigation, heating pressurised air to more than 1,000 degrees Celsius to
feed it into the gas turbines of modern combined cycles. In Barstow, California,
a 10 megawatts-electric pilot plant (Solar One) operated with steam from 1982 -
88. After modification of the complete plant in 1996, it operated as Solar Two
for a few thousand hours, with molten salt as the heat-transfer and
energy-storage medium, delivering power to the electricity grid on a regular
basis (Pacheco and others, 2000). The net solar-electric conversion efficiency
was 8 percent. Solar Two has demonstrated, through storage, the feasibility of
delivering utility-scale solar power to the grid 24 hours a day, if necessary
(Kolb, 1998). In parallel, European activities have demonstrated the volumetric
air receiver concept, where the solar energy is absorbed on fine-mesh screens
and immediately transferred to air as the working fluid (Buck and others, 2000).

FIGURE 7.7. WITH MINIMAL FOSSIL
BACK-UP AND THERMAL ENERGY STORAGE, SOLAR CAPACITY IS TRANSFORMED INTO FIRM
CAPACITY
Source: Geyer, 1999.
Dish/engine power plants. Parabolic dish systems consist
of a parabolic-shaped point focus concentrator in the form of a dish that
reflects solar radiation onto a receiver mounted at the focal point. These
concentrators are mounted on a structure with a two-axis tracking system to
follow the sun. The collected heat is often used directly by a heat engine,
mounted on the receiver. Stirling and Brayton cycle engines are currently
favoured for decentralised power conversion. Central Rankine cycles are being
studied for large fields of such dishes where the receiver does not contain a
heat engine.
Several dish/engine prototypes have operated successfully in the
last 10 years, including 7 - 25 kilowatts-electric units developed in the United
States. But there has not yet been a large-scale deployment. In Spain six units
with a 9 - 10 kilowatts-electric rating are operating successfully. Australia
has demonstrated a 400 square metre, 10 kilowatts-electric ‘big dish’
at the Australian National University in Canberra (Luzzi, 2000). Work is
proceeding to develop a dish plant of 2 - 3 megawatts- electric attached to an
existing fossil fuel power plant.
Advanced systems under development. Compact linear
fresnel reflector (CLFR) technology has recently been developed at the
University of Sydney in Australia. Individual reflectors have the option of
directing reflected solar radiation to at least two towers. This additional
variable in reflector orientation provides the means for much more densely
packed arrays. The CLFR concept, intended to reduce costs in all elements of the
solar thermal array, includes many additional features that enhance system cost
and performance. The technology aims only at temperatures suitable for steam
boilers and pre-heaters, with the view that superheating is a minor input and
can be done by other fuels.
Fuels. Long-term research is under way in Australia,
Germany, Israel, Switzerland, and elsewhere to produce solar fuels for a range
of uses, including fuel cells for electricity production. This work is targeted
towards the thermochemical conversion of solar energy into chemical energy
carriers (hydrogen, synthesis gas,
metals).
Economic aspects
The Cost Reduction Study for Solar Thermal Power Plants
(Enermodal, 1999) has assessed the current and future cost competitiveness of
STE with conventional power systems for two STE technologies: the parabolic
trough and the molten salt central receiver system. Two approaches were used to
assess the future cost performance of these technologies: an engineering
approach based on known technical improvements and cost reductions from
commercialisation, and a learning (experience) curve approach. The two
approaches yielded similar results.
Costs per kilowatt of trough plants are expected to fall from
$3,000 - 3,500 a kilowatt in the near term (for a 30 megawatts-electric plant)
to $2,000 - 2,500 a kilowatt in the long term (for a 200 megawatts-electric
plant). For central receiver systems these figures are $4,200 - 5,000 a kilowatt
in the near term and $1,600 - 1,900 a kilowatt in the long term. The attainable
net solar-to-electric conversion efficiencies of these systems are expected to
be 13 - 16 percent in the near term and 18 - 20 percent in the long term.
Operation and maintenance costs can decrease from about $0.025 a kilowatt-hour
in the near term to about $0.005 a kilowatt-hour in the long term.
If the cost of electricity from conventional power plants stays
constant over the next 20 years, the solar levelised energy cost (LEC) can be
calculated to fall to less than half of current values - from $0.14 - 0.18 a
kilowatt-hour to $0.04 - 0.06 a kilowatt-hour. At this cost, the potential for
STE power plants to compete with Rankine cycle plants (coal, gas, or oil fired)
can be promising. The solar LEC for the tower is calculated to be less than for
the trough because of the use of thermal storage. If troughs were equipped with
storage as well, the same advantage would probably be found. It can thus be
concluded that 24-hour power does not increase the total generating costs. If a
credit of $25 - 40 a tonne were included for reduced carbon dioxide emissions,
STE power may have an even lower LEC than coal-fired Rankine
plants.
Environmental and social aspects
Carbon dioxide emission savings. A solar boiler can
supply 2,000 to 2,500 full load hours per year to a steam cycle. With STE
technologies, each square meter of solar field can produce up to 1,200 kilowatt-
hours of thermal energy a year - or up to 500 kilowatt-hours of electricity a
year. Taking into account a thermal plant carbon dioxide emissions of 0.4 - 0.8
kilograms a kilowatt-hour electric, there results a cumulative saving of up to 5
- 10 tonnes of carbon dioxide per square metre of STE system over its 25-year
lifetime (Pilkington, 1996).
Impact on fossil fuels consumption. The embodied energy
of a STE plant is recovered after less than 1.5 years of plant operation
(Lenzen, 1999). STE systems can preserve fossil energy or biomass resources.
Taking into account an average conventional thermal power plant efficiency of 40
percent, there results a cumulative saving of about 2.5 tonnes of coal per
square metre of solar field over its 25-year lifetime.
Land use. Land use is sometimes cited as a concern with
renewables. If renewables are to contribute to energy production on a global
scale, sufficient areas have to be available in suitable locations. Most solar
thermal power plants need about 1 square kilometre of area for 60 megawatts of
electricity capacity, although STE technologies like CLFR (see above) might
reduce this by a factor or 3 or so (Mills and Morrison, 2000a, b).
Domestic supply of equipment and materials. The higher
up-front cost of solar thermal power stations results from the additional
investment into the STE equipment and erection. Most of this equipment and most
of the construction materials required can be produced domestically. The
evaluation of the domestic supply capability of selected countries indicates
national supply shares ranging from 40 percent to more than 50 percent of the
total project value. This supply share can be increased for subsequent projects
(Pilkington, 1996).
Labour requirements. The erection and operation of the
nine STE power plants in California indicate current labour requirements. The
last 80 megawatts-electric plants showed that during the two-year construction
period, there is a peak of about 1,000 jobs. Operation of the plant requires
about 50 permanent qualified jobs (Pilkington,
1996).
Conclusion
· In the sunbelt of
the world, solar thermal power is one of the candidates to provide a significant
share of renewable clean energy needed in the future.
· STE is now ready for more
widespread application if we start more intensified market penetration
immediately; its application is not strongly restricted by land area or resource
limitations.
· The STE technology appropriate
for smaller remote power production is the dish/engine power plant. For
grid-connected applications, technologies such as the parabolic trough system
and the central receiver/power tower are applied.
· The installed STE capacity,
now about 400 megawatts of electricity, may grow to 2,000 megawatts of
electricity in 2010 - and to 12,000 - 18,000 megawatts of electricity in 2020.
An annual growth rate of 15 percent after 2020 would yield 1,600 - 2,400
terawatt-hours a year by 2050.
· Small solar fields can be
integrated into fossil fuel power plants at relatively low costs. With
improvement of the cost-benefit ratio of STE, the solar share in hybrid
solar/fossil power plants may increase to about 50 percent. Thermal energy
storage will be able to further substitute for the need for a fossil back-up
fuel. In the long run, baseload-operated solar thermal power plants without any
fossil fuel addition are now technically proven.
· STE is the lowest-cost solar
electricity in the world, promising cost competitiveness with fossil fuel plants
in the future - especially if assisted by environmental credits. Electricity
production costs of grid-connected STE systems may come down from $0.12 - 0.18 a
kilowatt-hour today to $0.04 - 0.10 a kilowatt-hour in the long term. In remote
areas, the production costs of distributed systems may come down from $0.20 -
0.40 a kilowatt-hour today to $0.05 - 0.10 a kilowatt-hour in the long
term.
|
The easiest and most direct
application of solar energy is
the
direct conversion of sunlight
into low-temperature heat. |
Low-temperature solar energy
The easiest and most direct application of solar energy is the
direct conversion of sunlight into low-temperature heat - up to a temperature of
100 degrees Celsius. In general, two classes of technologies can be
distinguished: passive and active solar energy conversion. With active
conversion there is always a solar collector, and the heat is transported to the
process by a medium. With passive conversion the conversion takes place in the
process, so no active components are used.
In this section the main focus is on active conversion, for
which a broad range of technologies is available. The best known is the solar
domestic hot water system. Another technology in the building sector is the
solar space heating system. Such a system can be sized for single houses or for
collective buildings and district heating. Similar technologies can be applied
in the industrial and agricultural sector for low-temperature heating and drying
applications. Heating using solar energy can also be achieved by heat pumps.
Finally, there are technologies to use solar energy for cooling and cooking
purposes.
Low-temperature solar energy potential and market developments
The world’s commercial low-temperature heat consumption can
be estimated at about 50 exajoules a year for space heating and at about 10
exajoules a year for hot water production. Low- and medium-temperature heat (up
to 200 degrees Celsius) is also used as process heat, in total about 40
exajoules a year. Almost any low-and medium-temperature heat demand can be met
at least partially with solar energy. One of the drawbacks for this application
is the mismatch between availability of sunlight and demand for heating.
Therefore nearly any solar heating system contains a storage unit.
The solar domestic hot water system (SDHW) is the most important
application for low-temperature solar heat at this moment. In 1994 some 7
million SDHWs had been installed world-wide. In 1994 the total installed
collector area of SDHWs and other solar energy systems was about 22 million
square metres (Morrison, 1999) and in 1998 about 30 million square metres. This
can be expressed as an installed capacity of around 18,000 megawatts. The total
amount of heat generated by these solar energy systems can be estimated roughly
at 50 petajoules a year. This is only 0.5 percent of the potential of around 10
exajoules a year. Table 7.15 provides an overview of the annually produced and
total installed glazed collector area.
In Europe the market rapidly expanded after 1994. In 1996 about
700,000 square metres were produced, mainly in Germany (330,000 square metres)
and Austria (230,000 square metres). The European Solar Industry Federation
expects annual growth of around 20 percent (ESIF, 1996). In 1998 sales in Europe
were probably on the order of 1 million square metres. In the United States the
market has declined - the amount of collector area sold in SDHW systems
decreased from 1.1 million square metres in 1984 to around 80,000 square metres
in 1998 (Morrison, 1999). The market collapsed in 1986 because the federal
R&D funding and tax credits ended abruptly. In China production is
increasing rapidly. In Japan the market is increasing after a collapse in 1987
(ESIF, 1996). For different regions, growth of 10 - 25 percent a year is
foreseen. In 2010 the installed collector area could be 150 million square
metres.
TABLE 7.15. MAJOR SOLAR COLLECTOR MARKETS, 1994 (THOUSANDS
OF SQUARE METRES)
|
Economy |
Total glazed collector area installed |
Glazed collector area produced |
|
Australia |
1,400 |
140 |
|
China |
1,500 |
500 |
|
India |
500 |
50 |
|
Israel |
2,800 |
300 |
|
Japan |
7,000 |
500 |
|
Taiwan, China |
200 |
90 |
|
United States |
4,000 |
70 |
|
Europe |
4,700 |
500 |
|
Austria |
400 |
125 |
|
Cyprus |
600 |
30 |
|
France |
260 |
18 |
|
Germany |
690 |
140 |
|
Greece |
2,000 |
120 |
|
Portugal |
200 |
13 |
|
World |
~ 22,000 |
~ 2,200 |
Source: Based on Morrison, 1999.
TABLE 7.16. CHARACTERISTICS OF SOLAR DOMESTIC HOT WATER
SYSTEMS IN EUROPE
|
Feature |
Northern Europe |
Central Europe |
Mediterranean |
|
Collector area (square metres) |
3 - 6 |
3 - 5 |
2 - 4 |
|
Storage capacity (litres) |
100 - 300 |
200 - 300 |
100 - 200 |
|
Annual system performance(kilowatt-hours per square metre) |
300 - 450 |
400 - 550 |
500 - 650 |
|
Installed system costs(dollars per square metre) |
400 - 1,000 |
400 - 1,000 |
300 - 600a |
|
Common system type |
Pump/ circulation |
Pump/ circulation |
Thermosyphon |
a. In countries like Israel and Turkey this figure
can be even lower.
Another important technology is the electric heat pump. Driven
by electricity, this pump can withdraw heat from a heat source and raise the
temperature to deliver the heat to a process (such as space heating). Tens of
millions of appliances have been installed that can be operated as heat pumps,
while most of them can also be operated as cooling devices (air conditioners).
Whether the application of these machines results in net fuel savings depends on
the local situation, taking into account aspects such as the performance of the
heat pump, the reference situation, and characteristics of the electricity
source. A lack of data makes it impossible to determine the net contribution of
heat pumps to the energy
supply.
Low-temperature solar energy technologies and systems
Solar domestic hot water systems. The solar domestic hot
water system (SDHW) consists of three components: a solar collector panel, a
storage tank, and a circulation system to transfer the heat from the panel to
the store. SDHW systems for household range in size, because of differences in
hot water demands and climate conditions. In general price/performance analysis
will be made to size the solar hot water system and to investigate the optimum
solar fraction (contribution of solar energy in energy demand). The results show
a general dependence on the climate. The SDHW systems in Northern and Central
Europe are designed to operate on a solar fraction of 50 - 65 percent.
Subtropical climates generally achieve solar fractions of 80 - 100 percent.
Table 7.16 indicates typical characteristics of applied systems in various
climate zones in Europe.
Pump/circulation systems are generally used in climate zones
with a serious frost and overheating danger. These systems either use the
drain-back principle (the fluid drains from the collector if there is no solar
contribution) or an antifreeze additive in the collector fluid. In countries
with a warmer climate, natural circulation systems are mostly used. Almost all
collectors installed are of the flat plate type. But in China in 1997 about 2
million evacuated tube collectors (about 150,000 square metres of collector
area) were produced (Morrison, 1999). These are double-walled concentric glass
tubes, of which the enclosed space is evacuated. In regions with high solar
irradiation, the use of SDHW systems may result in solar heat production costs
ranging from $0.03 - 0.12 a kilowatt-hour.
In regions with relatively low solar irradiation, the costs may
range from $0.08 - 0.25 a kilowatt-hour. In many areas these costs can be
competitive with electricity prices - but in most cases not with fossil fuel
prices. Further cost reductions are therefore required.
· One approach is
the use of complete prefabricated systems or kits, leaving no possibility to
make changes in the system design, thus simplifying the installation work and
reducing both the hardware and the installation cost.
· Another approach, in Northern
Europe, is the development of solar thermal energy markets on a large scale, to
reduce production, installation, and overhead costs. As demonstrated in the
Netherlands, large projects can reduce the installed system price by 30 - 40
percent relative to the price of individually marketed systems.
· Cost reductions can also be
achieved by further development of the technology (including integration of
collector and storage unit). As a result of these approaches, solar heat
production costs may come down 40 - 50 percent (TNO, 1992).
SDHW systems are commonly produced from metals (aluminium,
copper, steel), glass and insulation materials. In most designs the systems can
easily be separated into the constituent materials; all metals and glass can be
recycled. The energy payback time of a SDHW system is now generally less than
one year (van der Leun, 1994).
Large water heating systems. Solar thermal systems can
provide heat and hot water for direct use or as pre-heated water to boilers that
generate steam. Such large water heating systems find widespread use in swimming
pools, hotels, hospitals, and homes for the elderly. Other markets are
fertiliser and chemical factories, textile mills, dairies, and food processing
units. Substantial quantities of fossil fuels or electricity can be saved
through their use. But the installed collector area is rather low - around a
tenth of the total installed area. It is especially low in the industrial
sector, mainly because of low fossil fuel costs and relatively high economic
payback times of solar systems. India provides tax benefits through accelerated
depreciation on such commercial systems and also has a programme to provide soft
loans to finance their installation. Within these systems about 400,000 square
metres of collector area has been installed in India (TERI, 1996/97). The costs
per kilowatt-hour of large water heating systems are now somewhat less than SDHW
energy costs. And in the long term these costs can be reduced, probably about 25
percent, mainly by mass production.
Solar space heating. Total world space heating demand is
estimated at 50 exajoules a year. In northern climates this demand can be more
than 20 percent of total energy use. Mismatch between supply and demand limits
the direct contribution of solar thermal energy to the space heating of a
building to a maximum of 20 percent in these regions. If seasonal storage of
heat is applied, solar fractions of up to 100 percent are achievable (Fisch,
1998). Space heating systems are available as water systems and as air heating
systems, with air heating systems generally cheaper. Water-based systems are
usually solar combi-systems that supply domestic hot water and space heating.
Seasonal storage has mainly been applied in demonstration
projects, showing its technological feasibility. The technologies are divided
into large and small systems. For large systems (storage for more than 250
houses) the insulation is not so important, and duct storage or aquifer storage
is possible. For small systems storage of heat in an insulated tank is the only
solution to date. More advanced concepts - such as chemical storage of heat -
have been proven on a laboratory scale. Storage of cold from the winter to be
used in the summer has proven to be profitable, if aquifers are available in the
underground.
|
Passive solar energy use has become
an attractive optionfor
heating and
cooling buildings because of
the development of
new
materials and powerful
simulation tools |
District heating. Solar energy can also be applied for
district heating. Providing hot water and space heat, several of these systems,
using a central collector area, have been realised in Denmark, Germany, and
Sweden. They reach similar solar fractions as single house systems: 50 percent
for hot water production and 15 percent for the total heat demand (hot water
plus space heating). Some of these systems have been combined with a seasonal
storage increasing the solar fraction to 80 percent for the total heat demand.
Heat pumps. Heat pumps can generate high-temperature heat
from a low-temperature heat source. Working in the opposite direction the same
appliance can also be used as a cooling device. In fact most heat pumps are air
conditioners that are also suitable for heating purposes. Tens of millions of
these appliances have been installed world-wide. In colder climates there is a
market for heat pumps for heating only. In Europe in 1996 around 900,000 of
these pumps were installed (Laue, 1999), and the market is growing at about 10
percent a year (Bouma, 1999).
Energy (mostly electricity) is needed to operate the heat pump.
Typically the heat energy output is two to four times the electrical energy
input. The low-temperature heat input can come directly or indirectly from the
sun. For example, with ground-coupled heat pump systems, the surface can be seen
as a cheap solar collector - and the ground beneath it as a storage system from
which the low-temperature heat can be extracted. Today, however, most systems
extract heat from the open air. Different systems have been tested using solar
collectors as a heat source. Because heat pumps can work with low temperatures,
the collectors can be cheap.
No general statement can be made about the contribution of heat
pumps to savings in fossil fuel consumption and environmental emissions. But by
further improving the performance of the heat pump and by using electricity from
renewable sources (hydro, wind, photovoltaics), this contribution will be
definitely positive.
Solar cooling. About 30 million air conditioners are sold
each year (Nishimura, 1999). Cooling with solar heat seems an obvious
application, because demand for cooling and supply of solar heat are in phase.
The technologies available are absorption cooling, adsorption cooling, and
desiccant cooling. A standard, single-effect absorption chiller can be driven
with temperatures around 90 degrees Celsius. This can be generated with standard
flat plate solar collectors. Different systems have been designed and tested,
but their economics turned out to be poor. As a result this field of
applications has been disregarded over the last 10 years. Recently some newer
cooling cycles have become available, the solar collector performance has
improved, and collector prices have gone down. So solar cooling may become a
feasible option (Henning, 1999).
Solar cooking. About half the world’s cooking uses
firewood as the fuel, with the other half based on gas, kerosene, or
electricity. In some regions cooking energy requirements place a great pressure
on biomass resources while also causing considerable inconvenience and health
effects to users in the collection and burning of biomass (see chapter 3).
Considering that these regions also have significant levels of solar radiation,
it would appear that cooking provides a significant and beneficial impact.
China and India are among several countries promoting the use of
solar cookers. A simple box-type cooker and a parabolic concentrating type
cooker are among the common models deployed. Efforts have also been made to
develop solar cookers for institutional use. In India some 450,000 box type
cookers have been installed. The world’s largest solar cooking system -
capable of preparing meals for 10,000 persons twice a day - was installed in
1999 in Taleti in Rajasthan, India (TERI, 1996/97; MNCES, 1999). In China some
100,000 concentrator-type cookers have been deployed (Wentzel, 1995).
Solar cooking devices have certain limitations and can only
supplement, not replace conventional fuels. A home that uses a solar cooker
regularly can save a third to a half of the conventional fuel that is used for
cooking. The economic payback time is usually between 2 - 4 years. The
large-scale use of solar cookers, however, will also require some adjustment by
users.
Solar crop drying. The drying of agricultural products
requires large quantities of low-temperature heat - in many cases, year round.
Low-cost air-based solar collectors can provide this heat at collection
efficiencies of 30 - 70 percent (Voskens and Carpenter, 1999). In Finland,
Norway, and Switzerland hay drying is already an established technology. By 1998
more than 100,000 square metres of air collectors for drying purposes had been
installed.
In developing countries 60 - 70 percent of grain production (as
estimated by the Food and Agriculture Organisation) is retained at the farmer
level, and crop drying is effected predominantly by exposure to direct sunlight
(sun drying). In industrialised countries crops are typically dried in large
fossil-fuelled drying systems, operating at relatively high temperatures with a
high throughput of material. If a solar dryer is used in place of sun drying,
there will not be any energy savings, but the solar dryer will achieve higher
throughput of material, better quality of material, and lower loss of material
(to pests or theft). Air-collector-type solar dryers have the most potential in
replacing fuel-fired dryers for crops dried at temperatures less than 50 degrees
Celsius (table 7.17).
TABLE 7.17. WORLD PRACTICAL POTENTIAL ESTIMATION FOR SOLAR
CROP DRYING (PETAJOULES A YEAR)
|
Type of drying |
Low |
High |
|
< 50 degrees Celsius |
220 |
770 |
|
> 50 degrees Celsius |
40 |
110 |
|
Sun dried |
420 |
650 |
|
Total |
680 |
1,530 |
Source: ESIF, 1996; Voskens and Carpenter,
1999.
The technology for solar crop drying is available, and its
application can be economically viable. Market introduction of these
technologies will thus be the next step, but that will require training and
demonstration projects targeted at specific crops and specific potential users
and regions.
Passive solar energy use. The application of passive
solar principles can contribute significantly to the reduction of (active)
energy demands for heating, cooling, lighting, and ventilating buildings. Some
of these principles (Boyle, 1996) are:
· Be well
insulated.
· Have a responsive, efficient
heating system.
· Face south.
· Avoid overshading by other buildings.
· Be thermally massive.
The principles have to be considered in relation to the building
design process, because they have a direct effect on the architectural
appearance of the building, on the level of comfort (heat, cold, light,
ventilation), and on people’s experience of the building. Nowadays a number
of techniques can diminish energy demands with passive means:
· Low-emission
double-glazed windows. In cold climates these windows keep out the cold
while allowing the solar radiation to pass. In summer the windows can be shaded,
and heat is kept outside.
· Low-cost opaque insulation
material and high insulating building elements. These elements can keep out
the heat as well as the cold.
· Transparent insulation
material. This material can be used to allow day-lighting while keeping out
the cold or heat.
· High-efficiency ventilation
heat recovery.
· High-efficiency lighting
systems and electrical appliances with automatic control. These can bring
down the internal heat gain, reducing the cooling load. Advanced daylight
systems can lead to 40 percent reduction of the energy use for lighting
purposes.
By carrying out detailed simulation studies, the energy demand
of a building can be optimised, without affecting comfort (Hastings, 1994). It
has been estimated that 13 percent of the heat demand of buildings is covered by
passive solar energy use. For optimised buildings this fraction can go up to 30
percent without major investments (Brouwer and Bosselaar, 1999). Because of the
development of better materials and powerful simulation models, passive use of
solar energy is becoming the number one consideration for heating and cooling
buildings.
Implementation issues
In many countries incentive programmes help to stimulate the
further development and application of low-temperature solar energy systems,
improving their performance and reducing economic and other barriers. In
countries where government stimulation is lacking, it is often the economic
attractiveness of the system or environmental conscience that motivates people
to install these systems.
In many cases energy companies, especially utilities, have
stimulated the use of solar thermal energy. Motivated by environmental action
programs, demand-side management programs, or a desire to diversify and serve
new markets, these companies have taken over a significant part of the effort to
get the solar water systems to the market. They support these projects by active
marketing, by financial contributions, or by offering the possibility to rent or
lease a system (IEA Caddet,
1998).
Conclusion
· Low-temperature
solar thermal technologies can contribute many exajoules to the annual heat
demand. Today this contribution is limited to about 50 petajoules a year
(excluding heat pumps and passive solar energy use).
· World-wide, about 7 million
solar hot water systems, mainly SDHW systems, have been installed. In many
regions their dissemination strongly depends on governmental policy, mainly
because of the relatively high heat-production costs ($0.03 - 0.20 a kilowatt
hour). They can, however, compete with electric hot water systems.
· The costs of installed solar
hot water systems in moderate climate zones may be reduced 25 - 50 percent by
further technology development and/or mass production and installation.
· Active solar systems for space
heating with seasonal storage are mainly in a demonstration phase.
· Passive solar energy use has
become an attractive option in heating and cooling buildings, because of the
development of new materials and powerful simulation tools.
· Electric heat pumps for space
heating are especially attractive in countries where electricity is produced by
hydropower or wind energy. In other countries a net contribution to the energy
supply is achieved only if they have a high performance factor.
· Solar drying of agricultural
crops is in many cases a viable technological and economical option. The next
step is market introduction.
· Solar cooking provides a
significant beneficial impact. Many hundreds of thousands of solar cooking
devices have been sold, but they have limitations and can only supplement
conventional fuel
use.
Hydroelectricity
There is a general view that hydroelectricity is the renewable
energy source par excellence, non-exhaustible, non-polluting, and more
economically attractive than other options. And although the number of
hydropower plants that can be built is finite, only a third of the sites
quantified as economically feasible are tapped.
Hydropower plants emit much less greenhouse gas than do thermal
plants. Greenhouse gas emissions of hydropower are caused by the decay of
vegetation in flooded areas and by the extensive use of cement in the dam
construction. Unfortunately, there are local impacts of the use of rivers,
social as well as ecological, and they are gaining importance as people become
aware of how those impacts affect living standards.
Most renewable sources of energy hydroelectricity generation are
capital intensive but have lower operational costs than thermal and nuclear
options. The high initial cost is a serious barrier for its growth in developing
countries where most of the untapped economic potential is
located.
The potential of hydroelectricity
Chapter 5 provides extensive information on the theoretical and
technical potential of hydroelectricity. An overview is given in table 7.18,
which also presents the economically feasible potential, estimated at 8,100
terawatt-hours a year.
In 1997 total installed hydroelectric capacity was about 660
gigawatts, of which about 23 gigawatts were small scale (plant capacity of less
than 10 megawatts). About a fifth of the world electricity supply,
hydroelectricity produced 2,600 terawatt-hours (World Atlas, 1998), of
which about 3.5 percent (about 90 terawatt-hours) was in small hydroelectric
plants.
In some regions (North America, Western Europe, Pacific OECD
countries) more than 65 percent of the economically feasible potential is
already in use. In others (Sub-Saharan Africa, centrally planned Asia, India)
less than 18 percent of the potential is in use (see table 7.18). In Latin
America and the Caribbean nearly 44 percent of the economically feasible
potential is already tapped. Since the OECD operational capacity is at 80
percent of the economic potential, most experts believe this value to be an
upper limit for capacity installation.
In 1997 the hydro capacity under installation was 125 gigawatts.
Assuming these plants will have the same average capacity factor as the units
already in operation (45 percent), this represents another 490 terawatt-hours a
year, or 6 percent of the economically feasible potential. This will push the
hydroelectricity production in the first years of the 21st century to at least
3,000 terawatt-hours a year. By the middle of this century that could grow to
6,000 terawatt-hours a year (IIASA and WEC, 1998; Johansson and others, 1993a).
In 1997 developing countries had a total installed capacity of
262 gigawatts, soon to grow to about 364 gigawatts (see table 7.18). In 1997 the
70 major developing countries were responsible for 225 gigawatts of installed
capacity (World Atlas, 1998). In 1989 - 97 these 70 countries’
installed capacity increased by 40 gigawatts, or about 22 percent (2.5 percent a
year),2 much less than the 5.7 percent a year growth forecast by
Moore and Smith (1990). The significant slowdown in the construction of
hydroelectric plants in developing countries, compared with 1970 - 90 (Moore and
Smith, 1990; Churchill, 1994), can mainly be explained by shortages of capital
and difficulties in finding financing
abroad.
Hydroelectric technology development
Technologies to reduce dam construction and power generation
costs. Hydroelectricity generation is usually regarded as a mature
technology, unlikely to advance. That may be so for the efficiency and cost of
conventional turbines, where the large number of units constructed has led to an
optimised design. But for small-scale hydropower, there is room for further
technical development. Examples include the use of variable speed turbines at
low heads, induction generators, electronic control and telemetry, submersible
turbo-generators, new materials, and the further development of innovative
turbines (EUREC Agency, 1996; Schainker, 1997).
On dam construction, there has recently been further progress,
especially with roller compacted concrete (RCC) dams. The lower cement content
and the mechanised placing of the concrete yield a relatively low unit cost of
around $30 - 40 per cubic metre of dam body, less than half the price of
conventional placed concrete. Due to the rapid concrete placement with the RCC
technique, dams can grow by 60 centimetres a day, making it possible to build a
200-metre high dam in less than a year (Oud and Muir, 1997). With RCC dams,
river diversion during construction is often in-river, rather than by diversion
tunnels, saving time and money. The RCC technology has made many dams feasible
that previously appeared economically unattractive (Oud and Muir, 1997). For
smaller structures, dams with geo-membrane lining (up to 80 metres high) and
inflatable rubber weirs (up to 15 metres high) are becoming acceptable
alternatives to concrete weirs and low rock-fill or earth-fill dams.
Other parts of the operational system, such as spillways, are
now better understood, allowing the use of higher specific discharges per meter
width of the spillway chute, saving on cost (Oud and Muir, 1997). Tunnel-boring
machines are becoming more attractive. Underground water conduits are attractive
because they do not disturb the landscape (Oud and Muir, 1997). Power houses and
control rooms are being designed to cut costs and manufacturing time of
hydroelectric equipment.
The present installed system cost ranges from $1,000 - 1,500 a
kilowatt for the most favourable sites. In practice cost figures of $3,000 a
kilowatt and higher are also found. There are some expectations that technology
advances can reduce costs, but in small amounts since the present technology is
well optimised. With low investment costs and favourable financing conditions
(interest 6 percent a year and 30 years for payment), generation costs for an
average capacityfactor of 45 percent is $0.04 - 0.06 a kilowatt hour. At higher
capacity factors and with longer payback times, lowest generations costs of
about $0.02 a kilowatt hour are found. Because the plant is usually placed far
from the point of electricity use, investment can also be required for
transmission, perhaps adding another $0.01 per kilowatt-hour.
For small-scale hydropower, the unit cost is expected to be
higher than for large-scale hydro. But with the choice of very favourable sites,
the use of existing administrative structures and existing civil works for
flood-control purposes, avoiding the use of cofferdams during installation, and
refurbishing of old sites, electricity production costs may come down from $0.04
- 0.10 a kilowatt-hour to $0.03 - 0.10 a kilowatt-hour.
Technologies to reduce social and ecological impacts.
Considering the criticism of hydropower production, especially when large dams
are built, modern construction tries to include in the system design several
technologies that minimise the social and ecological impacts. Some of the most
important impacts are changes in fish amount and fish biodiversity,
sedimentation, biodiversity perturbation, water quality standards, human health
deterioration, and downstream impacts (see also chapter 3).
|
Only a third of the sites
quantified as
economically
feasible for hydro-
electricity production
are tapped.
|
· Changes in fish
amount and fish biodiversity. Technologies are being pursued to preserve
subsistence and commercial fish production as well as fish biodiversity. Further
R & D is being recommended to achieve a quantitative understanding of the
responsesof fish to multiple stresses inside a turbine and to develop biological
performance criteria for use in advanced turbine design (National Laboratory,
1997). Inclusion of passage facilities, such as fish ladders (Goodland, 1997),
are becoming a necessity for renewing dam operational contracts in the United
States. In tropical countries, where such technology is not useful, electric
luring of fish into containers or elevators, as carried out in Yacyreta(between
Argentina and Paraguay), may be a solution (Goodland, 1997). Because most new
dams will be built in tropical countries, it is necessary to carry out extensive
studies to identify new or rare species and determine if they can live in
adjacent rivers not slated for damming (Goodland, 1997).
· Sedimentation.
Sedimentation increases strongly when catchments are developed. Another
possibility is the sporadic filling of the reservoir with large amount of land
due to land slide or due to some exceptional flood (Goodland, 1997). Such
problems can be minimised through watershed management, debris dams, sediment
bypassing, sediment flushing, sediment sluicing, sediment dredging, and using
reservoir density currents.
· Biodiversity perturbation.
Conservation of biodiversity demands, at the least, no net loss of species.
This requires complete knowledge of what is present before the dam is built,
which is difficult. The main conservation measures have become site selection
and selection of reservoir size. In practice, the conservation of onsite
biodiversity depends on not flooding large areas, particularly intact habitats
such as tropical forests, and on conserving an offset in perpetuity (Goodland,
1997).
· Water quality.
Initially water quality is mainly disturbed by the large amount of biomass
left in the flooded area and by filling the reservoir. This can be mitigated by
removing biomass and by fillingthe reservoir at a moderate rate. After filling,
thermal stratification frequently occurs in reservoirs with a long water
residence time (full seasons cycle) and water depths of more than 10 metres.
Reservoir stratification can release water of colder or warmer temperatures than
the river would experience without a dam, with positive or negative impacts on
the river fishery. It can be minimised through (1) changes in inlet structure
configuration, (2) in-reservoir de-stratification, (3) multilevel outlet works
for mitigation of downstream effects, and (4) positive mixing and aeration by
fountain jets or compressed air. But sufficient knowledge is not yet available,
and further R&D is recommended (National Laboratory, 1997).
· Human health deterioration.
Reservoirs can cause epidemics of three water-related diseases: malaria,
schistosomiasis, and Japanese B encephalitis. The proliferation of malaria and
encephalitis can be avoided with chemicals and chemotherapy. But resistance
ofmosquitoes and Plasmodium protozoan parasite makes malaria increasingly
expensive to control. Schistosomiasis is better controlled by chemotherapy.
· Downstream impacts.
Downstream social impacts can exceed upstream resettlement upheavals, and
they deserve more attention than is common nowadays. Cessation of annual fertile
silt and moisture deposition leads to declining yields, grazing impairment, fish
and wildlife decline, and erosion at the mouth of the river, due to the
reduction in suspended particles that replace the land normally washed out by
the ocean. In addition, the decline in water availability and agricultural
yields increases the competition for water and other scarce resources.
Furthermore, the construction of a dam forces people who are long adapted to
cyclical floods to switch suddenly to rainfed livelihoods (Goodland, 1997). Some
of these issues can be mitigated through off-takes at various levels to allow
for flexibility of the water temperature in accord with downstream needs, and
others through measures that reduce reservoir stratification, including local
mixing and shorter water residence
time.
System aspects
To even out annual seasonal flow, dams are erected and land
areas flooded. Since the flows vary from year to year, every attempt to increase
the reliability of the water supply increases the flooded area, and that
increase is exponential for reliability above 70 percent (Moreira and Poole,
1993). Another alternative to increase system reliability and reduce cost is
hydropower complementation, based on the notion that different river basins can
be wire connected, letting a higher flow in one basin compensate for low flow in
the other. Hydrologic diversity usually involves large geographic distance, but
on either side of the equator distances are modest (Moreira and Poole, 1993).
A third alternative is to use hydroelectricity to store
intermittent renewable energy. Storage energy, to ensure reliable, high quality
service, will provide for increased renewable use and system stabilisation with
distributed generation. Areas of importance include pumped hydro (Schainker,
1997). Further research is recommended to examine the benefits and costs of
coupling hydropower to renewable energy storage needs (PCAST, 1997).
TABLE 7.18. HYDROELECTRIC THEORETICAL, TECHNICALLY
FEASIBLE, AND ECONOMICALLY FEASIBLE POTENTIAL AS WELL AS INSTALLED AND UNDER
INSTALLATION CAPACITY IN 1997, BY REGION (TERAWATT-HOURS A YEAR UNLESS OTHERWISE
NOTED)
|
Region |
Gross theoretical potential |
Technically feasible potential |
Economically feasible potential |
Installed hydro capacity (gigawatts) |
Installed hydro capacity in developing countries
(gigawatts) |
Production from hydro plants |
Hydro capacity under construction (gigawatts) |
Hydro capacity under construction in developing countries
(gigawatts) |
|
North America |
5,817 |
1,509 |
912 |
141.2 |
0 |
697 |
0.9 |
0 |
|
Latin America and Caribbean |
7,533 |
2,868 |
1,199 |
114.1 |
114.1 |
519 |
18.3 |
18.3 |
|
Western Europe |
3,294 |
1,822 |
809 |
16.3 |
16.3 |
48 |
2.5 |
2.5 |
|
Central and Eastern Europe |
195 |
216 |
128 |
9.1 |
9.1 |
27 |
7.7 |
7.7 |
|
Former Soviet Union |
3,258 |
1,235 |
770 |
146.6 |
16.5 |
498 |
6.7 |
3.9 |
|
Middle East and North Africa |
304 |
171 |
128 |
21.3 |
0 |
66 |
1.2 |
0.03 |
|
Sub-Saharan Africa |
3,583 |
1,992 |
1,288 |
65.7 |
0 |
225 |
16.6 |
0 |
|
Centrally planned Asia |
6,511 |
2,159 |
1,302 |
64.3 |
64.3 |
226 |
51.7 |
51.7 |
|
South Asiaa |
3,635 |
948 |
103 |
28.5 |
28.5 |
105 |
13.0 |
13.0 |
|
Pacific Asiaa |
5,520 |
814 |
142 |
13.5 |
13.5 |
41 |
4.7 |
4.7 |
|
Pacific OECD |
1,134 |
211 |
184 |
34.2 |
0 |
129 |
0.8 |
0 |
|
World total |
40,784 |
13,945 |
6,965 |
654.8 |
262.3 |
2,581 |
124.1 |
101.8 |
|
World totalb |
~40,500 |
~14,320 |
~8,100 |
~660 |
|
~2,600 |
~126 |
|
a. Several South Asian and other Pacific Asian
countries do not release their economically feasible potential. As a result
economically feasible potential for these regions are too low, and in one case
for South Asia are even lower than the electricity generated. b. These are the
values quoted in the source. They differ from the world total in the previous
row mainly due the inclusion of estimates for countries for which data are not
available.
Source: World Atlas,
1998.
Environmental and social impacts
The average energy density of hydroelectricity generation shows
thatt significant amounts of land have been flooded for this purpose (see
chapter 5). If new plants will keep the average energy density (optimistic,
since the best sites have already been used), some extra 50 million hectares of
land will be flooded to make available two-thirds of the economic potential.
This figure may not look so high relative to the land required for biomass
energy production, but river surroundings are the most densely inhabited areas
in rural regions. Several other environmental impacts in the flooded area can be
minimised by convenient choosing of sites where it is possible to store large
water volumes in a small area, such as canyons.
With a responsibility to preserve the environment, the overall
cost of producing hydropower is increasing. As the hydropower industry moves
towards an open market, it is a challenge to figure out how it will survive
marginal cost pricing. Some operators with high costs could also find themselves
in a restructured environment with old and insufficient generating plant. In the
United States several dams associated with power production are being
decommissioned, mainly because they disturb commercial fishing or impose a
significant onus for biodiversity (Koch, 1996).
A well-understood impact is caused by displacing inhabitants
from the flooded area, and mitigating it can represent a significant cost for
the project. Some estimates put the displacement cost per person at about six
times the annual per capita gross national product (Besant-Jones, 1995) - and
others as high as $25,000 per family. Displacing 100,000 inhabitants can add $2
billion to the project cost, enough to make it unfeasible. Strong criticism is
always to be expected for hydro projects requiring the relocation of a great
number of people. Of utmost importance here is building trust between the people
affected by resettlement, the developer, and the authorities; people must know
and feel that they matter and that they are taken
seriously.
Economic and financial aspects
Hydropower plants are more capital intensive than thermal
plants. Historically, hydroelectricity in the developing world has been financed
predominantly from public or guaranteed funding. The World Bank has financed
about 110 hydroelectric power projects in 50 developing countries, ranging from
6.6 megawatts to 2,240 megawatts, with a combined generating capacity of about
35 gigawatts. Reliable global data on trends in hydro financing are not
available. But World Bank data show a market decline in its lending for hydro -
from 3.4 percent to 2.5 percent of the approximately $20 billion it lends
annually. There is no doubt that environmental pressures on the Bank (and other
multilateral agencies) account for some of this decline (Briscoe, 1998).
In the past few years with the emerging privatisation of the
electric sector in developing countries, private capital flows have increased
dramatically (Briscoe, 1998). Private activity in infrastructure, previously
concentrated in East Asia and Latin America, is now expanding in Eastern Europe
and Central Asia, South Asia, and Sub-Saharan Africa. Private infrastructure
investment can grow much more, since it accounted for only about 15 percent of
all infrastructure investment in developing countries in 1996. Even so, the
private sector sees substantial risks, some inherent in the degree to which each
hydro project (unlike thermal projects) has to be tailored to specific
hydrological, geographic, and geological conditions.
|
Modern construction of dams
tries to include
technologies
that minimize the social
and ecological
impacts. |
In addition, hydropower project costs have tended to exceed
estimates substantially. A World Bank review of 80 hydro projects completed in
the 1970s and 1980s indicate that three-fourths had final costs in excess of
budget. Costs were at least 25 percent higher for half the projects and 50
percent or more for 30 percent of the projects. Costs were less than estimated
on 25 percent of projects (Bacon and others, 1996). Major reasons for such cost
increases were unexpected geologic conditions, funding delays, and resettlement
problems (Churchill, 1997).
It is essential that the hydro industry comes to grips with the
poor record of cost estimation and project implementation. This record has
caused the financial community to regard hydro project as riskier than in the
past, raising the cost of capital and pricing many hydro projects out of the
market. Inadequate resource exploration and site investigation is one reason for
the cost and schedule overruns. Governments can solve this by initiating careful
resource and site investigations at an early stage using public money. They can
recover these costs from the project developer as part of an authorisation or
tendering procedure.
It is much easier to involve the private sector in smaller
projects, of 40 - 400 megawatts, where hydropower plants are accepted as
environmentally benign if they are run-of-the river, incorporate high head, and
are on tributaries to the big rivers (Briscoe, 1998). For larger projects there
has been, and will be, little private sector financing unless there is
substantial involvement of governments and bilateral and multilateral agencies
(Briscoe,
1998).
Conclusion
· Hydropower
contributes about 20 percent to the electricity supply, about a third of its
potential. The supply of hydroelectricity may grow from 2,600 terawatt-hours a
year in 1997 (of which about 3.5 percent from small-scale hydropower) to 3,000
terawatt-hours in the first years of the 21st century and to 6,000
ter-awatt-hours a year in 2050.
· Hydropower is a clean energy
source with many technical advantages over thermal and nuclear plants: operating
reserves, spinning reserves, load following services, voltage control, and cold
start capability. Some of these characteristics help in aggregating intermittent
sources of electricity to the existing system.
· The electricity production
cost of large hydroelectricity plants is $0.02 - 0.08 a kilowatt-hour, with new
reductions from technology development offset by the need to mitigate social and
environmental effects. For small hydroelectricity plants, the electricity
production cost may come down from $0.03 - 0.10 a kilowatt-hour to $0.04 - 0.10
a kilowatts-hour in the long term.
· Improvements and efficiency
measures are needed in dam structures, turbines, generators, substations,
transmission lines, and environmental mitigation technology to sustain
hydropower’s role as a clean, renewable energy source. Of utmost importance
is building trust between the people affected by resettlement, the developer and
the authorities - to address the criticisms regarding social and environmental
impacts.
· The emerging liberalisation
and privatisation in the electric sector in most industrialised countries may
reduce investments in new hydropower plants since they are more capital
intensive and riskier than thermal
plants.
Geothermal energy
Geothermal energy has been used for bathing and washing for
thousands of years, but it is only in the 20th century that it has been
harnessed on a large scale for space heating, industrial energy use, and
electricity production. Prince Piero Ginori Conti initiated electric power
generation with geothermal steam at Larderello in Italy in 1904. The first large
municipal district heating service started in Iceland in the 1930s.
Geothermal energy has been used commercially for some 70 years,
and on the scale of hundreds of megawatts, 40 years, both for electricity
generation and direct use. Its use has increased rapidly in the past three
decades - at about 9 percent a year in 1975 - 95 for electricity and at about 6
percent a year for direct use. Geothermal resources have been identified in more
than 80 countries, with quantified records of geothermal use in
46.
The potential of geothermal energy
Exploitable geothermal systems occur in several geological
environments. High-temperature fields used for conventional power production
(with temperatures above 150° C) are largely confined to areas with young
volcanism, seismic, and magmatic activity. But low-temperature resources
suitable for direct use can be found in most countries. The ground source heat
pump has opened a new dimension in using the Earth’s heat, as these pumps
can be used basically everywhere.
Geothermal use is commonly divided into two categories -
electricity production and direct application. In 1997 world-wide use of
geothermal energy amounted to about 44 terawatt-hours a year of electricity and
38 terawatt-hours a year for direct use (table 7.19). A new estimate of world
geothermal potential shows the useful accessible resource base for electricity
production to be some 12,000 terawatt-hours a year (Bj�rnsson and others, 1998).
Since only a small fraction of the geothermal potential has been developed,
there is ample space for accelerated use of geothermal energy for electricity
generation in the near future.
The scope for direct use of geothermal energy is even more
plentiful, as the useful accessible resource base is estimated to be 600,000
exajoules, which corresponds to the present direct use of geothermal energy for
some 5 million years (Bj�rnsson and others, 1998). With both ample resources and
a relatively mature technology at hand, the question of future development of
geothermal energy use boils down to economic and political competitiveness with
other energy sources on the markets in different
countries.
Recent developments
Electricity production. The growth of the total
generation capacity in 1990 - 98 was about 40 percent (table 7.20), with the
largest additions in the Philippines (957 megawatts), Indonesia (445 megawatts),
Japan(315 megawatts), Italy (224 megawatts), Costa Rica (120 megawatts), Iceland
(95 megawatts), theUnited States (75 megawatts), New Zealand (62 megawatts), and
Mexico (43 megawatts). The most progressive of these countries, the Philippines,
with 22 percent of its electricity generated with geothermal steam, plans to add
580 megawatts to its installed capacity in 1999 - 2008 (Benito, 1998). Other
countries generating 10 - 20 percent of their electricity with geothermal are
Costa Rica, El Salvador, Kenya, and Nicaragua.
TABLE 7.19. ELECTRICITY GENERATION AND DIRECT USE OF
GEOTHERMAL ENERGY, 1997
|
Region |
Electricity generation |
Direct use |
|
Installed capacity (gigawatts-electric) |
Total production |
Installed capacity (gigawatts-thermal) |
Total production |
|
|
Terawatt-hours (electric) |
Percent |
|
Terawatt-hours (thermal) |
Percent |
|
European Union |
0.75 |
3.8 |
|
1.03 |
3.7 |
|
|
Europe, other |
0.11 |
0.5 |
|
4.09 |
16.1 |
|
|
Total Europe |
0.86 |
4.3 |
10 |
5.12 |
19.8 |
52 |
|
North America |
2.85 |
16.2 |
|
1.91 |
4.0 |
|
|
Latin America |
0.96 |
6.9 |
|
|
|
|
|
Total Americas |
3.81 |
23.1 |
53 |
1.91 |
4.0 |
10 |
|
Asia |
2.94 |
13.0 |
30 |
3.08 |
12.2 |
32 |
|
Oceania |
0.36 |
2.9 |
6 |
0.26 |
1.8 |
5 |
|
Africa |
0.05 |
0.4 |
1 |
0.07 |
0.4 |
1 |
|
World total |
8.02 |
43.8 |
100 |
10.44 |
38.2 |
100 |
Source: Based on Stefansson and Fridleifsson,
1998.
TABLE 7.20. INSTALLED GEOTHERMAL ELECTRICITY GENERATION
CAPACITY (MEGAWATTS OF ELECTRICITY)
|
Country |
1990 |
1995 |
1998 |
|
Argentina |
0.7 |
0.7 |
0 |
|
Australia |
0 |
0.2 |
0.4 |
|
China |
19 |
29 |
32 |
|
Costa Rica |
0 |
55 |
120 |
|
El Salvador |
95 |
105 |
105 |
|
France (Guadeloupe) |
4 |
4 |
4 |
|
Guatemala |
0 |
0 |
5 |
|
Iceland |
45 |
50 |
140 |
|
Indonesia |
145 |
310 |
590 |
|
Italy |
545 |
632 |
769 |
|
Japan |
215 |
414 |
530 |
|
Kenya |
45 |
45 |
45 |
|
Mexico |
700 |
753 |
743 |
|
New Zealand |
283 |
286 |
345 |
|
Nicaragua |
70 |
70 |
70 |
|
Philippines |
891 |
1,191 |
1,848 |
|
Portugal (Azores) |
3 |
5 |
11 |
|
Russia |
11 |
11 |
11 |
|
Thailand |
0.3 |
0.3 |
0.3 |
|
Turkey |
20 |
20 |
20 |
|
United States |
2,775 |
2,817 |
2,850 |
|
Total |
5,867 |
6,798 |
8,239 |
Source: Based on IGA, 1999.
The participation of private operators in steam field
developments through BOT (build, operate, and transfer) and BOO (build, own, and
operate) contracts and through JOC (joint operation contracts) have
significantly increased the speed of geothermal development in the Philippines
(Vasquez and Javellana, 1997) and Indonesia (Radja, 1997; Aryawijaya, 1997). And
several developing countries are considering the participation of private
operators.
The electricity generation cost is variable - commonly around
$0.04 a kilowatt-hour for modern, cost-effective plants, but ranging from $0.02
- 0.10 a kilowatt-hour. The installed system costs may range from $800 - 3,000 a
kilowatt-hour. With cost reductions and under favourable conditions the cost can
come down to $0.01 - 0.02 a kilowatt-hour.
Direct use of geothermal energy. Direct application of
geothermal energy can involve a wide variety of end uses, such as space heating
and cooling, industry, greenhouses, fish farming, and health spas. It uses
mostly existing technology and straightforward engineering. The technology,
reliability, economics, and environmental acceptability of direct use of
geothermal energy have been demonstrated throughout the world.
Compared with electricity production from geothermal energy,
direct use has several advantages, such as much higher energy efficiency (50 -
70 percent compared with 5 - 20 percent for conventional geothermal electric
plants). Generally the development time is much shorter, and normally much less
capital investment is involved. And possible for high- and low-temperature
geothermal resources, direct use is much more widely available in the world. But
it is more site specific for the market, with steam and hot water rarely
transported long distances from the geothermal site. The longest geothermal hot
water pipeline in the world, in Iceland, is 63 kilometres.
The production costs for direct use are highly variable, but
commonly under $0.02 a kilowatt-hour. The production costs might range from
$0.005 - 0.05 a kilowatt-hour (thermal energy), and the turnkey investments
costs from $200 - 2,000 a kilowatt.
The two countries with the highest energy production (Japan and
Iceland) are not the same as the two with the highest installed capacities
(China and the United States), because of the variety in the load factors for
the different types of use (table 7.21).
Lund (1996) has recently written a comprehensive summary on the
various types of direct use of geothermal energy. Space heating is the dominant
application (33 percent). Other common applications are
bathing/swimming/balneology (19 percent), greenhouses (14 percent), heat pumps
for air conditioning and heating (12 percent), fish farming (11 percent), and
industry (10 percent).
Heat pump applications. Geothermal energy previously had
considerable economic potential only in areas where thermal water or steam is
found concentrated at depths less than 3 kilometres, analogous to oil in
commercial oil reservoirs. This has changed recently with developments in the
application of ground source heat pumps - using the Earth as a heat source for
heating or as a heat sink for cooling, depending on the season. These pumps can
be used basically everywhere.
Switzerland, not known for hot springs and geysers, shows the
impact geothermal heat pumps can have - generating about 230 gigawatt-hours a
year in 1994 (Rybach and Goran, 1995). In the United States, at the end of 1997,
more than 300,000 geothermal heat pumps were operating nation-wide in homes,
schools, and commercial buildings for space heating and cooling (air
conditioning), providing 8 - 11 terawatt-hours a year of end-use energy
according to different estimates.
Geothermal heat pumps are rated among the most energy-efficient
space conditioning equipment available in the United States. Reducing the need
for new generating capacity, they perform at greater efficiencies than
conventional air source heat pumps used for air conditioning. Several electric
utilities have introduced financial incentive schemes by encouraging house
owners to use groundwater heat pumps for space cooling and heating purposes and
thus reducing the peak loads on their electric systems. The Geothermal Heat Pump
Consortium has established a $100 million 6-year program to increase the
geothermal heat pump unit sales from 40,000 to 400,000 annually, which will
reduce greenhouse gas emissions by 1.5 million metric tonnes of carbon
equivalent annually (Pratsch, 1996). A third of the funding comes from the U.S.
Department of Energy and the Environmental Protection Agency, two-thirds from
the electric power industry. Financial incentive schemes have also been set up
in Germany and
Switzerland.
Potential market developments
Some 80 countries are interested in geothermal energy
development, of which almost 50 now have quantifiable geothermal use. A
worldwide survey (Fridleifsson and Freeston, 1994) showed that the total
investments in geothermal energy in 1973 - 92 were about $22 billion. In 1973 -
82 public funding amounted to $4.6 billion, private funding to $3 billion. In
1983 - 92 public funding amounted to $6.6 billion, private funding to $7.7
billion. Of special interest, private investment in geothermal rose by 160
percent from the first decade to the second, while public investments rose by 43
percent, showing the confidence of private enterprises in this energy source and
demonstrating its commercial viability.
Extrapolations of past trends show the long-term prognosis for
potential development. In 1975 - 95 the growth of the installed capacity for
electricity generation world-wide was about 9 percent a year. If this rate
continues for another 25 years, the installed capacity would be 25 gigawatts of
electricity in 2010 and 58 gigawatts of electricity in 2020 (table 7.22). The
annual electricity generation shown in table 7.22 is based on the assumption
that the use factor will be similar to that in 1997 (Stefansson and
Fridleifsson, 1998). In 1990 - 98 the annual growth was close to 4 percent a
year, not 9 percent. So, new incentives are needed to realise this scenario.
The average growth in the direct use of geothermal energy can be
estimated at about 6 percent a year in the past decade. With annual growth rate
of 6 percent in the near future, the installed capacity would be around 22
gigawatts of thermal energy in 2010 and 40 gigawatts of thermal energy in 2020
(see table 7.22). This is not taking into account the rapid development of
ground-based heat pumps in recent years. In a matter of some years, this sector
has grown from infancy to 1,400 megawatts of thermal energy in the United States
alone. Development is also fast in Switzerland, Germany, and Sweden. The
forecast for direct use therefore might be somewhat pessimistic.
The U.S. Department of Energy’s Office of Geothermal
Technologies recently identified five strategic goals for geothermal energy as a
preferred alternative to polluting energy sources (USDOE OGT, 1998), including:
· Supply the
electric power needs of 7 million U.S. homes (18 million people) fromgeothermal
energy by 2010.
· Expand direct uses of
geothermal resources and applicationof geothermal heat pumps to provide the
heating, cooling, and hot water needs of 7 million homes by 2010.
· Meet the basic energy needs of
100 million people in developing countries by using U.S. geothermal technology
to install at least 10 gigawatts by 2010.
TABLE 7.21. GEOTHERMAL ENERGY PRODUCTION WITH DIRECT USE IN
COUNTRIES WITH MORE THAN 40 MEGAWATTS-THERMAL INSTALLED CAPACITY
|
Country |
Installed capacity
(gigawatts-thermal) |
Heat production
(terawatt-hours a year) |
|
Japan |
1.16 |
7.50 |
|
Iceland |
1.44 |
5.88 |
|
China |
1.91 |
4.72 |
|
United States |
1.91 |
3.97 |
|
Hungary |
0.75 |
3.29 |
|
Turkey |
0.64 |
2.50 |
|
New Zealand |
0.26 |
1.84 |
|
France |
0.31 |
1.36 |
|
Italy |
0.31 |
1.03 |
|
Germany |
0.31 |
0.81 |
|
Georgia |
0.25 |
n.a |
|
Serbia |
0.09 |
0.67 |
|
Russia |
0.21 |
0.67 |
|
Romania |
0.14 |
0.53 |
|
Switzerland |
0.19 |
0.42 |
|
Slovak Rep. |
0.08 |
0.38 |
|
Sweden |
0.05 |
0.35 |
|
Tunisia |
0.07 |
0.35 |
|
Bulgaria |
0.10 |
0.35 |
|
Israel |
0.04 |
0.33 |
|
Macedonia FYR |
0.08 |
0.15 |
|
Poland |
0.04 |
0.14 |
Source: Based on Stefansson and Fridleifsson,
1998.
TABLE 7.22. POTENTIAL DEVELOPMENT OF THE INSTALLED CAPACITY
AND ENERGY PRODUCTION FROM GEOTHERMAL SOURCES IN THE FORM OF ELECTRICITY AND
DIRECT USE OF HEAT, 1997 - 2020
|
Year |
Gigawatts - electric |
Terawatt- hours (electric) |
Gigawatts- electric |
Terawatt- hours (thermal) |
|
1997 |
8.0 |
43.8 |
10.4 |
38.20 |
|
2010 |
24 |
134 |
22 |
81 |
|
2020 |
58 |
318 |
40 |
146 |
Environmental aspects
Geothermal fluids contain a variable quantity of gas - largely
nitrogen and carbon dioxide with some hydrogen sulphide and smaller proportions
of ammonia, mercury, radon, and boron. The amounts depend on the geological
conditions of different fields. Most of the chemicals are concentrated in the
disposal water, routinely re-injected into drill holes, and thus not released
into the environment. The concentrations of the gases are usually not harmful,
and the removal of such gases as hydrogen sulphide from geothermal steam is a
routine matter in geothermal power stations where the gas content is high. The
range in carbon dioxide emissions from high-temperature geothermal fields used
for electricity production in the world is 13 - 380 grams a kilowatt-hour, less
than for fossil fuel power stations. Sulphur emissions are also significantly
less for geothermal than fossil fuel electric power stations.
The gas emissions from low-temperature geothermal resources are
normally only a fraction of the emissions from the high-temperature fields used
for electricity production. The gas content of low-temperature water is in many
cases minute - in Reykjavik, Iceland, the carbon dioxide content is lower than
that of the cold groundwater. In sedimentary basins, such as the Paris basin,
the gas content may be too high to be released. In such cases the geothermal
fluid is kept at pressure within a closed circuit (the geothermal doublet) and
re-injected into the reservoir without any degassing. Conventional geothermal
schemes in sedimentary basins commonly produce brines that are generally
re-injected into the reservoir and thus never released into the environment. The
carbon dioxide emission from these is thus
zero.
Conclusion
· Geothermal energy
has been used commercially for 70 years, both for electricity generation and
direct use, with use increasing rapidly in the past three decades. In 1975 - 95
the growth rate for electricity generation was about 9 percent a year and in
recent years about 4 percent a year. For direct use it was about 6 percent a
year.
· For the 46 countries with
records of geothermal use the electricity generated was 44 terawatt-hours of
electricity and the direct use 38 terawatt-hours of thermal energy in 1997, and
45 terawatt-hours of electricity and 40 terawatt-hours of thermal energy in
1998.
· Assuming world-wide annual
growth to average 9 percent a year through 2020, the electricity production may
reach about 130 terawatt-hours in 2010 and about 310 terawatt-hours in 2020.
Assuming the annual growth rate for direct use to continue at 6 percent, the
energy production may reach about 80 terawatt-hours in 2010 and about 140
terawatt-hours in 2020.
· Recent developments in the
application of the ground source heat pump opens a new dimension in the scope
for using the Earth’s heat. Heat pumps can be used basically everywhere and
are not site-specific, as conventional geothermal resources are.
· Geothermal energy, with its
proven technology and abundant resources, can make a significant contribution
towards reducing the emission of greenhouse gases. But it requires that
governments implement policies and measures to improve the competitiveness of
geothermal energy systems with conventional energy systems.
|
Not until the 20th century has
geothermal energy been
harnessed
on a large scale for space heating,
industrial energy use,
and
electricity production. |
Marine energy technologies
The oceans, covering more than two-thirds of the Earth,
represent an enormous energy resource containing vastly more energy than the
human race could possibly use. The energy of the seas is stored partly as
kinetic energy from the motion of waves and currents and partly as thermal
energy from the sun. (Chapter 5 summarises the nature and scale of the ocean
energy resource.)
Although most marine energy is too diffuse and too far from
where it is needed to be economically exploited, in special situations it can be
effectively captured for practical use. Tidal energy needs the more extreme
tidal ranges or currents. Wave energy needs to be exploited in places with a
higher-than-average wave climate. Ocean thermal energy conversion needs as large
a temperature difference as possible between the surface waters and the water
near the seabed. Such requirements tend to limit the use of the resource to
certain areas of coastline offering the coincidence of a suitably intense
resource and a potential market for the energy. This makes many published
estimates of enormous global marine energy resources
academic.
The potential and technology of marine energy
The main marine energy resources can be summarised, in order of
maturity and use, as:
· Tidal barrage
energy.
· Wave energy.
· Tidal/marine currents.
· Ocean thermal energy conversion (OTEC).
· Salinity gradient/osmotic energy.
· Marine biomass fuels.
Exploiting salinity gradients and the cultivation of marine
biomass are not discussed because their exploitation seems a long way from any
practical application, though new research might clarify their potential.
Tidal barrage energy. The rise and fall of the tides
creates, in effect, a low-head hydropower system. Tidal energy has been
exploited in this way on a small scale for centuries in the form of water mills.
The one large modern version is the 240 megawatt-electric La Rance scheme, built
in France in the 1960s, the world’s largest tidal barrage, using a
conventional bulb turbine. A handful of smaller schemes have also been built.
Numerous studies have been completed for potentially promising
locations with unusually high tidal ranges, such as the Bay of Fundy in Canada
and the 7-gigawatt scheme for the Severn Estuary in the United Kingdom. But most
schemes of this kind have proved to be extremely large and costly. The proposed
Severn Barrage scheme - which the U.K. government decided not to pursue - would
have involved the use of 216 turbo-generators, each nine metres in diameter and
40 megawatts in capacity. The load factor would have been around 23 percent, the
cost an estimated $12 billion (Boyle, 1996).
The combination of high costs, major environmental impact, and
poor load factors makes this technology generally unattractive, but there may be
occasional niche applications for it in the future in especially favourable
locations.
Wave energy. Energy can be extracted from waves. As an
example, in deep water off the northwest coast of Scotland (one of the more
intense wave climates in the world) the average energy along the prevailing wave
front can be 70 kilowatts a metre (or more). Closer inshore this falls to an
average of around 20 or 30 kilowatts a metre, and along the shoreline to about
10 kilowatts a metre or less. The energy availability is thus sensitive to the
distance from the shoreline (ETSU/DTI, 1999).
Wave energy remains at an experimental stage, with only a few
prototype systems actually working. All of the few existing systems that have
run for more than a few hours are shoreline devices (built into the shore).
Total grid-connected wave power is less than 1 megawatt, consisting of several
small oscillating water column devices in China, India, and the United Kingdom
(YY, 1998). A new generation of larger devices is under development, due to be
installed notably in the Azores (Pico) and Japan, as well as in the countries
mentioned earlier. The world’s wave energy capacity will increase to a few
megawatts in the next few years.
If wave energy is to become an important contributor to future
energy needs, it will need to move further offshore into deeper water where
there are larger and much more energetic waves. This will require a quantum leap
in the size and nature of the systems used. Systems capable of surviving under
such difficult conditions have not yet been demonstrated, so it is likely to
take a decade or more before wave energy can even start to make a contribution
to world energy needs (Fraenkel, 1999). Eventually, however, it seems likely to
contribute as much as 100 terawatt-hours a year for Europe, and perhaps three
times that for the world.
The general immaturity of wave energy technology is illustrated
by the variety of solutions proposed for exploiting it. No real consensus has
yet emerged as to the ‘best’ way to convert energy from waves into
electricity. Wave energy conversion systems can be classified as:
· Shoreline devices
(mounted on the shore).
· Near-shoreline
devices (usually installed on the seabed in water less than 20 metres
deep).
· Offshore or deep-water devices
(usually floating devices moored in deep water with highly energetic wave
conditions).
The most popular shoreline device is the oscillating water
column (OWC), a large chamber that has a free opening to the sea, encloses an
air volume, and is compressed by the wave pressure. A duct between the chamber
and the outside atmosphere allows air to be drawn in and out of the chamber as a
result of the variation of pressure caused by incoming waves. An air-turbine
system, installed in the duct, generates electricity from this reversing air
flow.
Most near-shore wave energy converters are designed to be
deployed in lines parallel to the shoreline to intercept the wave energy.
Another concept is the point absorber, which can occupy a small space yet
capture the energy from a larger area surrounding it using resonance effects.
Studies show that such arrays can be highly efficient (Randlov and others,
1994). In the longer term other large floating devices, such as the Salter Duck,
which relies on modules that rock in response to wave action, will convert the
higher power levels available farther offshore.
Tidal and marine current energy. Tidal and marine current
energy is the most recent of the marine energy resources to be seriously
studied, with most work in the 1990s. The results show that large-scale energy
generation from currents requires a totally submerged turbine - and, to be
reliable, offshore large, robust systems are required that are only now becoming
technically feasible.
In most places the movements of seawater are too slow - and the
energy availability is too diffuse - to permit practical energy exploitation.
But there are locations where the water velocity is speeded up by a reduction in
cross-section of the flow area, such as straits between islands and the
mainland, around the ends of headlands, and in estuaries and other such
topographical features. As with wind energy, a cube law relates instantaneous
power to fluid velocity. So a marine current of 2.5 metres a second (5 knots),
not an unusual occurrence at such locations, represents a power flux of about 8
kilowatts a square metre. The minimum velocity for practical purposes is around
1 metre a second (2 knots), about 0.5 kilowatts a square metre. The main siting
requirement is thus a location having flows exceeding about 1.5 metres a second
for a reasonable period (Fraenkel, 1999; IT Power, 1996).
Data on marine currents are sparse. A major study by the
European Commission evaluating the tidal current resource for 106 locations
around Europe estimated an exploitable resource from just those sites of 48
terawatt-hours a year (IT Power, 1996). The U.K. government recently came up
with an estimate of about 320 megawatts of installed capacity for the United
Kingdom by 2010 (ETSU/DTI, 1999). There is potential at known United Kingdom
locations to install several gigawatts of tidal turbines. The worldwide
potential is obviously much larger.
All that has been done so far is the short-term demonstration of
small experimental model systems in the sea, the largest so far being only 15
kilowatts, at Loch Linnhe in Scotland in 1994. A Japanese university
successfully ran a 3-kilowatt turbine on the seabed off the Japanese coast for
some 9 months, and a floating system of about 5 kilowatts was demonstrated in
Australian waters. Work is under way to develop and install the first
grid-connected tidal current turbine, rated at 300 kilowatts, during 2000.
TABLE 7.23. CURRENT STATUS OF MARINE RENEWABLE ENERGY
TECHNOLOGIES
|
Technology |
Maturity |
Load factor (percent) |
Installed capital cost (dollars per kilowatt) |
Unit cost of electricity (dollars per kilowatt-hour)
|
|
Tidal barrage |
Virtually abandoned |
20 - 30 |
1,700 - 2,500 |
0.08 - 0.15 |
|
Wave - shoreline OWC |
Experimental |
20 - 30 |
2,000 - 3,000 |
0.10 - 0.20 |
|
Wave - near shoreline OWC |
Commercial 2002 - 05 |
25 - 35 |
1,500 - 2,500 |
0.08 - 0.15 |
|
Wave - offshore - point absorber |
Commercial 2010 or later |
30 - 60 |
2,500 - 3,000 |
0.06 - 0.15 |
|
Tidal current turbine |
Commercial 2005 - 10 |
25 - 35 |
2,000 - 3,000 |
0.08 - 0.15 |
|
OTEC |
Commercial 2005 - 10 |
70 - 80 |
Unclear |
Unclear |
The various turbine rotor options generally coincide with those
used for wind turbines. The two main types are the horizontal axis, axial-flow
turbine (with a propeller type of rotor) and the cross-flow or Darrieus turbine,
in which blades rotate about an axis perpendicular to the flow. The more
promising rotor configuration seems to be the conventional axial flow rotor.
The maximum flow velocity tends to be near the sea’s
surface, so marine current turbine rotors ideally need to intercept as much of
the depth of flow as possible, but especially the near-surface flow. Options for
securing a rotor include mounting it beneath a floating pontoon or buoy,
suspending it from a tension leg arrangement between an anchor on the seabed and
a flotation unit on the surface, and seabed mounting (feasible in shallow water,
but more difficult in deeper water). Floating devices have the problem of
providing secure anchors and moorings. Seabed-mounted devices seem more
straightforward to engineer. One option is a mono-pile set into a socket drilled
into the seabed, which seems the most cost-effective solution, just as it is for
offshore wind turbines.
Ocean thermal energy conversion. Exploiting natural
temperature differences in the sea by using some form of heat engine,
potentially the largest source of renewable energy of all, has been considered
and discussed for the best part of 100 years (Boyle, 1996). But the laws of
thermodynamics demand as large a temperature difference as possible to deliver a
technically feasible and reasonably economic system. OTEC requires a temperature
difference of about 20 degrees Celsius, and this limits the application of this
technology to a few tropical regions with very deep water. Two main processes
are used for power production from this source, both based on the Rankine
(steam/vapour) cycle:
· The open cycle
system flash evaporates warm seawater into vapour (at reduced pressure) and then
draws it through a turbine by condensing it in a condenser cooled by cold
seawater.
· The closed cycle system uses
warm seawater to boil a low-temperature fluid, such as ammonia, which is then
drawn through a turbine by being condensed in a heat exchanger with cold
seawater and then recycled back to the boiler by a feed pump.
Offshore OTEC is technically difficult because of the need to
pipe large volumes of water from the seabed to a floating system, the huge areas
of heat exchanger needed, and the difficulty of transmitting power from a device
floating in deep water to the shore (SERI, 1989). A few experimental OTEC plants
have been tested, notably in Hawaii, but do not seem to offer economic
viability. Consequently, OTEC is not likely to make a major contribution to the
energy supply in the short to medium term. Shoreline OTEC, however, could be
more readily developed and applied economically than devices floating in deep
waters.
The latest thinking is that OTEC needs to be applied as a
multipurpose technology: for example, the nutrient-rich cold water drawn from
the deep ocean has been found to be valuable for fish-farming. In addition, the
cold water can be used directly for cooling applications in the tropics such as
air conditioning (NREL, 1999). If OTEC takes off, it is likely to be with energy
as a
by-product.
Economic aspects
Because of limited experience with the marine renewables, it is
difficult to be certain how economic they will be if developed to a mature
stage. There is experience (albeit limited) with tidal barrages, but their
failure to take off speaks for itself. A rough indication of the relative unit
costs of some offshore technologies is given in table 7.23 (Fraenkel, 1999).
Several of these options are already competitive in the context of niche
markets, such as island communities using conventional small-scale diesel
generation, which typically can cost from $0.10 to as much as $0.50 a
kilowatt-hour.
Environmental aspects
Offshore environmental impacts for marine energy technologies
tend to be minimal. Few produce pollution while in operation. One exception is
tidal barrages, where the creation of a large human-made seawater lake behind
the barrage has the potential to affect fish and bird breeding and feeding,
siltation, and so on. Another exception is OTEC, which may cause the release of
carbon dioxide from seawater to the atmosphere.
The main issues, however, tend to be conflicts with other users
of the seas - for fishing, marine traffic, and leisure activities. Of these,
fishing is perhaps the main potential area of conflict. None of the technologies
discussed seems likely to cause measurable harm to fish or marine mammals. But
some - such as marine current turbines and wave power devices - may need small
fishery exclusion zones to avoid entanglement with
nets.
Implementation issues
Numerous legal hurdles await developers of offshore technologies
in gaining licenses and permissions from the many marine agencies charged by
governments with overseeing the environment, navigation, fisheries, and so on.
Most of the marine renewable energy technologies are immature and not well
developed, facing difficult engineering problems and higher-than-usual financial
risks due to the high overheadsof running experimental systems at sea. If these
technologies are to develop at a reasonable speed to make a significant
contribution to clean energy generation, they will need much greater support for
RD&D. In the end the power to make marine renewable energy technologies
succeed (or fail) lies largely with
governments.
Conclusion
· Energy is in the
seas in prodigious quantities. The question is whether it can be tapped,
converted to a useful form, and delivered cost-effectively in comparison with
other methods of energy generation. Several technologies show reasonable
prospects for doing so.
· Tidal barrages have been tried
in a limited way and abandoned as uneconomic, largely because they are very
low-head hydro power plants with unusually high civil costs and an unusually
poor load factor.
· Wave energy is beginning to
see success with shoreline systems, but has yet to be effectively demonstrated
on any scale near shore, let alone offshore, where most of the energy is found.
· Marine current energy is only
just starting to be experimented with, but because it involves less technical
risk than wave energy (conditions are less extreme), it promises to develop
relatively quickly.
· OTEC, experimented with
extensively, shows most promise as a multipurpose process (energy with cooling,
nutrients for fish-farms, and/or potable water from seawater). Shoreline OTEC
may possibly be more readily developed and economically applied than devices
floating in deep waters.
· The two remaining known
options - exploiting salinity gradients and cultivating marine biomass - seem a
long way from any practical application.
|
Wave energy remains
at an experimental stage,
with only
a few prototype
systems actually
working. |
System aspects
Rapid changes in the energy sector, liberalisation of energy
markets and the success of new technologies such as the combined cycle gas
turbine offer challenges to the integration of renewable energy technologies
into energy supply systems. They also lead to new issues at the system level.
System aspects come into play when there are many relatively
small energy generation units, both renewable and conventional. The issues
discussed here focus on electricity because of the instant response of
electricity. Few thermal and fuel networks experience these issues because of
their storage capacity.
With the rapid increase in the number of small generators
connected to distribution networks at low and medium voltages, these networks
need to handle more two-way flows of electricity, requiring decentralised
intelligent control systems and local storage systems to increase
reliability.
Trends in the energy sector
The energy sector is undergoing rapid change because of the
following trends:
· World-wide
restructuring of utilities and liberalisation of energy markets.
· Greater choice for large and small
customers.
· Customer interest in green
pricing and the emerging trade in green certificates.
· Technological innovations in efficiency, demand-side
management, transport and distribution, electronic power handling, and
generation.
These trends directly or indirectly affect the electricity
system. Patterson (1999) describes how the global electricityindustry is in
confusion, how long-accepted ground rules for technology, fuels, ownership,
operation, management, and finance are changing by the day. The traditional
shape of the electricity system is based on two pillars: large remote power
stations generating centrally controller synchronised alternate current, and a
monopoly franchise to finance, build, and operate the system.
Technical innovations, such as the gas turbine and advanced
power electronics, are undermining the first pillar. Institutional innovation
and price competition are undermining the second. In effect liberalisation and
new technological development are democratising the system by decentralising it.
And suddenly direct current, favoured by Edison, is discussed again, not least
because it fits rather better into the micro-applications of computer chips and
electronics (FT, 1998).
These trends are also summarised in the concept of the
distributed utility, based on the principle that the economies of scale for
large generation units are replaced by the economies of numbers in producing
large quantities of small units: wind, photovoltaics, fuel cells, internal
combustion engines, small gas turbines, and storage systems (Weinberg, 1995;
Ianucci and others, 1999). The concept involves both energy efficiency and
demand-side management measures at the customers’ end, as well as
distributed generation and distributed storage in the networks. For the customer
it implies, in principle, lower energy prices, new and better services, and new
products. Market studies in the United States indicate that in the traditional
vertically integrated utility, distributed generation and storage could serve 20
- 40 percent of U.S. load growth. If the existing load could be served by
distributed generation through replacement or retirement of central station
generation, the potential is even greater (Ianucci and others,
1999).
Characteristics of renewable energy systems
From a system point of view, a distinction should be made
between intermittent renewable energy sources (wind, solar photovoltaic) and
those with a more stable and controllable output (hydro, biomass). The
intermittent ones deliver primarily energy but only limited capacity, whereas
the more stable ones deliver both. Note, however, that an intermittent resource
can be transformed to baseload power supply if it is combined with an energy
storage system.
Characterising the typical intermittent sources are capacity
factors with values often a third or less of those of conventional systems. (The
capacity factor is defined as the ratio of year-averaged system power to the
rated system power.) In energy output per installed kilowatt, each year
conventional power plants produce 4,000 - 7,000 kilowatt-hours per kilowatt of
installed capacity, wind plants generally produce 2,000 - 2,500, and solar
photovoltaic plants produce 750 - 1,500. The network should be designed to
absorb that peak capacity and to provide electricity reliably when the
intermittent sources are not available.
The renewable sources with an inherently stable output can, from
a system point of view, be treated as conventional units: hydro and
biomass-powered units, as well as OTEC and wave power. Hybrid solar thermal
power stations co-fired with natural gas (or biofuels) are also regarded as
conventional.
Electrical system design
Today’s electrical system is designed for one-way traffic
from the large generating unit through the transmission and distribution network
to the customers. With the advent of smaller generating units distributed
throughout the network, two-way traffic becomes more important and requires a
rethinking of the network’s design. New analytical tools are being
developed for this purpose, and innovations in power electronics are becoming
more important (Verhoeven, 1999). This is true for transmission lines where high
voltage direct current cables (equipped with power electronics at both ends) are
preferred for bulk power transport. For medium-and low-voltage lines, power
electronics are important in voltage conditioning, preventing voltage dips, and
reactive power compensation. The electricity network should become more
flexible, facilitating co-operation between generators, storage, and efficient
energy consuming systems. In short, the intelligent network of the future will
be able to ‘talk’ to its connected systems (Verhoeven, 1999).
|
Most studies confirm that
an intermittent renewable
energy
contribution up to 10-20 percent
can easily be absorbed
in
electricity networks. |
The effect of decentralised systems on the reliability of the
network is of prime concern to the network operators. Studies by KEMA for the
Dutch electricity system indicate that by introducing decentralised generators
and storage systems (close to the customers) the reliability of the network can
increase significantly. Where new grids are to be installed, the grid can become
‘thinner’ and built with less redundancy. And the transmission and
distribution networks can become simpler because of intelligent control systems
(Vaessen, 1997).
Model studies by the Pacific Northwest Laboratory confirm that
distributed utility (DU) generation will have a significant impact on bulk
transmission system stability at heavy penetration levels (Donelly and others,
1996). By locating DU technologies at points of critical loading, utilities may
be able to defer upgrades of transmission and distribution facilities. Many
utilities have already had operating experience with DU generation, and such
local issues such as protection, interaction with distribution automation
schemes, and reactive power control have been successfully resolved. Questions
remain on how these resources, along with dispatchable generation and storage,
interact with each other as their penetration
increases.
Grid integration of intermittent renewables
The amount of intermittent power that can be connected to a grid
without problems of grid reliability or quality depends on many factors. Locally
problems can occur quite soon when feeding substantial intermittent power (more
than 100 kilowatts) into the low-voltage grid at one point. But it has been
shown that penetration as high as 40 percent can be achieved for wind turbines
(feeding into the medium-voltage grid). This is a subject for further
investigation. Most studies confirm that an intermittent renewable energy
contribution up to 10 - 20 percent can easily be absorbed in electricity
networks. Higher penetration rates may require adequate control or such measures
as output limiting or load shedding. Another approach could be to increase the
flexibility of the electricity system by means of gas turbines. Penetration
values up to 50 percent are possible for large systems with reservoir-based
hydropower units (Grubb and Meyer, 1993; Kelly and Weinburg,
1993).
Intermittent renewables and energy storage
Large penetration of intermittent renewable energy technologies
would become much easier with some cheap form of large-scale electricity
storage, than the virtual storage. At present, however, any other form of
electricity storage than the virtual storage offered by conventional plants to
the grid seems unattractive.
In the Netherlands several studies in the 1980s analysed the
possibilities of large pumped storage systems (storage capacity of 10 - 30
gigawatt-hours, discharge capacity of 1,500 - 2,000 megawatts-electric), both
above ground and below ground, based on water or compressed air. Estimated
investment costs ranged from $1,000 to $2,000 million (EZ, 1988). The studies
were initiated partly because of the (then) estimated limited allowable
penetration ratios for wind power into the grid. With the insight that higher
penetration ratios were possible, and because of the high investmentcosts, the
immediate interest in storage evaporated.
Schainker provides estimates for the capital costs of
electricity storage (Schainker, 1997; PCAST, 1999). Compressed air systems
appear to be fairly attractive, both for 2-hour and 20-hour storage options
(table 7.24). In Germany the Huntorf power plant near Bremen, commissioned in
1978, used compressed air as a storage medium for the compression part of the
gas-turbine cycle. With cheap electricity, the air was stored in off-peak hours,
to be used during peak hours as on input to the gas-turbine, co-fired with
natural gas.
As noted, wind-generated electricity can be transformed from an
intermittent resource to a baseload power supply if combined with compressed air
energy storage (CAES), adding probably $0.01 a kilowatt-hour to the wind
electricity production costs (Cavallo,
1995).
Value of renewables
For standalone systems, the value of renewables is often the
value of the service. Examples are lighting, heating, cooling, cooking, pumping,
transportation, and telecommunication. How this value should be evaluated is
determined by the minimum cost of any equivalent alternative energy source or
technology.
For grid-connected electricity systems, the value of renewables
can be defined in different ways: avoided fuel, capacity, and maintenance costs;
avoided electricity consumption costs; buy-back rate; and non-financial benefits
(Turkenburg, 1992).
The avoided fuel costs in the conventional system usually
represent the lowest possible value (typically $0.02 - 0.05 a kilowatt-hour).
Renewables also have a capacity value, though this may be small for intermittent
technologies (Alsema and others, 1983; van Wijk and others, 1992). For solar
energy systems used for peak shaving (such as peaks due to air conditioning) or
grid support, the value of photovoltaic power may be substantially higher than
the value of base-load power.
Avoided costs of electricity consumption refer to the situation
where a renewable energy system is connected to the grid by a bidirectional
kilowatt-hour meter. By definition, the value then becomes equal to the costs
(tariffs) of normal electricity. In many countries this is in the range of $0.10
- 0.25 a kilowatt-hour for small users (IEA PVPS, 1997) In the buy-back rate
method, the value of renewables can be lower or higher than that of energy from
the grid. It is lower if an intermediate rate between avoided fuel costs and
electricity tariffs is used, as is often the case (IEA PVPS, 1997).
It can be higher if a high value is given to the fact that it is
green electricity. In some areas (parts of Germany) buy-back rates are based on
true costs of renewables and may be as high as about $0.5 a kilowatt-hour for
photovoltaics.
Finally, the value of renewables for the owners of a system may
partly be non-financial, such as the mere fact that they cover (part of) their
own consumption in an independent and clean way. Obviously this cannot be easily
expressed in financial
terms.
Conclusion
· Current trends in
the energy sector favour the emergence of distributed utilities, where growing
numbers of relatively small renewable and conventional supply systems can be
integrated, thanks to local intelligent control systems supported by local
storage systems. When properly planned they can even improve the reliability of
the networks, but continued research is required in such areas as network
modelling.
· A fundamental change is taking
place in the way electricity networks will be managed and used in the near
future, thanks to the liberalisation of energy markets and the success of new
technologies such as combined-cycle gas turbines and power electronics. The
energy sector is moving away from the centralised massive supply of
kilowatt-hours into supplying decentralised tailored services to its customers.
· Penetration ratios of
renewable energy systems realised without loss of supply security are around 10
- 20 percent or higher, depending on the characteristics of the total system.
High penetration rates can be achieved with advanced power electronics, steadily
improving weather prediction methods, availability of hydropower plants, and
integration of storage systems.
· The value of energy carriers
produced by renewable sources depends on local circumstances. In practice
figures are $0.02 - 1.00 a kilowatt-hour.
TABLE 7.24. OVERVIEW OF CAPITAL COSTS FOR ELECTRICITY
STORAGE (1997 DOLLARS)
|
Technology |
Component capital cost |
Total capital cost |
|
Discharge capacity (dollars per kilowatt) |
Storage capacity (dollars per kilowatt-hour) |
2-hour storage (dollars per kilowatt) |
20-hour storage (dollars per kilowatt) |
|
Compressed air |
|
|
|
|
|
Large (350 megawatts) |
350 |
1 |
350 |
370 |
|
Small (50 megawatts) |
450 |
2 |
450 |
490 |
|
Above ground (16 megawatts) |
500 |
20 |
540 |
900 |
|
Conventional pumped hydro |
900 |
10 |
920 |
1,100 |
|
Battery (target, 10 megawatts) |
|
|
|
|
|
Lead acid |
120 |
170 |
460 |
3,500 |
|
Advanced |
120 |
100 |
320 |
2,100 |
|
Flywheel (target, 100 megawatts) |
150 |
300 |
750 |
6,200 |
|
Superconducting magnetic storage (target, 100 megawatts)
|
120 |
300 |
720 |
6,100 |
|
Supercapacitors (target) |
120 |
3,600 |
7,300 |
72,000 |
Source: PCAST,
1999.
Policies and instruments
New renewable energy technologies are trying to make a way into
different markets, often in competition with other options to fulfil the demand
for energy services. Contrary to assumptions in the 1970s and 1980s, shortages
of oil and gas due to resource constraints are not expected in the nearest
decades. And coal resources are very large. Increasing fossil fuel prices driven
by resource constraints are not also expected in the nearest decades. So a
transition to renew-ables-based energy systems must largely rely on:
· Successful
continuing development and diffusion of renewable energy technologies that
become increasingly competitive through cost reductions from technological and
organisational development.
· Political will to remove
various barriers to the deployment of renewables and internalise environmental
costs and other externalities that permanently increase fossil fuel
prices.
As many countries have demonstrated, a variety of incentive
mechanisms can promote the development and use of renewable energy sources:
· The cost of
competing conventional energy.
· Financing
and fiscal policy.
· Regulation.
· Getting started new
technologies.
Cost of competing conventional energy
Reduce subsidies. Subsidies for conventional energy are
pervasive and reduce the competitiveness of renewables (chapter 12). They have
often proved to be difficult to remove.
Internalise environmental costs. From a theoretical point
of view, carbon dioxide taxes would be the simplest and most consistent method
for internalising the costs of mitigating climate change. Similarly, taxes can
be used to internalise other environmental costs associated with fossil fuels or
external costs associated with nuclear power. Although the magnitude of the
environmental cost for various energy supply alternatives is debated, they are
relatively lower for renewable energy.
|
The value of renewables for
the owners of a system may
partly be
non financial, as they cover (part of)
their own consumption
in
an independent and
clean way. |
Markets in many cases adapt quite rapidly to substantial changes
in relative prices. Swedish carbon taxes are a case in point. The new energy and
carbon taxes introduced in the early 1990s made bio-energy the least expensive
fuel for heat production. Boilers are relatively flexible regarding fuel choice,
and the market share of bio-energy in district heat production in Sweden
increased from 9 percent (3.6 terawatt-hours) in 1990 to 30 percent (13.7
terawatt-hours) in 1998.
In general, however, this approach has not been particularly
successful. Politically, it is difficult to gain acceptance for the large rise
in energy prices that this approach could entail. At the national policy level,
an important objection is the negative effect on the competitive position of
domestic industries. A system of tradable emission permits or high taxes on
marginal carbon dioxide emissions might circumvent this
problem.
Financing and fiscal policy
Subsidies. Subsidies to stimulate the market penetration
of renewables may be seen as the second-best solution to taxes - that is,
relative prices are manipulated by subsidising what is desirable rather than
taxing what is undesirable. Subsidies can take different shapes: investment
subsidies (which give little incentive to actually produce), production
subsidies (which may be perceived as unreliable and subject to change), and
various indirect subsidies through preferential tax treatment, depreciation
rules, and the like (see below). System benefit charges, such as the fossil fuel
levy, are increasingly popular mechanisms to finance a subsidy for renewable
energy through shifting the economic burden from taxpayers to consumers.
Financing. Financing arrangements are particularly
important to renewable energy projects, which are often capital intensive, with
many factors making their financing more expensive than for more traditional
power investment (Wiser and Pickle, 1997). These factors include real and
perceived project risks, the small size of renewable energy industry and many
renewable energy projects, and dependence on unpredictable government policies
to promote renewable energy.
The right choice of financing schemes (private, corporate,
participation, project, and third party), ownership (single, corporate,
participation, project finance, and third party) and legal entities (personal,
partnership, corporation, and co-operation) can have a decisive impact on the
economic viability of a project (Langniss, 1999). In developing countries,
financing adapted to local needs and tradition - such as through revolving funds
- has proven important in the diffusion of small renewable energy technologies,
such as household photovoltaic systems (Gregory and others, 1997). Coping with
the demand put on financing by the specific characteristics of renewables is an
important challenge for international and other financial institutions.
Taxation. As noted, general and specific tax rules can
work for or against renewable energy. Preferential tax treatment, tax exemption,
accelerated depreciation, and other approaches can promote renewable energy. The
Netherlands, for example, is moving away from using direct subsidies to
supporting renewables through a variety of tax incentives. As for other policies
and measures, tax mechanisms must be carefully designed to avoid undesirable
consequences such as low incentives for project performance, as in the
California wind rush, which also disrupted the Danish wind industrywhen tax
incentives where removed (Wiser and Pickle, 1997). Experiences were similar in
the initial years of wind power development in India (Mathews, 1998a, b).
Market approaches. Increasing consumer willingness to pay
a premium for renewable energy can generate the higher revenues that may be
needed to recover production costs. This approach is spreading fast through the
increased marketing of environmental labelling and green pricing, notably in
North America and Europe. Retail competition and the subsequent need for
suppliers to diversify and become more customer oriented is an important driving
force, an outcome of the commercial impulse to diversify and add value to basic
products. Labelling can be done by a credible independent third party, such as
an non-governmental organisation or government agency. In some cases electricity
suppliers offer production-specified electricity, such as guaranteed annual
average deliveries of wind electricity. The willingness to pay of large
electricity users is likely to be low or nil, and green pricing may result only
in modest additions of renewable energy. It can, however, nurse a market for new
renewable
technologies.
Regulation
The focus of most regulatory approaches to promote renewables
has been the electricity sector. Regulation has also been used to introduce
alternative transportation fuels, notably blending in ethanol with gasoline.
Mechanisms to promote renewables through regulatory approaches can be
categorised as obligations to buy and obligations to supply. Regulation in other
domains can also have an influence.
Obligations to buy. Obligations to buy generally
stipulate under what rules independent power producers get access to the grid
and economic compensation for delivered electricity. This approach is commonly
used in monopoly markets to ensure access for independent power producers with
renewable energy. Regulated access and prices reduce transaction costs. Prices
are usually based on avoided costs to the utility, and the principles by which
these are calculated are important for the outcome. Obligations to buy may be
complicated to maintain in liberalised electricity markets with competition
between suppliers. The obligation to buy under the U.K. Non Fossil Fuel
Obligation has been complemented with a mechanism for reimbursing electricity
companies for the extra cost incurred.
Obligations to supply. Renewable portfolio standards can
be used as an alternative to, or in combination with, system benefit charges to
promote renewable electricity. A renewable portfolio standard imposes an
obligation on all electricity suppliers to include a stipulated fraction of
renewable electricity in their supply mix. This obligation is sometimes combined
with a system for renewable energy credits to facilitate trade of renewable
electricity between suppliers. Renewable portfolio standards are being
implemented or discussed in Europe and in several states in the United States.
Voluntary or negotiated agreements are sometimes used as an alternative to
regulation.
Regulation in other domains. Regulation and policies in
other sectors or domains (agricultural policy, land-use planning), or the lack
thereof, often inflict serious constraints or barriers to the use of renewable
energy. For bio-energy, the prospects generally depend heavily on forestry and
agricultural policy. In temperate regions a prime option for bio-energy is short
rotation forests on agricultural land. But establishing an energy plantation
means committing the land to one use for many years or even decades. In
contrast, agricultural subsidies tend to change frequently, deterring most
farmers from making this commitment.
A lack of regulation can also hinder exploitation. For example,
the exploration and exploitation of such natural resources as minerals or fossil
fuels are usually regulated through legislation and involve selling or giving
concessions. The absence of corresponding regulation for wind concessions, which
would secure the rights to a resource, can be a barrier to commercial
investments in exploration and exploitation (Brennand, 1996). Consequently,
coherence should be sought between regulation in the renewable energy area and
in other
domains.
Getting new technologies started
Widespread diffusion of new renewable energy technology also
depends on a successful chain of research, development, deployment, and cost
reduction before a technology is commercially viable. Once that stage is
reached, success also depends on availability of information about the
resources, technologies, and institutional, organisational, and technical
capabilities to adopt a technology to local conditions. This complex process,
called the energy technology innovation pipeline, includes research,
development, demonstration, buying down the cost of innovative energy
technologies along their learning curves, widespread deployment, and involving
of a range of actors (PCAST, 1999).
Research and development spending and priorities. In many
areas, including the energy sector, the private sector under-invests in RR&D
relative to the public benefits that could be realised from such investments,
motivating public support for energy R&D. There are several examples of how
electricity and gas sector restructuring is resulting in cutbacks on energy
R&D and a shift to projects with short-term commercial benefits (PCAST,
1999). Government spending on energy R&D is collected and reported by the
International Energy Agency for OECD countries (IEA, 1998). Between 1986 and
1996 the total reported annual energy R&D spending decreased by 19 percent,
from about $11.0 billion to about $9.0 billion (1996 prices). But in the same
period spending on energy conservation R&D increased by 64 percent to about
$1.0 billion (1996 dollars) while spending on renewables R&D increased
marginally from $700 million in 1986 to $720 million in 1996.
Demonstration and cost-reduction strategies.
Demonstrations are necessary to test new energy-technology manufacturing (such
as solar photovoltaics or fuel cells) and energy conversion facilities (such as
integrated biomass gasification combined cycle plant) - and to prove their
technical and economic viability. The private sector may find it difficult to
build demonstration plants for various reasons - high capital requirements,
required rates of return, high risk, and difficulties to appropriate the
long-term benefits. Thus, public support is needed when clear public benefits
can be associated with the technology.
In recent years, more attention has been going to the phase
between demonstrations and commercial competitiveness. For essentially all
technologies and production processes, a substantial amount of experience or
learning results from their application, which in turn reduces costs. For
various products and processes a 0 - 30 percent reduction in costs has been
observed with each doubling of cumulative production (Neij, 1999). This
phenomenon - called the experience curve or learning curve - has motivated
private firms to use forward pricing. That is, they initially sell products
below production cost under the expectation that learning effects will drive
down costs and that profits will be generated later. But for renewable energy,
it may be difficult for an individual firm to recover the costs of forward
pricing. Here public financial support in combination with other measures can be
key to success. In the wind industry in Denmark, a combination of subsidies,
physical planning, wind turbine certification, and the like has produced in a
thriving industry with a 50 percent share of the world market (see chapter 12).
|
Increasing consumers'
willingness to pay a premium
for
renewable energy can generate
the higher revenues that may
be
needed to recover
production costs. |
Building capacity for widespread deployment. Although a
technology may be competitive, its widespread deployment also depends on a range
of other factors. A new technology may face a range of barriers to its
widespread application. These include high perceived risk, high transaction and
information costs, uncertainty about resource availability, and low technical
and institutional capabilities to handle this new technology. Taxes, financing,
fiscal policy, legislation, and regulation are important to address such
barriers and have been discussed above.
TABLE 7.25. CURRENT STATUS OF RENEWABLE ENERGY
TECHNOLOGIES
|
Technology |
Increase in installed capacity in past five years (percent
a year) |
Operating capacity, end 1998 |
Capacity factor (percent) |
Energy production 1998 |
Turnkey investment costs (U.S. dollars per kilowatt)
|
Current energy cost of new systems |
Potential future energy cost |
|
Biomass energy |
|
|
|
|
|
|
|
|
Electricity |
» 3 |
40 GWe |
25 - 80 |
160 TWh (e) |
900 - 3,000 |
5 - 15 ¢/kWh |
4 - 10 ¢/kWh |
|
Heata |
» 3 |
> 200 GWth |
25 - 80 |
> 700 TWh (th) |
250 - 750 |
1 - 5 ¢/kWh |
1 - 5 ¢/kWh |
|
Ethanol |
» 3 |
18 bln litres |
|
420 PJ |
|
8 - 25 $/GJ |
6 - 10 $/GJ |
|
Wind electricity |
» 30 |
10 GWe |
20 - 30 |
18 TWh (e) |
1,100 - 1,700 |
5 - 13 ¢/kWh |
3 - 10 ¢/kWh |
|
Solar photovoltaic electricity |
» 30 |
500 MWe |
8 - 20 |
0.5 TWh (e) |
5,000 - 10,000 |
25 - 125 ¢/kWh |
5 or 6 - 25 ¢/kWh |
|
Solar thermal electricity |
» 5 |
400 MWe |
20 - 35 |
1 TWh (e) |
3,000 - 4,000 |
12 - 18 ¢/kWh |
4 - 10 ¢/kWh |
|
Low-temperature solar heat |
» 8 |
18 GWth
(30 mln m2) |
8 - 20 |
14 TWh (th) |
500 - 1,700 |
3 - 20 ¢/kWh |
2 or 3 - 10 ¢/kWh |
|
Hydroelectricity |
|
|
|
|
|
|
|
|
Large |
» 2 |
640 GWe |
35 - 60 |
2,510 TWh (e) |
1,000 - 3,500 |
2-8 ¢/kWh |
2-8 ¢/kWh |
|
Small |
» 3 |
23 GWe |
20 - 70 |
90 TWh (e) |
1,200 - 3,000 |
4 - 10 ¢/kWh |
3 - 10 ¢/kWh |
|
Geothermal energy |
|
|
|
|
|
|
|
|
Electricity |
» 4 |
8 GWe |
45 - 90 |
46 TWh (e) |
800 - 3,000 |
2 - 10 ¢/kWh |
1 or 2 - 8 ¢/kWh |
|
Heat |
» 6 |
11 GWth |
20 - 70 |
40 TWh (th) |
200 - 2,000 |
0.5 - 5 ¢/kWh |
0.5 - 5 ¢/kWh |
|
Marine energy |
|
|
|
|
|
|
|
|
Tidal |
0 |
300 MWe |
20 - 30 |
0.6 TWh (e) |
1,700 - 2,500 |
8 - 15 ¢/kWh |
8 - 15 ¢/kWh |
|
Wave |
- |
exp. phase |
20 - 35 |
- |
1,500 - 3,000 |
8 - 20 ¢/kWh |
- |
|
Current |
- |
exp. phase |
25 - 35 |
- |
2,000 - 3,000 |
8 - 15 ¢/kWh |
5 - 7 ¢/kWh |
|
OTEC |
- |
exp. phase |
70 - 80 |
- |
- |
- |
- |
a. Heat embodied in steam (or hot water in district
heating), often produced by combined heat and power systems using forest
residues, black liquor, or bagasse.
Information and transaction costs can be the target of specific
government initiatives. For example, responsibility for mapping natural
resources should lie with the government. Transaction costs can be reduced by
simplified permitting procedures, physical planning, use of standardised
contracts, and clear regulation for suppliers of electricity and fuels from
renewables. Information costs for new technologies and risk may be effectively
reduced through a government testing and certification procedure. Governments,
as key sponsors of the educational system in most countries, also have an
obligation and an opportunity to support education and continuing education for
practitioners.
Conclusion
Renewable energy sources supply 56 ± 10 exajoules a year
(12 - 16 percent) of total world energy consumption (400 ± 10 exajoules in
1998). The supply is dominated by traditional biomass (probably 38 ± 10
exajoules a year), mostly firewood used for cooking and heating, especially in
developing countries in Africa, Asia, and Latin America. A major contribution is
made by large hydropower (about 9 exajoules a year). Another major contribution,
estimated at 7 exajoules a year, comes from primary biomass used in modern
energy conversion processes. The contribution from all other renew-ables (small
hydropower, geothermal, wind, solar, and marineenergy) is about 2 exajoules a
year.
Of the total biomass energy supply, 16 ± 6 exajoules a year
is estimated to be commercial. The total primary energy supply from renewable
sources in 1998 used commercially can be estimated at 27 ±6 exajoules. It
is estimated that in 1998 new renewable energy sources - modern bio-energy,
small hydropower, geothermal energy, wind energy, solar energy and marine energy
- supplied 9 exajoules (about 2 percent).
The enormous potential of renewable energy sources can meet many
times the world energy demand. They can enhance diversity in energy supply
markets, contribute to long-term sustainable energy supplies, and reduce local
and global atmospheric emissions. They can also provide commercially attractive
options to meet specific needs for energy services, particularly in developing
countries and rural areas, create new employment opportunities, and offer
opportunities to manufacture much of the equipment locally (IEA, 1997). A brief
overview of the many technologies to exploit them is presented in table 7.25.
A number of factors will have to be overcome to increase the
market deployment of renewable energy technologies (IEA, 1997). Many
technologies are still at an early stage of development. Their technological
maturity will demand continuing research, development, and demonstration. Few
renewable energy technologies can compete with conventional fuels on a strict
cost basis, except in some niche markets in industrialised countries and in
non-grid applications in developing countries. Clearly, the cost of production
has to come down. As this chapter shows, substantial cost reductions can be
achieved for most technologies, closing gaps and making renewables increasingly
competitive (see table 7.25). This requires further technology development and
market deployments and an increase in production capacities to mass-production
levels.
Scenario studies investigating the potential contribution of
renewables to global energy supplies indicate that this contribution might range
from nearly 20 percent to more than 50 percent in the second half of the 21st
century. We conclude that it is unclear what role renewables will play. Much
will depend on the development of fossil-fuel energy supplies and the regulatory
environment, especially for greenhouse gases (Eliasson, 1998). Contrary to
assumptions in the 1970s and 1980s, shortages of oil and gas due to resource
constraints are not expected in the nearest decades, and coal resources are very
large. Therefore, apart from production and distribution constraints,
substantially increasing fossil fuel prices driven by resource constraints are
not expected in the nearest decades. In addition, advanced technology
developments might allow fossil fuel use with greatly reduced atmospheric
emissions (see chapter 8).
A transition to renewables-based energy systems would have to
rely largely on successful development and diffusion of renewable energy
technologies that become increasingly competitive through cost reductions
resulting from technological and organisational development - and on the
political will to internalise environmental costs and other externalities that
permanently increase fossil fuel prices. Different technologies vary widely in
their technological maturity, commercial status, integration aspects, and so on.
Policies aimed at accelerating renewable energy must be sensitive to these
differences. As renewable energy activities grow and ever more extensive funding
is required, many countries are moving away from methods that let taxpayers
carry the burden of promoting renew-ables, towards economic and regulatory
methods that let energy consumers carry the burden.
Notes
1. The capacity of a photovoltaic cell, module, or system is
defined as the generating capacity at an irradiance of 1,000 watts a square
metre (spectrum AM 1.5) and a cell temperature of 25 degrees Celsius.
2. This figure is obtained by comparing the 1989 installed
potential of the 70 developing countries (185 gigawatts) from Moore and Smith
(1990) and the value for 1997 (225 gigawatts) obtained from table 7.18.
References
Alsema, E.A., A.J.M. van Wijk, and W.C. Turkenburg. 1983.
“The Capacity Credit of Grid-Connected Photovoltaic Systems.” In
Proceedings of the 5th EC PV Solar Energy Conference. Reidel, Dordrecht,
Netherlands.
Alsema, E.A., and E. Nieuwlaar, eds. 1998. “Environmental
Aspects of PV Power Systems”: Progress in Photovoltaics - Research and
Applications. Vol. 6, no 2.
Alsema, E.A., P. Frankl, and K. Kato. 1998. “Energy
Pay-back Time of Photovoltaic Energy Systems: Present Status and
Prospects.” In J. Schmid and others, eds., Proceedings of the Second
World Conference and Exhibition on PV Solar Energy Conversion. Report EUR
18656 EN. Brussels.
Andersson, B.A. 1998. “Materials, Availability, and Waste
Streams for Large Scale PV.” In Proceedings of the BNL/NREL Workshop on
PV and the Environment. Keystone, Colo.
Aryawijaya, R. 1997. “Government Regulations on Geothermal
Development and Environmental Protection in Indonesia.” In Proceedings
of the NEDO International Geothermal Symposium. Sendai, Japan.
Bacon, R.W., J.E. Besant-Jones, and J. Heidarian. 1996.
Estimating Construction Costs and Schedules - Experience with Power
Generation Projects in Developing Countries. World Bank Technical Paper 325,
Energy Series. Washington, D.C.
Benito, F.A. 1998. “The Role of Government in Philippine
Geothermal Energy Development.” Paper presented at the 20th Anniversary
Geothermal Workshop of the United Nations University Geothermal Training
Programme, Reykjavik, Iceland.
Besant-Jones, J. 1995. “Attracting Finance for
Hydroelectric Power.” Finance, Private Sector, and Development Energy Note
3. World Bank, Washington, D.C.
Beurskens, H.J.M. 2000. “Offshore Wind Turbine Systems in
Europe.” Paper presented to the Workshop Technische Machbarkeit der
Windenergienutzung im Offshore der Nordsee, Kiel, Germany.
Beyea, J., J. Cook, D. Hall, R. Socolow, and R. Williams. 1991.
Towards Ecological Guidelines for Large-scale Biomass Energy Development:
Executive Summary. National Aubudon Society, Princeton University, N.J.
Bj�rnsson, J., I.B. Fridleifsson, T. Helgason, H. Jonatansson,
J.M. Mariusson, G. Palmason, V. Stefansson, and L. Thorsteinsson. 1998.
“The Potential Role of Geothermal Energy and Hydro Power in the World
Energy Scenario in Year 2020.” In Proceedings of the 17th WEC Congress.
Houston, Tex.
B�er, K.W., ed. 1998. Advances in Solar Energy. Vol. 12.
Boulder, Colo.: American Solar Energy Society.
Bohland, J., T. Dapkus, K. Kamm, and K. Smigielski. 1998.
“Photovoltaics as Hazardous Materials; the Recycling Solution.” In J.
Schmid, and others, eds., Proceedings of the Second World Conference and
Exhibition on PV Solar Energy Conversion. Report EUR 18656 EN. Brussels.
Borjesson, P. 1999. “Environmental Effects of Energy Crop
cultivation in Sweden - I: Identification and Quantification, and II: Economic
Evaluation.” Biomass and Bioenergy 16 (2): 137 - 70.
Bouma, J. 1999. “Heat Pump Market in Europe.” In
Proceedings 6th IEA Heat Pump Conference. Berlin.
Boyle, G., ed. 1996. Renewable Energy: Power for a
Sustainable Future. Oxford: Oxford University Press.
Brennand, T. 1996. “Concessions for Wind Farms: A New
Approach to Wind Energy Development.” Report prepared for Council for
International Co-operation on Environment and Development, Working Group on
Energy Strategies and Technologies, Beijing.
Bridgewater, A.V. 1998. “The Status of Fast Pyrolysis of
Biomass in Europe.” In Proceedings of the 10th European Biomass
Conference and Technology Exhibition. Wurzburg, Germany.
Briscoe, J. 1998. “The Financing of Hydropower, Irrigation
and Water Supply Infrastructure in Developing Countries.” Paper prepared
for the United Nations Commission on Sustainable Development, New York.
Brouwer, L.C., and L. Bosselaar. 1999. “Policy for
Stimulating Passive Solar Energy in the Netherlands.” In Proceedings of
the Northsun 1999 Conference. Edmonton, Canada.
Brown, L.R., J. Abramovitz, C. Bright, C. Flavin, G. Gardner, H.
Kane, A. Platt, S. Postel, D. Roodman, A. Sachs, and L. Starke. 1996. State
of the World: A World Watch Institute Report on Progress toward a Sustainable
Society. New York: World Watch Institute.
Bruton, T.M., and others. 1997. “A Study of the Manufacture
at 500 MWp p.a. of Crystalline Silicon Photovoltaic Modules. In Proceedings
of the 14th European PV Solar Energy Conference. Bedford, United Kingdom:
H.S. Stephens & Ass.
BTM Consult. 1999: International Wind Energy Development:
World Market Update 1998. Denmark.
BTM Consult. 2000. Personal communication. 15 February. Denmark.
Buck, R., E. Lupert, and F. Teelez. 2000. Proceedings of the
10th SolarPACES International Symposium of Solar Thermal Concentrating
Technologies, Solar Thermal 2000. March 8 - 10, Sydney.
Burbidge, D., D. Mills, and G. Morrison. 2000. “Stanwell
Solar Thermal Power Project.” In Proceedings of the 10th SolarPACES
International Symposium of Solar Thermal Concentrating Technologies, Solar
Thermal 2000. March 8 - 10, Sydney.
Carlson, D.E., and S. Wagner. 1993. “Amorphous Silicon
Photovoltaic Systems.” In T.B. Johansson, H. Kelly, A.K.N. Reddy, R.H.
Wiliams, and L. Burnham, Renewable Energy: Sources for Fuels and Electricity.
Washington, D.C.: Island Press.
Carpentieri, E., E. Larson, and J. Woods. 1993. “Future
Biomass-based Power Generation in North-East Brazil.” Biomass and
Bioenergy 4 (3): 149 - 73.
Cavallo, A.J. 1995. “High-Capacity Factor Wind Energy
Systems.” Journal of Solar Energy Engineering 117: 137 - 43.
Churchill, A. A. 1994. “Meeting Hydro’s Financing and
Development Challenges.” Hydro Review World Wide 2 (3): 22.
Churchill, A. A. 1997. “Meeting Hydro’s Financing and
Development Challenges.” In T. Dorcey, ed., Proceedings of the Workshop
Large Dams: Learning from the Past, Looking at the Future. IUCN, World
Conservation Union, and World Bank Group; Gland, Switzerland; Cambridge, United
Kingdom; and Washington, D.C.
Consonni, S. and E.D. Larson. 1994a.
“Biomass-gasifier/Aeroderivative Gas Turbine Combined Cycles, Part A:
Technologies and Performance Modelling.” Part B: Performance calculations
and economic assessment.” Paper prepared for the Eighth Congress and
Exposition on Gas Turbines in Cogeneration and Utility, Industrial, and
Independent Power Generation, October 25 - 27, Portland, Or.
Consonni, S. and E.D. Larson. 1994b.
“Biomass-gasifer/Aeroderivative Gas Turbine Combined Cycles. Part B:
Performance Calculations and Economic Assessment”. Paper prepared for the
Eighth Congress and Exposition on Gas Turbines in Cogeneration and Utility,
Industrial, and Independent Power Generation, October 25 - 27, Portland, Or.
Dannemand Andersen, P. 1998. Wind Power in Denmark:
Technology, Policies and Results. Roskilde, Denmark: Riso National
Laboratory.
Davis, E. 1995. “Device Developed for Bird
Protection.” EPRI Journal March/April.
Donelly, M.K., J.E. Dagle, and D.J. Trudnowski. 1996.
“Impacts of Distributed Utility on Transmission System Stability.”
IEEE Transactions on Power Systems 11 (2): 741 - 46.
Dyson, T. 1996. “Population and Food, Global Trends and
Future Prospects.” Global Environmental Change Programme, New York.
EC (European Commission). 1997. “Community Strategy and
Action Plan for Renewable Energy Sources.” White Paper, Brussels.
EC (European Commission). 1999. “Electricity from Renewable
Energy Sources and the International Electricity Market.” Working Paper,
Brussels.
ECN (Energieonderzoek Centrum Nederland) 1999a. Data Collected
for the Shell/Novem/ECN Solar Panel. Personal communication with C.J.J. Tool,
Netherlands Energy Research Foundation, Petten, Netherlands.
ECN (Energieonderzoek Centrum Nederland) 1999b. The Role of
Renewable Energy in the Netherlands until 2020 (in Dutch). Netherlands
Energy Research Foundation, Petten, Netherlands.
Eliasson, B. 1998. Renewable Energy: Status and Prospects.
V�xj�, Sweden: ABB Environmental Affairs.
Elliott, P., and R. Booth. 1993. Brazilian Biomass Power
Demonstration Project. London: Shell International.
Enermodal. 1999. “Cost Reduction Study for Solar Thermal
Power Plants.” Paper prepared for World Bank. Enermodal Engineering,
Ontario. [www.eren.doe.gov/sunlab/Frame4.htm].
EPIA and Altener. 1996. Photovoltaics in 2010. Brussels:
Office for Official Publications of the European Commission.
ESIF (European Solar Industry Federation) 1996. Sun in
Action. Brussels: European Commission.
ETSU (Eldergy Technology Support Unit) and DTI (Department of
Trade and Industry) 1999. New and Renewable Energy: Prospects in the UK for
the 21st Century - Supporting Analysis. Harwell.
EUREC Agency. 1996. The Future for Renewable Energy:
Prospects and Directions. London: James & James.
EZ (Ministerie van Economische Zaken) 1988. Storage of
Electricity in the Netherlands: Feasible and Acceptable? (in Dutch). The
Hague: Netherlands Ministry of Economic Affairs.
Faaij, A., B. Meuleman, and R. van Ree. 1998. “Long-Term
Perspectives of BIG/CC Technology, Performance and Costs.” Utrecht
University, Deptartment of Science, Technology and Society, and Netherlands
Energy Research Foundation, Petten, Netherlands.
Faaij, A., B. Meuleman, W. Turkenburg, A. van Wijk, A. Bauen, F.
Rosillo-Calle, and D. Hall. 1998. “Externalities of Biomass Based
Electricity Production Compared to Power Generation from Coal in the
Netherlands.” Biomass and Bioenergy 14 (2): 125 - 47.
Faaij, A., C. Hamelinck, and A.E. Agterberg. Forthcoming.
Long-term Perspectives for Production of Fuels from Biomass: Integrated
Assessment and RD&D Priorities.
Faaij, A., C. Hamelinck, E. Larson, and T. Kreutz. 1999.
“Production of Methanol and Hydrogen from Biomass via Advanced Conversion
Concepts.” In R.P. Overend and E. Chornet, eds., Proceedings of the 4th
Biomass Conference of the Americas. Oxford: Elsevier Science.
Faaij, A., M. Hekkert, E. Worrell, and A. van Wijk. 1998.
“Optimization of the Final Waste Treatment System in the Netherlands.”
Resources, Conservation and Recycling 22: 47 - 82.
Faaij, A., R. van Ree, L. Waldheim, E. Olsson, A. Oudhuis, A.
van Wijk, C. Daey Ouwens, and W. Turkenburg. 1997. “Gasification of Biomass
Wastes and Residues for Electricity Production.” Biomass and Bioenergy
12 (6): 387 - 407.
Fisch, M.N. 1998. “A Review of Large-Scale Solar Heating
Systems in Europe.” Solar Energy 63 (6): 355 - 66.
Fraenkel, P.L. 1999. “New Developments in Tidal and
Wavepower Technologies.” In Proceedings of the Silver Jubilee
Conference: Towards a Renewable Future. Conference C73 of the Solar Energy
Society, May 13 - 15, Brighton, U.K.
Fridleifsson, I.B., and Freeston, D. 1994. “Geothermal
Energy Research and Development.” Geothermics 23: 175 - 214.
FT (Financial Times). 1998. “Transforming
Electricity.”Financial Times Energy World. 11: 4 - 8.
Gardner, G. 1996. “Shrinking Fields: Cropland Loss in a
World of Eight Billion.” World Watch Paper 131. New York.
Garg, S. 2000. “Manthania Integrated Combined Cycle Project
(status note on the 140MW first ISCC project).” In Proceedings of the
10th SolarPACES International Symposium of Solar Thermal Concentrating
Technologies, Solar Thermal 2000. March 8 - 10, Sydney.
Garozzo, M, and S. Li Causi. 1998. “The Italian 10,000
Rooftops Program.” In J. Schmid and others, eds., Proceedings of the
Second World Conference and Exhibition on PV Solar Energy Conversion. Report
EUR 18656 EN. Brussels.
Glaser, P.E., and others. 1997. Solar Power Satellites: A
Space Energy System for Earth. Chichester, UK: John Wiley and Sons.
Goodland, R. 1997. “Environmental Sustainability in the
Hydro Industry: Disaggregating the Debate.” In T. Dorcey, ed.,
Proceedings of the Workshop on ‘Large Dams: Learning from the Past,
Looking in the Future.’ IUCN, World Conservation Union, and World Bank
Group; Gland, Switzerland; Cambridge, United Kingdom; and Washington, D.C.
Graham, R. E. Lichtenberg, V. Roningen, H. Shapouri, and M.
Walsh. 1995. “The Economics of Biomass Production in the United
States.” In Proceedings of the Second Biomass Conference of the
Americas. Portland, Or.
Green, M.A., K. Emery, K. B�cher, D.L. King, and S. Igaru. 1999.
“Solar Cell Efficiency Tables (Version 13).” Progress in
Photovoltaics: Research and Applications 7: 31 - 37.
Greenpeace and SEI (Stockholm Environment Institute). 1993.
Towards a Fossil Free Energy Future. Boston: SEI.
Gregory, J., S. Silveira, A. Derrick, P. Cowley, C. Allinson,
and O. Paish. 1997 Financing Renewable Energy Projects, a Guide for
Development Workers. London: Intermediate Technology Publications.
Grubb, M.J., and N.I. Meyer. 1993. “Wind Energy: Resources,
Systems and Regional Strategies.” In T.B. Johansson, H. Kelly, A.K.N.
Reddy, R.H. Wiliams, and L. Burnham, Renewable Energy: Sources for Fuels and
Electricity. Washington, D.C.: Island Press.
Hall, D.O. 1997. “Biomass Energy in Industrialized
Countries: A View of the Future.” Forest Ecology and Management 91:
17 - 45.
Hall, D.O., F. Rosillo-Calle, R.H. Williams, and J. Woods. 1993.
Biomass for Energy: Supply Prospects. In Johansson, T.B, H. Kelly, A.K.N. Reddy,
R.H. Wiliams, and L. Burnham, Renewable Energy: Sources for Fuels and
Electricity. Washington, D.C.: Island Press.
Hastings, S.R., ed. 1994. Passive Solar Commercial and
Institutional Buildings. New York: Wiley and sons.
Hemstock, S.L., and D.O. Hall. 1995. “Biomass Energy Flows
in Zimbabwe.” Biomass and Bioenergy 8 (3): 151 - 73.
Henning, H.M. 1999. “Economic Study of Solar Assisted
Cooling Systems.” Bericht TOS1-HMH-9905-E01, Fraunhofer Institute ISE,
Freiburg, Germany.
Hughes, E.E., and G.A. Wiltsee. 1995. “Comparative
Evaluation of Fuel Costs from Energy Crops.” In Proceedings of the
Second Biomass Conference of the Americas. Portland, Or.
Ianucci, J., S. Horgan, J. Eyer, and L. Cibulka. 1999.
“Distributed Utility Perspectives.” White Paper prepared for the
International Energy Agency Renewable Energy Working Party, DU Associates,
Livermore, Ca.
IEA (International Energy Agency). 1994. Biofuels. Energy
and Environment Policy Analysis Series, Organisation for Economic Co-operation
and Development and IEA, Paris, France.
IEA (International Energy Agency). 1995. World Energy
Outlook. Paris: IEA and Organisation for Economic Co-operation and
Development.
IEA (International Energy Agency). 1996. World Energy
Outlook. Paris: IEA and Organisation for Economic Co-operation and
Development.
IEA (International Energy Agency). 1997. Key Issues in
Developing Renewables. Paris: IEA and Organisation for Economic Co-operation
and Development.
IEA (International Energy Agency). 1998. Energy Policies of
IEA Countries, 1998 Review. Paris.
IEA (International Energy Agency). 1998. Proceedings of the
Conference on Biomass Energy: Data, Analysis and Trends. March 23 - 24,
Paris.
IEA (International Energy Agency), CADDET Centre for Renewable
Energy. 1998. Opportunities for Large - scale Purchase of Active Solar
Systems. ETSU, Harwell, U.K.
IEA (International Energy Agency), PVPS (Photovoltaic Power
Systems). 1997. Photovoltaic Power Systems in Selected IEA Member Countries.
Paris.
IEA (International Energy Agency), PVPS (Photovoltaic Power
Systems). 1998. Trends in PV Power Applications in Selected IEA Countries
between 1992 and 1997. Report IEA PVPS 1 - 06. Paris.
IEA (International Energy Agency), REWP (Renewable Energy
Working Party). 1999. The Evolving Renewable Energy Market. Netherlands:
Novem, Sittard.
IGA (International Geothermal Association). 1999.
[https://www.demon.co.uk/geosci/igahome.html].
IIASA (International Institute for Applied Systems Analysis) and
WEC (World Energy Council). 1998. Global Energy Perspectives. Cambridge:
Cambridge University Press.
Ishitani, H., and T.B. Johansson, eds. 1996. “Energy Supply
Mitigation Options.” In R.T. Watson and others, eds., Climate Change
1995: Impacts, Adaptations and Mitigation of Climate Change:
Scientific-Technical Analyses. Intergovernmental Panel on Climate Change.
Cambridge: Cambridge University Press.
IT Power Ltd. 1996. “The Exploitation of Tidal Marine
Currents.” Tecnomare SpA, Report EUR 16683 EN. European Communities, Office
for Official Publications, Luxembourg.
Jager, D. de, A. Faaij, and W.P. Troelstra. 1998.
Cost-effectiveness of Transportation Fuels from Biomass. ECOFYS. Utrecht
University, Department of Science, Technology and Society, Innas B.V, Delft.
Johansson, T. B., H. Kelly, A. K. N. Reddy, and R. Williams.
1993a. “Renewable Fuels and Electricity for a Growing World
Economy: Defining and Achieving the Potential.” In T. B. Johansson, H.
Kelly, A.K.N. Reddy, R.H. Wiliams, and L. Burnham, Renewable Energy: Sources
for Fuels and Electricity. Washington, D.C.: Island Press.
Johansson, T.B, H. Kelly, A.K.N. Reddy, R.H. Wiliams, and L.
Burnham, eds. 1993b. Renewable Energy: Sources for Fuels and Electricity.
Washington, D.C.: Island Press.
Kaltschmitt, M., C. Rosch, and L. Dinkelbach, eds. 1998.
“Biomass Gasification in Europe.” Stuttgart University, Institute of
Energy Economics and the Rational Use of Energy, Stuttgart, Germany.
Kaltschmitt, M., G.A. Reinhardt, and T. Stelzer. 1996. “LCA
of Biofuels under Different Environmental Aspects.” Stuttgart University,
Institut f�r Energiewirtschaft und Rationelle Energieanwendung, Stuttgart,
Germany.
Kassler, P. 1994. “Energy for Development.” Shell
Selected Paper. Shell International Petroleum Company, London.
Kelly, H., and C. Weinberg. 1993. “Utility Strategies for
Using Renewables.” In T. B. Johansson, H. Kelly, A.K.N. Reddy, R.H.
Wiliams, and L. Burnham, Renewable Energy: Sources for Fuels and Electricity.
Washington, D.C.: Island Press.
Koch, A., 1996: “Playing the Electricity Market.”
International Water Power and Dam Construction Yearbook. Sutton, Surrey,
England: British Press International.
Kolb, G.J. 1998. “Economic Evaluation of Solar-only and
Hybrid Power Towers Using Molten-salt Technology.” Solar Energy 62
(1): 51 - 61.
Langniss, O., ed. 1999. “Financing Renewable Energy
Systems.” Report to the European Commission, German Aerospace Center,
Stuttgart, Germany.
Larson, E.D., and H. Jin. 1999a. “Biomass Conversion to
Fisher-Tropsch Liquids: Preliminary Energy Balances.” In R.P. Overend and
E. Chornet, eds., Proceedings of the 4th Biomass Conference of the Americas.
Oxford: Elsevier Science.
Larson, E.D., and H. Jin. 1999b. “A Preliminary Assessment
of Biomass Conversion to Fischer-Tropsch Cooking Fuels for Rural China.” In
R.P. Overend and E. Chornet, eds., Proceedings of the 4th Biomass Conference
of the Americas. Oxford: Elsevier Science.
Larson, E.D., C.I. Marrison, and R.H. Williams. 1995.
“Mitigation Potential of Biomass Energy Plantations in Developing
Regions.” Princeton University, Center for Energy and Environmental
Studies, Princeton, N.J.
Larson, E.D., R.H. Williams, and T.B. Johansson. 1999.
“Future Demands on Forests as a Source of Energy.” Princeton
University, Center for Energy and Environmental Studies, Princeton, N.J.; and
United Nations Development Programme, New York.
Larson, E.D., S. Consonni, and T. Kreutz. 1998.
“Preliminary Economics of Black Liquor Gasifier/Gas Turbine Cogeneration at
Pulp and Paper Mills.” Paper prepared for the 43rd ASME gas turbine and
aeroengine congress, exposition, and users symposium, June 2 - 5, Stockholm.
Laue, H.J. 1999. “Heat Pumps, Status and Trends in
Europe.” In Proceedings 6th IEA Heat Pump Conference. Berlin.
Lazarus, M.L., L. Greber, J. Hall, C. Bartels, S. Bernow, E.
Hansen, P. Raskin, and D. von Hippel. 1993. “Towards a Fossil Free Energy
Future, The Next Energy Transitions: A Technical Analysis for Greenpeace
International.” Stockholm Environmental Institute and Boston Center.
Lefevre T., J. Todoc, and G. Timilsina. 1997. “The Role of
Wood Energy in Asia; Wood Energy Today and Tomorrow (WETT).” Regional
Studies, FAO-working paper FOPW/97/2. Food and Agriculture Organization of the
United Nations, Rome.
Lenzen, M. 1999. “Greenhouse Gas Analysis of Solar-thermal
Electricity Generation.” Solar Energy 65 (6): 353 - 68..
Lew, D., R.H. Williams, S. Xie, and S. Zhang. 1998.
“Large-Scale Baseload Wind Power in China.” Natural Resources Forum
22 (3): 165 - 84.
Little, R.G., and M.J. Nowlan. 1997. “Crystalline Silicon
Photovoltaics: The Hurdle for Thin Films.” Progress in Photovoltaics:
Research and Applications 5: 309 - 15.
Luchi, M. 1998. “An Empirical Analysis of Consumer Decision
Making Processes on Setting up Residential PV Systems.” In J. Schmid and
others, eds., Proceedings of the Second World Conference and Exhibition on PV
Solar Energy Conversion. Report EUR 18656 EN. Brussels.
Lund, J.W. 1996. “Lectures on Direct Utilization of
Geothermal Energy.” Report 1996 - 1. United Nations University, Geothermal
Training Programme, Reykjavik, Iceland.
Luyten, J.C. 1995. “Sustainable World Food Production and
Environment.” Research Institute for Agrobiology and Soil Fertility, Report
37. Agricultural Research Department, Wageningen, Netherlands.
Luzzi, A. 2000. “Showcase Project: 2 MW Demonstration Sole
Thermal Power Plant.” In Proceedings of the 10th SolarPACES
International Symposium of Solar Thermal Concentrating Technologies, Solar
Thermal 2000. March 8 - 10, Sydney.
Lynd, L.R. 1996. “Overview and Evaluation of Fuel Ethanol
from Lignocellulosic Biomass: Technology, Economics, the Environment and
Policy.” Annual Review of Energy and the Environment 21: 403 - 65.
Mankins, J.C. 1998. “Power from Space: A Major New Energy
Option?” Paper 4.1.16. Presented at the Proceedings of the 17th Congress of
the World Energy Council. Houston, Tex.
Marrison, C.I., and E.D. Larson. 1995a. “Cost versus Scale
for Advanced Plantation-based Biomass Energy Systems in the US.” In
Proceedings of the EOA Symposium on Greenhouse Gas Emissions and Mitigation
Research. June 27 - 29, Washington, D.C.
Marrison, C.I., and E.D. Larson. 1995b. “A Preliminary
Estimate for the Biomass Energy Production Potential in Africa for 2025.”
Biomass and Bioenergy 10 (5 - 6): 337 - 51.
Mathews, N. 1998a. “Changes for the Better on the
Way.” Wind Power Monthly 14 (5): 26 - 27.
Mathews, N. 1998a. 1998b. “Tax Evasion Scam Linked to
Wind.” Wind Power Monthly 14 (3): 26.
Matthies, H.G. and others. 1995. Study of Offshore Wind
Energy in the EC. Brekendorf, Germany: Verlag Nat�rliche Energien.
Maycock, P.D. 1998. Photovoltaic Technology, Performance,
Cost and Market Forecast: 1975 - 2010, Version 7. Warrenton, Va.:
Photovoltaic Energy Systems.
Meuleman, B., and A. Faaij. 1999. Overview of Co-combustion
Options for Coal Fired Power Plants. Utrecht University, Deptartment of
Science, Technology and Society, Netherlands.
Mills, D., and G. Morrison. 2000a. “Compact Linear Fresnel
Reflector Solar Thermal Power Plants.” Source 68 (3): 263 - 83.
Mills, D., and G. Morrison. 2000b. “Stanwell Solar Thermal
Power Project.”
MNCES (Ministry of Non-Conventional Energy Sources). 1999.
Annual Report 1990 - 2000. Government of India.
Moore, E. A., and G. Smith. 1990. “Capital Expenditures for
Electric Power in Developing Countries in the 1990s.” Energy Series Paper,
no. 21. World Bank, Washington, D.C.
Moore, T. 2000. “Renewed Interest for Space Solar
Power.” EPRI Journal (spring): 7 - 17.
Moreira, J. R., and A. D. Poole. 1993. “Hydropower and Its
Constraints.” In T. B. Johansson, H. Kelly, A.K.N. Reddy, R.H. Wiliams, and
L. Burnham, Renewable Energy: Sources for Fuels and Electricity.
Washington, D.C.: Island Press.
Morrison, G.L. 1999. “Packaged Solar Water Heating
Technology, Twenty Years of Progress.” In Proceedings of the Solar World
Congress. Jerusalem.
Naber, J.E., F. Goudriaan, and A.S. Louter. 1997. “Further
Development and Commercialisation of the Small Hydro-thermal Upgrading Process
for Biomass Liquefaction.” In Proceedings of the Third Biomass
Conference of the Americas. Montreal.
National Laboratory. 1997. “Technology Opportunities to
Reduce U.S. Greenhouse Gas Emissions - Appendix B - Technology Pathways
Characteristics.” Prepared for the U.S. Department of Energy
[https://www.ornl.gov/climatechange].
Neij, L. 1999. “Dynamics of Energy Systems, Methods of
Analysing Technology Change.” Ph.D. diss., Lund University, Lund Institute
of Technology, Sweden.
Nishimura, T. 1999. “Heat Pumps: Status and Trends in Asia
and the Pacific.” In Proceedings of the 6th Heat Pump Conference.
Berlin.
NREL (National Renewable Energy Laboratory). 1999.
[https://www.nrel. gov/otec].
NUTEK. 1996. Energy in Sweden 1995. Stockholm.
Oonk, H., J. Vis, E. Worrell, A. Faaij, and J.W. Bode. 1997.
“The Methahydro Process: Preliminary Design and Cost Evaluation.” TNO
Report R 97/214. TNO Institute of Environmental Sciences, Energy Research and
Process Innovation, Apeldoorn, Netherlands.
Osuna, R., V. Fernandez, M. Romero, and M. Blanco. 2000.
“PS 10: A 10 Solar Power Evaluation Program.” In Proceedings of the
10th SolarPACES International Symposium of Solar Thermal Concentrating
Technologies, Solar Thermal 2000. March 8 - 10, Sydney.
Oud, E., and T.C. Muir. 1997. “Engineering and Economic
Aspects of Planning, Design, Construction and Operation of Large Dam
Projects.” In T. Dorcey, ed., Proceedings of the Workshop on ‘Large
Dams: Learning from the Past, Looking at the Future.’ IUCN, World
Conservation Union, and World Bank Group; Gland, Switzerland; Cambridge, U.K.
and Washington, D.C.
Pacheco, J., H. Reily, G. Kolb, and C. Tyner. 2000.
“Summary of the Solar Two Test and Evaluation Program.” In
Proceedings of the 10th SolarPACES International Symposium of Solar Thermal
Concentrating Technologies, Solar Thermal 2000. March 8 - 10, Sydney.
Patterson, W. 1999. Transforming Electricity: The Coming
Generation of Change. Royal Institute of International Affairs. London:
Earthscan.
PCAST (President’s Committee of Advisors on Science and
Technology). 1997. “Report to the President on Federal Energy Research and
Development for the Challenges of the Twenty-first Century.” Executive
Office of the President of the United States, Panel on Energy Research and
Development, Washington, D.C.
PCAST (President’s Committee of Advisors on Science and
Technology). 1999. Powerful Partnerships: The Federal Role in International
Cooperation on Energy Innovation. Executive Office of the President of the
United States, Panel on International Cooperation in Energy Research,
Development, Demonstration and Deployment, Washington, D.C.
Photon. 1999a. “The End of a Dream.” Photon 1 -
99: 20 - 21.
Photon. 1999a. 1999b. “World Ideas for PV Financing.”
Photon 1 - 99: 16 - 19.
Pikington. 1996. Status Report on Solar Thermal Power Plants.
Cologne: Pikington Solar International.
Pratsch, L.W. 1996. “Geothermal, a Household Word by the
Year 2000.” GRC Bulletin 25: 25 - 31.
PVIR (Photovoltaic Insider’s Report). 1999. Photovoltaic
Insider’s Report. 18 (2): 6.
Radja, V. 1997. “Strategy for Geothermal Energy Development
in Indonesia Facing the Year 2000.” In Proceedings of NEDO International
Geothermal Symposium. Japan.
Randlov and others. 1994. “Final Report for JOULE Wave
Energy Preliminary Actions.” CEC DGXII, Brussels.
Rannels, J.E. 1998. Implementation and Financing for President
Clinton’s Million Solar Roofs Initiative. In J. Schmid and others, eds.,
Proceedings of the Second World Conference and Exhibition on PV Solar Energy
Conversion. Report EUR 18656 EN. Brussels.
Ravindranath, N.H., and D.O. Hall. 1995. Biomass, Energy and
Environment: A Developing Country Perspective from India. Oxford: Oxford
University Press.
Rijk, P. 1994. The Costs and Benefits of Willow
(Salix) in Short Rotation for Niche Energy Markets in The
Netherlands. Agricultural Economics Institute (LEI-DLO), The Hague.
Rosillo-Calle, F., and L.A.B. Cortez. 1998. “Towards
Pro-Alcool II: A Review of the Brazilian Bioethanol Programme.” Biomass
and Bioenergy 14 (2): 115 - 24.
Rosillo-Calle, F., M.A.A. de Rezende, P. Furtado, and D.O. Hall.
1996. The Charcoal Dilemma: Finding a Sustainable Solution for Brazilian
Industry. Biomass Users Network. London: Intermediate Technology.
Rybach, L., and H.L. Goran. 1995. “Swiss Geothermal Energy
Update.” In Proceedings the World Geothermal Congress 1995.
Sastry, E.V.R. 1999. Personal communication. Ministry of
NonConventional Energy Sources, Government of India.
Schainker, R.B. 1997 “Presentation to the PCAST Energy
R&D Panel.” Electric Power Research Institute, July 14. Palo Alto, Ca.
SERI (Solar Energy Research Institute). 1989. Ocean Thermal
Energy Conversion: An Overview. SERI/SP-220-3024. Golden, Colo.
Shell. 1996. The Evolution of the World’s Energy
Systems. Shell International, Group External Affairs, London.
Solantausta, Y., T. Bridgewater, and D. Beckman. 1996.
Electricity Production by Advanced Biomass Power Systems. Espoo, Finland:
VTT Technical Research Centre of Finland.
Spath, P., M. Mann, and W. Amos. 2000. “Comparison of
Gasification Technologies for Converting Biomass to Hydrogen.” Paper
prepared for the First World Conference on Biomass and Industry, June 5 - 9,
Seville, Spain.
Stassen, H.E. 1995. Small Scale Biomass Gasification for Heat
and Power Production: A Global Review. World Bank Technical Paper 296,
Energy Series. Washington, D.C.
Stefansson, V., and I.B. Fridleifsson. 1998. “Geothermal
Energy: European and World-wide Perspective.” Paper presented at expert
hearing on assessment and prospects for geothermal energy in Europe.
Parliamentary Assembly of the Council of Europe, SubCommittee on Technology
Policy and Energy, Strasbourg, France.
SunLab. 1999. “Parabolic Trough Technology Roadmap.”
https://www.eren. doe.gov/sunlab/TechOverview.htm
TERI. (Tata Energy Research Institute). 1996/97. TERI Energy
Data Directory and Yearbook. New Delhi.
Thomas, G.T., H.N. Post, and R. DeBlasio. 1999.
“Photovoltaic Systems: An End-of-Millennium Review.” Progress in
Photovoltaics: Research and Applications 7: 1 - 19.
TNO. 1992. Aandachtspunten voor componentenonderzoek en
alter-natieve zonneboilerconcepten. TNO B-92-0969. Delft, Netherlands.
Tolbert, V., ed. 1998. “Environmental Effects of Biomass
Crop Production: What Do We Know, What Do We Need to Know?” Biomass and
Bioenergy 14 (4): 301 - 414.
Tsuo, Y.S., J.M. Gee, P. Menna, D.S. Strebkov, A. Pinov, and V.
Zadde. 1998. “Environmentally Benign Silicon Solar Cell
Manufacturing.” In J. Schmid and others, eds., Proceedings of the Second
World Conference on PV Solar Energy Conversion. Report EUR 18656. Brussels.
Turkenburg, W.C. 1992. “On the Potential and Implementation
of Wind Energy.” In Proceedings of the European Wind Energy Conference.
Vol. 2. Amsterdam: Elsevier.
Turnure, J.T., S. Winnett, R. Shackleton, and W. Hohenstein.
1995. “Biomass Electricity: Long Run Economic Prospects and Climate Policy
Implications.” In Proceedings of the Second Biomass Conference of the
Americas. Portland, Or.
U.S. DOE (Department of Energy). 1998a.. Renewable Energy
Annual. Washington, D.C.
U.S. DOE (Department of Energy). 1998b. Renewable Energy
Technology Characterizations. Office of Utility Technologies, Washington,
D.C.
U.S. DOE (Department of Energy), OGT (Office of Geothermal
Technologies). 1998. Strategic Plan for the Geothermal Energy Program.
Washington, D.C.
Vaessen, P. 1997. “The Influence of Decentral Generation on
Reliability (in Dutch). “ Hidde Nijland Symposium. Den Bosch, Netherlands.
van den Broek, R., and A. van Wijk. 1998. “Electricidad a
partir de eucalipto y bagazo en ingenios azucareros de nicaragua: costos,
aspectos macroeconomicos y medioambientales.” Documento de trabajo
FOPW/99/2. Food and Agriculture Organization of the United Nations, Rome.
van den Broek, R., A. Faaij, and A. van Wijk, 1996.
“Biomass Combustion Power Generation Technologies.” Biomass and
Bioenergy 11 (4): 271 - 81.
van den Broek, R., A. Faaij, A.J.M. van Wijk, T. Kent, M.
Bulfin, K. Healion, and G. Blaney. 1997. “Willow Firing in Retrofitted
Irish Power Plants.” Biomass and Bioenergy 12 (2): 75 - 90.
van der Leun, C. “Environmental Aspects of Material Use of
SDHW Systems” (in Dutch). Utrecht, Netherlands: Ecofys.
Wijk, A.J.M. van, N. Halberg, and W.C. Turkenburg. 1992.
“Capacity Credit of Wind Power in the Netherlands.” Electric Power
Systems Research 23 (3): 189 - 200.
Vasquez, N.C., and S.P. Javellana. 1997. “Present and
Future Geothermal Development in the Philippines.” In Proceedings of the
NEDO International Geothermal Symposium. Sendai, Japan.
Verhoeven, S. 1999. “Two-way Traffic in the Electricity
Grid and the Role of Power Electronics (in Dutch).” Paper presented at the
STT Symposium Rapid Current: The Next Wave of Electrical Innovation, February
25, The Hague, Netherlands.
Voskens, R.G.J.H., and S. Carpenter. 1999. “Potential for
Solar Drying in the World.” Enermodal engineering, Canada/Ecofys, The
Netherlands.
Walter, A., M.R. Souza, and R.P. Overend. 1998.
“Preliminary Evaluation of Co-firing Biomass (Sugar-Cane Residues) and
Natural Gas in Brazil.” State University of Campinas, Mechanical
Engineering College, Energy Division, Brazil; and National Renewable Energy
Laboratory, Golden, Colo.
WEC (World Energy Council). 1994a. Energy for Toworrow’s
World. London: Kogan Page.
WEC (World Energy Council). 1994b. New Renewable Energy
Resources: A Guide to the Future. London: Kogan Page.
WEC (World Energy Council). 1998. Survey of Energy Resources
1998. London.
Weinberg, C. 1995. “A New Age for Electricity: Integrating
Technology into Business and Strategy.” UNIPEDE (International Union of
Producers and Distributors of Electric Energy), International Electrical
Research Exchange, Monte-Carlo, Monaco.
Weise, E., R. Klockner, R. Kniehl, Ma Shenghong, and Qin
Jianping. 1995. “Remote Power Supply Using Wind and Solar Energy: A
Sino-German Technical Co-operation Project.” In Proceedings of the
Beijing International Conference on Wind Energy. Beijing.
Wentzel, M. 1995. “Solar Cooking: Problems, Perspectives
and Possibilities.” In Proceedings Solar World Congress. Harare,
Zimbabwe.
Williams, R.H., and E.D. Larson. 1996. Biomass Gasifier Gas
Turbine Power Generating Technology.” Biomass and Bioenergy 10 (2 -
3): 149 - 66.
Williams, R.H., E.D. Larson, R.E. Katofsky, and J. Chen. 1995.
“Methanol and Hydrogen from Biomass for Transportation, with Comparisons to
Methanol and Hydrogen from Natural Gas and Coal.” Princeton University,
Centre for Energy and Environmental Studies, Princeton, N.J.
Winkelman, J.E. 1992. “De invloed van de SEP
proef-windcentrale te Oosterbierum op Vogels: Aanvaringsslachtoffers.”
RIN-rapport 92/2. DLO-instituut voor Bos-en Natuuronderzoek, Arnhem,
Netherlands.
Wiser, R., and Pickle S. 1997. “Financing Investments in
Renewable Energy: The Role of Policy Design and Restructuring.” Report
LBNL-39826. Lawrence Berkeley National Laboratory, Environmental Energy
Technologies Division, Calif.
World Atlas. 1998. 1998 World Atlas and Industry Guide.
International Journal on Hydropower and Dams. Aqua-Media International, Sutton,
U.K.
WRR (Wetenschappelijke Raad voor het Regeringsbeleid). 1992.
Ground for Choices: Four Perspectives for the Rural Areas in the European
Community. The Hague: Sdu uitgeverij.
Wyman, C.E., R.L. Bain, N.D. Hinman, and D.J. Stevens. 1993.
“Ethanol and Methanol from Cellulosic Biomass.” In T.B. Johansson J.H.
Kelly, A.K.N. Reddy, R.H. Wiliams, and L. Burnham, Renewable Energy: Sources
for Fuels and Electricity. Washington, D.C. Island Press.
YY. 1998. Proceedings: Third European Wave Power Conference.
September - October, Patras,
Greece.
Chapter 8. Advanced Energy Supply Technologies
Robert H. Williams (United States)
CONTRIBUTING AUTHORS: Matthew Bunn (United States), Stefano
Consonni (Italy), William Gunter (Canada), Sam Holloway (United Kingdom), Robert
Moore (United States), and Dale Simbeck (United States)
|
ABSTRACT
Fossil energy technologies. Sustainability principles
indicate that fossil energy technologies should evolve towards the long-term
goal of near-zero air pollutant and greenhouse gas emissions - without
complicated end-of-pipe control technologies. Near-term technologies and
strategies should support this long-term goal.
The technological revolution under way in power generation -
where advanced systems are replacing steam turbine technologies - supports this
long-term goal. Natural-gas-fired combined cycles offering low costs, high
efficiency, and low environmental impacts are being chosen wherever natural gas
is readily available. Cogeneration is more cost-effective and can play a much
larger role in the energy economy if based on gas turbines and combined cycles
rather than on steam turbines.
Reciprocating engines and emerging microturbine and fuel cell
technologies are strong candidates for cogeneration at smaller scales. Coal
gasification by partial oxidation with oxygen to make syngas (mainly carbon
monoxide, CO, and hydrogen, H2) makes it possible to provide
electricity through integrated gasifier combined cycle plants with air pollutant
emissions nearly as low as for those plants using natural gas combined cycles.
Today power from integrated gasifier combined cycle cogeneration plants can
often compete with power from coal steam-electric plants in either cogeneration
or power-only configurations.
Although synthetic liquid fuels made in single-product
facilities are not competitive, superclean syngas-derived synthetic fuels that
are produced in polygeneration facilities making several products simultaneously
may soon be. Syngas can be produced from natural gas by steam reforming or other
means or from coal by gasification with oxygen. Expanding markets for clean
synthetic fuels are likely to result from toughening air pollution regulations.
Synthetic fuels produced through polygeneration will be based on natural gas, if
it is readily available. In natural-gas-poor, coal-rich regions, polygeneration
based on coal gasification is promising.
The barriers to widespread deployment of advanced
cogen-eration and polygeneration systems are mainly institutional. Most such
systems will produce far more electricity than can be consumed on site, so
achieving favourable economics depends on being able to sell coproduct
electricity at competitive prices into electric grids. Utility policies have
often made doing so difficult, but under the competitive market conditions
towards which electric systems are evolving in many regions, cogeneration and
polygeneration systems will often fare well.
Near-term pursuit of a syngas-based strategy could pave the
way for widespread use of H2 as an energy carrier, because for
decades the cheapest way to make H2 will be from fossil-fuel-derived
syngas. Syngas-based power and H2 production strategies facilitate
the separation and storage of carbon dioxide from fossil energy systems, making
it possible to obtain useful energy with near-zero emissions of greenhouse
gases, without large increases in energy costs. Successful development of fuel
cells would, in turn, facilitate introduction of H2 for energy. Fuel
cells are getting intense attention, because they offer high efficiency and
near-zero air pollutant emissions. Automakers are racing to develop fuel cell
cars, with market entry targeted for 2004 - 10.
Other advanced technologies not based on syngas offer some
benefits relative to conventional technologies. But unlike syngas-based
technologies, such options pursued in the near term would not offer clear paths
to the long-term goal of near-zero emissions without significant increases in
costs for energy services.
Nuclear energy technologies. World-wide, nuclear energy
accounts for 6 percent of energy and 16 percent of electricity. Although it
dominates electricity generation in some countries, its initial promise has not
been realised. Most analysts project that nuclear energy’s contribution to
global energy will not grow and might decline in the near future. Nuclear power
is more costly than originally expected, competition from alternative
technologies is increasing, and there has been a loss of public confidence
because of concerns relating to safety, radioactive waste management, and
potential nuclear weapons proliferation.
Because nuclear power can provide energy without emitting
conventional air pollutants and greenhouse gases, however, it is worth exploring
whether advanced technologies might offer lower costs, restore public confidence
in the safety of reactors, assure that nuclear programmes are not used for
military purposes, and facilitate effective waste management.
In contrast to Chernobyl-type reactors, the light water
reactors (LWRs) that dominate nuclear power globally have had a good safety
record, though this has been achieved at considerable cost to minimise the risk
of accidents.
The potential linkage between peaceful and military uses of
nuclear energy was recognised at the dawn of the nuclear age. Steps taken to
create a non-proliferation regime through treaties, controls on nuclear
commerce, and safeguards on nuclear materials have kept peaceful and military
uses separate. But if there is to be a major expansion of nuclear power,
stronger institutional and technological measures will be needed to maintain
this separation both for proliferation by nations and theft of weapons-usable
materials by subnational groups.
Reactor vendors now offer several evolutionary LWRs with
improved safety features and standardised designs, and there is some ongoing
work on new reactor concepts.
Limited supplies of low-cost uranium might constrain
LWR-based nuclear power development after 2050. Plutonium breeder reactors could
address the resource constraint, but keeping peaceful and military uses of
nuclear materials separate would be more challenging with breeders. Other
possibilities for dealing with the resource constraint are extraction of uranium
from seawater and thermonuclear fusion. There are many uncertainties regarding
such advanced technologies, and all would take decades to develop.
Radioactive waste by-products of nuclear energy must be
isolated so that they can never return to the human environment in harmful
concentrations. Many in the technical community are confident that this
objective can be met. But in most countries there is no consensus on waste
disposal strategies. The current stalemate regarding waste disposal clouds
prospects for nuclear expansion. |
The arguments for marginal, incremental change are not
convincing - not in this day and age. The future, after all, is not linear.
History is full of sparks that set the status quo ablaze.
- Peter Bijur, chief executive officer and chairman, Texaco,
keynote speech to 17th Congress of World Energy Council, Houston, 14 September
1998
This chapter discusses advanced energy supply technologies
with regard to their potential for facilitating the widespread use of fossil and
nuclear energy sources in ways consistent with sustainable development
objectives.1 In each case the current situation is described, goals
for innovation are formulated in the context of these objectives, near-term and
long-term technology options are discussed in relation to these goals, and
illustrative cost estimates are presented for options with reasonably
well-understood costs.*
* Life-cycle costs are presented for an assumed 10
percent real (inflation-corrected) cost of capital (discount rate), neglecting
corporate income and property taxes. Neglecting such taxes is appropriate in a
global study such as this report, partly because tax codes vary markedly from
country to country, and partly because such taxes are transfer payments rather
than true costs. Moreover, such capital-related taxes discriminate against many
capital-intensive technologies that offer promise in addressing sustainable
development objectives. Including such taxes, annual capital charge rates -
including a 0.5 percent a year insurance charge - are typically 15 percent for a
plant with a 25-year operating life, in comparison with 11.5 percent when such
taxes are neglected (U.S.
conditions).
Advanced fossil energy technologies
Fossil fuel supply considerations as a context for fossil energy innovation
Fossil energy technology development will be strongly shaped by
energy supply security concerns and environmental challenges.
The emerging need for oil supplements in liquid fuel
markets
Oil, the dominant fossil fuel, accounted for 44 percent of
fossil fuel use in 1998. Although there is no imminent danger of running out of
oil (chapter 5), dependence on oil from the Persian Gulf, where remaining
low-cost oil resources are concentrated, is expected to grow. For example, the
U.S. Energy Information Administration projects in its reference scenario that
from 1997 - 2020, as global oil production increases by nearly 50 percent, the
Persian Gulf’s production share will increase from 27 to 37 percent (EIA,
1999a). This increase suggests the need to seek greater supply diversity in
liquid fuel markets to reduce energy supply security concerns (chapter 4).
In addition, growing concerns about air quality are leading to
increased interest in new fuels that have a higher degree of inherent
cleanliness than traditional liquid fuels derived from crude oil, especially for
transportation applications. To meet growing fluid fuel demand in the face of
such constraints, some combination of a shift to natural gas and the
introduction of clean synthetic fuels derived from various feedstocks (natural
gas, petroleum residuals, coal, biomass) is likely to be needed to supplement
oil during the next 25 years.
The oil crises of the 1970s catalysed major development efforts
for synthetic fuels. For example, U.S. President Jimmy Carter’s
administration supported a synfuels programme that involved large
government-supported commercialisation projects. Most such projects failed
because the technologies were rendered uneconomic by the collapse of world oil
prices in the mid-1980s. But, as will be shown, emerging synfuel technologies
generally have better environmental characteristics and, when deployed through
innovative multiple-energy-product (poly-generation) strategies, reasonably good
economic prospects, even at relatively low oil price levels. Moreover, the
private sector, rather than the government, is taking the lead in advancing
these new technologies. The government’s role has shifted from managing
demonstration projects to supporting research and development that enables
private-sector-led commercialisation and to helping remove institutional
barriers to deployment.
Entering the age of gas
For natural gas, the cleanest, least-carbon-intensive fossil
fuel, ultimately recoverable conventional resources are at least as abundant as
for oil (chapter 5). Although the global consumption rate for gas is about half
that for oil, the abundance of natural gas and its economic and environmental
attractiveness have led it to play a growing role.2 Since 1980 the
share of natural gas in the global energy economy has grown, while oil and coal
shares have declined. Wherever natural gas supplies are readily available, the
natural-gas-fired gas-turbine - steam-turbine combined cycle (NGCC) has become
the technology of choice for power generation, in which applications it is
typically both the cleanest and least-costly fossil fuel option. As will be
shown, clean natural-gas-derived synthetic fuels also have good prospects of
beginning to compete in liquid fuels markets.
For developing countries, the huge investments needed for
natural gas infrastructure (pipelines, liquid natural gas facilities) are
daunting. But NGCC plants might be built as targeted initial gas users, using
the revenues to facilitate infrastructure financing.
Alternatives to conventional gas might be needed to meet the
growing demand for fluid fuels in 2025 - 50. Options include synthetic fluid
fuels derived from coal and various unconventional natural gas resources
(chapter 5).
Unconventional natural gas resources associated with methane
hydrates are especially large, although the quantities that might be recoverable
and delivered to major markets at competitive costs are highly uncertain
(chapter 5). There is little private sector interest in better understanding the
magnitude and cost dimensions of the methane hydrate resource, because
conventional natural gas supplies are abundant on time scales of interest to
business.
An understanding of methane hydrate issues is important for
decisions on near-term research and development priorities related to
unconventional gas resource development versus coal synthetic fuels development.
For this reason - as well as the theoretical potential of the hydrate resource
and the attractions of natural gas as an energy carrier - the U.S.
President’s Committee of Advisors on Science and Technology has urged
international collaborative research and development in this area, building on
embryonic efforts in India, Japan, and Russia (PCAST Energy Research and
Development Panel, 1997; PCAST Panel on ICERD3, 1999).
The drawbacks and attractions of coal
Coal use is declining in most industrialised countries other
than the United States, where use is expected to grow slowly. World-wide, coal
use is expected to grow as fast as oil use, with much of the growth accounted
for by China, whose global share might increase from 30 percent today to nearly
50 percent by 2020 (EIA, 1999a).
For coal, the dirtiest, most carbon-intensive fossil fuel,
global resources are abundant (chapter 5). Coal is generally less costly than
other fossil fuels. Substantial productivity gains have been made for coal
production in both Australia and the United States (Williams, 1999b). Such gains
can be expected in other regions once energy market reforms are put in place.
Productivity gains have caused coal prices in the United States to decline by a
factorof 2 since the early 1980s, to a level half that for natural gas.
During the next 20 years, a 20 percent rise in the price of
natural gas and a 30 percent drop in the price of coal are expected in the
United States (EIA, 1998a), leading to growth in the price ratio to 3.5. In
Europe coal prices are not as low as in the United States, but even there the
average price of coal imported into the European Union fell by more than a
factor of 2 between 1983 and 1995 (Decker, 1999).
Although many regions are moving away from coal, this chapter
shows that there are reasonable prospects that improved technology could propel
a shift back to coal by making it feasible to provide from coal, at attractive
costs, energy systems characterised by near-zero emissions of both air
pollutants and greenhouse gases. Concerted efforts to develop and commercialise
such technologies are desirable in light of the strategic importance of coal to
coal-rich countries where conventional oil and natural gas resources are scarce
(for example, China and
India).
Setting goals for advanced fossil energy technologies
Designing advanced fossil energy technologies to be compatible
with sustainable development requires that:
· Fossil energy be
widely affordable.
· Fossil energy help
satisfy development needs not now being met.
· Energy supply insecurity concerns be
minimised.
· Adverse environmental impacts be
acceptably low.
· For the longer term,
emissions of carbon dioxide (CO2) and other greenhouse gases be
sufficiently low to meet the objectives of the United Nations Framework
Convention on Climate Change (UNFCC, 1992).3
|
The most formidable
challenges facing the fossil
energy
system are likely to be achieving
near-zero emissions of
air
pollutant and CO2
emissions. |
If fossil fuels are to play major roles in. facilitating
sustainable development, all these objectives must be met simultaneously - which
is impossible with today’s technologies. Thus there is a need for
substantial research, development, demonstration, and deployment programmes
aimed at launching advanced, sustainable fossil energy technologies in the
market. Because resources available to support energy innovation are scarce (and
the fossil energy community must share these scarce resources with the end-use
energy efficiency, renewable energy, and nuclear energy communities), criteria
should be established for the long-term goals of the innovation effort. In
addition, alternative technological strategies should be assessed with regard to
their prospects for meeting these goals. This section introduces sustainable
development goals for advanced fossil energy technologies. Later sections
discuss the prospects for meeting these goals with alternative clusters of
technologies.
The objective of making energy widely affordable is satisfied
for most consuming groups with existing fossil energy technologies, which tend
to be the least costly energy supplies. Addressing other sustainability
objectives simultaneously will tend to increase costs. However, advanced
technologies can help contain costs when these other objectives are also
pursued. Moreover, as will be shown, new approaches to organising energy systems
so that multiple products are made in a single facility - polygeneration
strategies - can also lead to lower energy costs. The fossil energy technologies
with the greatest potential to meet environmental goals are especially
well-suited to polygeneration.
A key aspect of the objective of satisfying unmet energy needs
for development involves giving the poor - especially the rural poor in
developing countries - access to clean, modern energy carriers. Clean cooking
fuels and electricity to satisfy basic needs are particularly important
(chapters 2, 3, and 10). Advanced fossil energy technologies can help address
these needs. Innovations in synthetic fuel technology, together with the
attractive economics associated with deploying such technologies in
polygeneration configurations, make the prospects for clean synthetic fuels much
brighter today than they have been.
Some of the most promising synthetic fuels (such as dimethyl
ether, or DME) are attractive energy carriers for serving both cooking fuel and
transportation markets. The revolution in power-generating technology and the
market reforms that are making small-scale power generation (reciprocating
engines, microturbines, fuel cells) increasingly attractive economically in
grid-connected power markets can also be deployed in remote rural markets, many
of which are not currently served by grid electricity. Even in such markets
where fossil fuels are not readily available, these systems can be adapted for
use with locally available biomass resources in rural areas (Mukunda, Dasappa,
and Srinivasa, 1993; Kartha, Kruetz, and Williams, 1997; Henderick, 1999;
Henderick and Williams, 2000). Likewise, clean synthetic fuels for cooking can
also be derived from biomass (Larson and Jin, 1999). Fossil energy technology
advances have made biomass applications feasible for both small-scale power
generation and synthetic cooking fuel production.
To a large extent, the objective of minimising energy supply
insecurity concerns can be addressed with advanced fossil energy technologies by
pursuing opportunities to diversify the supply base for fluid fuels. Especially
promising are opportunities to make synthetic fluid fuels through polygeneration
strategies - using petroleum residuals, natural gas, and coal as feedstocks as
appropriate, depending on local resource endowments. And for the longer term,
successful development of methane clathrate hydrate technology could lead to
improved energy security for a number of economies that heavily depend on
imported hydrocarbons but have large off-shore hydrate deposits (such as India,
Japan, Republic of Korea, and Taiwan, China).
The objective of making adverse environmental impacts acceptably
low requires addressing the question: how low is low enough? Among environmental
impacts, air pollution effects are especially important, for developing and
industrialised countries alike. Moreover, adverse health impacts of air
pollution tend to dominate overall air pollution impacts (chapter 3).
For many developing countries, the cost of the environmental
damage caused by air pollution is high even though per capita energy consumption
is low - mainly because pollution controls are largely lacking.4
Costs from air pollution are also high for industrialised countries with
strong pollution controls,5 not only because of much higher energy
consumption but also because the cost of uncontrolled emissions grows much
faster than energy consumption, given that economists measure these costs on the
basis of willingness to pay to avoid these damages (chapter 3).6
Tables 8.1 and 8.2 show that even low estimates of these damage costs are
significant relative to typical direct economic costs (direct costs are $0.03 -
0.04 a kilowatt-hour for electricity and $0.20 - 0.30 a litre for transport
fuels) for both coal power plants and for automobiles, but are low for modern
natural gas power plants.7
Here it is assumed that a major long-term goal for advanced
fossil energy technology that is implicit in the objective of making adverse
environmental impacts acceptably low is near-zero air pollutant emissions -
without the need for complicated and costly end-of-pipe control technologies.
‘Near-zero emissions’ is taken to mean emissions so low that residual
environmental damage costs are a tiny fraction of the direct economic cost of
energy. ‘Long-term’ is defined as 2015 and beyond. Thus the goal of
near-zero emissions is a target for energy innovation (research, development,
demonstration, early deployment) rather than a near-term regulatory goal. There
are five readily identifiable reasons for setting such an ambitious goal for
emissions.
TABLE 8.1. EMISSION RATES FOR AND ESTIMATED COSTS OF
ENVIRONMENTAL DAMAGE FROM AIR POLLUTANT EMISSIONS OF FOSSIL FUEL POWER PLANT
(LOW VALUATION FOR TYPICAL EUROPEAN CONDITIONS)
|
Emission rate
(grams per kilowatt-hour) |
Low estimate of costs of environmental
damages
(dollars per thousand kilowatt-hours)a |
Environmental damage costs relative to NGCC |
|
Primary air pollutant |
SO2 |
NOx |
PM10 |
SO2 |
NOx |
PM10 |
Total |
Total |
|
Average U.S. coal steam-electric plant, 1997 |
6.10b |
3.47b |
0.16c |
15.9 |
13.9 |
0.7 |
30.5 |
82 |
|
New coal steam-electric plant with best available control
technologyd |
0.46 |
0.87 |
0.15c |
1.2 |
3.5 |
0.6 |
5.3 |
14 |
|
Coal IGCC plante |
0.075 |
0.082 |
0.0025 |
0.20 |
0.33 |
0.01 |
0.54 |
1.5 |
|
NGCC plantf |
- |
0.092 |
- |
- |
0.37 |
- |
0.37 |
1.0 |
a. Environmental damage costs from power plant air
pollutant emissions are assumed to be 25 percent of the median estimates of Rabl
and Spadaro (2000) for typical power plant sitings in Europe. (The Rabl and
Spadaro calculations were carried out under the European Commission’s
ExternE Programme. Nearly all the estimated costs of environmental damages are
associated with adverse health impacts; the economic values of health impacts
were estimated on the basis of the principle of willingness to pay to avoid
adverse health effects.) Rabl and Spadaro considered a wide range of pollutants,
but the only significant damage costs were from SO2, NOx,
and PM10, for which their median estimates of damage costs (in
dollars per kilogram) were $10.44, $16.00, and $17.00. Damage costs at 25
percent of the median estimates of Rabl and Spadaro (equivalent to one standard
deviation belowthe median) are assumed, to put a conservatism into the
calculation to reflect the scientific uncertainty. b. Average emission rates in
1997 for U.S. coal plants, whose average efficiency was 33 percent (EIA, 1998b).
c. In 1990 PM10 emissions from U.S. electric utility coal power
plants amountedto 245,000 tonnes (Spengler and Wilson, 1996) when these plants
consumed 17.1 exajoules of coal (EIA, 1998b), so the PM10 emission
rate was 14.34 grams per gigajoule - the assumed emission rate for all
steam-electric cases in this table. d. It is assumed that the new coal
steam-electric plant is 35.5 percent efficient; that the coal contains 454 grams
of sulphur per gigajoule (1.08 percent sulphur by weight), the average for U.S.
coal power plants in 1997 (EIA, 1998b); that SO2 emissions are
reduced 95 percent, a commercially feasible rate; and that the NOx
emission rate is 86 grams per gigajoule - achievable with advanced
low-NOx burners that will be commercially available shortly; e. It is
assumed that the coal integrated gasifier combined cycle (IGCC) plant is 43.8
percent efficient, based on use of steam-cooled gas turbines (see table 8.4);
that the emission rates equal the measured values for the Buggenum coal IGCC
plant (Netherlands): 10.0 and 0.3 grams per gigajoule of coal for NOx
and particulates, respectively, as well as 99 percent sulphur recovery
(data presented by Co van Liere, KEMA, at the Gasification Technologies
Conference in San Francisco, 17 - 20 October 1999); and that the coal contains
454 grams of sulphur per gigajoule. f. It is assumed that the natural gas
combined cycle (NGCC) plant is 54.1 percent efficient, based on use of
steam-cooled gas turbines (see table 8.4); and that the NOx emission
rate is 9 parts per million on a dry volume basis (at 15 percent O2),
corresponding to an emission rate of 0.092 grams per kilowatt-hour.
TABLE 8.2. EMISSION RATES FOR AND ESTIMATED COSTS OF
ENVIRONMENTAL DAMAGE FROM AIR POLLUTANT EMISSIONS OF AUTOMOBILES (LOW VALUATION
FOR TYPICAL FRENCH CONDITIONS)
|
Fuel and driving environment |
Fuel economy
(kilometres per litre) |
Emission rate
(grams per kilometre) |
Low estimate of costs of environmental damages, EU
conditionsa (dollars) |
|
|
|
Per kilogram |
Per thousand kilometres of driving |
Per thousand litres of fuel consumed |
|
|
NOx |
PM |
NOx |
PM |
NOx |
PM |
Totalb |
NOx |
PM |
Totalb |
|
Gasolinec |
|
|
|
|
|
|
|
|
|
|
|
|
Urband |
8.7 |
0.68 |
0.017 |
5.5 |
690 |
3.7 |
11.7 |
16.6 |
32 |
102 |
144 |
|
Rurald |
10.3 |
0.79 |
0.015 |
6.8 |
47 |
5.4 |
0.71 |
7.3 |
56 |
7.3 |
75 |
|
Diesel |
|
|
|
|
|
|
|
|
|
|
|
|
Urband |
10.4 |
0.75 |
0.174 |
5.5 |
690 |
4.1 |
120 |
125 |
43 |
1250 |
1300 |
|
Rurald |
12.7 |
0.62 |
0.150 |
6.8 |
47 |
4.2 |
7.1 |
12.5 |
53 |
90 |
159 |
a. Environmental damage costs from automotive air
pollutant emissions are assumed to be 25 percent of the median estimates
presented in Spadaro and Rabl (1999) and Spadaro and others (1998) -
calculations carried out under the European Commission’s ExternE Programme.
Nearly all the estimated costs of environmental damages are associated with
adverse health impacts; the economic values of health impacts were estimated on
the basis of the principle of willingness to pay to avoid adverse health
effects. Damage costs at 25 percent of the mean estimates in these studies
(equivalent to one standard deviation below the median) are assumed, to put a
conservatism into the calculation to reflect the scientific uncertainty. b.
Total costs per kilometre include, in addition to costs associated with NOx
and PM emissions, costs associated with emissions from CO, volatile
organic compounds (VOC), SO2, and benzo-a-pyrene (BaP). c. For a
gasoline internal combustion engine car equipped with a catalytic converter. d.
Urban cost estimates are for driving around Paris, where the average population
density is 7,500 per square kilometre. Rural costs estimates are for a trip from
Paris to Lyon, for which the average density of the population exposed to the
automotive air pollution is 400 per square kilometre.
First, air pollution damage costs are associated largely with
small-particle pollution, for which there appears to be no threshold below which
the pollution is safe (chapter 3). Second, the trend has been towards
continually more stringent controls on emissions in industrialised countries,
both as a result of improved knowledge of adverse impacts and of increasing
societal demands for cleaner air as incomes rise. But meeting air quality goals
by continually ratcheting up the required end-of-pipe controls has proven very
costly - both because the cost of reducing emissions by the next increment tends
to increase sharply with the level of reduction, and because the continual
technological change required to keep up with evolving regulatory goals can be
very costly when there is not enough time between changes in regulations to
recover the cost of the last incremental improvement before the next one must be
made.
Third, regulations calling for ever tighter end-of-pipe controls
on emissions are sometimes not nearly as effective in meeting air quality goals
as they are supposed to be, as is illustrated by the wide gap between actual
emission levels and regulated emission levels for U.S. cars - a gap that has
been projected to increase in the future, as regulations tighten (table
8.3).8 Fourth, even for developing countries, the long-term near-zero
emissions goal makes sense, because much of the energy technology that will be
put into place in the period 2015 - 25 will still be operating decades later
when incomes and societal desires for clean air will be high.9 And
fifth, there are promising technological options for converting the near zero
emissions goal into reality. For example, managers of the U.S. Department of
Energy’s fossil energy programme have enough confidence in this idea to
have created a new programme that seeks to develop new fossil energy
technologies by 2015 that are characterised, among other things, by near-zero
air pollutant emissions, as well as zero solid and liquid waste
discharges.10
The challenge of setting goals with regard to the objective of
preventing dangerous anthropogenic interference with the climate system is
complicated by the fact that there is not yet agreement in the global community
as to the level at which atmospheric CO2 should be stabilised.
However, the level that is eventually decided on is likely to be far below the
level to which the world would evolve for an energy system that would follow a
business-as-usual path. The IS92a scenario of the Intergovernmental Panel on
Climate Change might be considered a business-as-usual energy future (IPCC,
1995). In this scenario the CO2 emission rate grows from 7.5
gigatonnes of carbon (GtC) in 1990 (6.0 GtC from fossil fuel burning plus 1.5
GtC from deforestation) to 20 GtC in 2100. By way of contrast, stabilisation at
twice the pre-industrial CO2 level (550 parts per million by volume,
a target favoured by various groups) would require reducing annual fossil energy
emissions to 5.5 GtC by 2100. Stabilisation at 450 parts per million by volume
(up from 360 parts per million by volume today) would require emissions falling
to about 2.5 GtC by 2100 (DOE, 1999).
Many believe that coping adequately with the challenge of
climate change will require major shifts to renewable energy sources, nuclear
energy sources, or both. Although such shifts might be desirable for a variety
of reasons, climate change concerns do not necessarily require a major shift
away from fossil fuels. To be sure, the dimensions of the challenge are such
that the deep reductions in CO2 emissions that might be required
during the next 100 years cannot be achieved only by making efficiency
improvements in fossil energy conversion, however desirable energy efficiency
improvements might be. But energy efficiency improvement is not the only option
for reducing CO2 emissions from fossil fuels. The energy content of
these fuels can also be recovered while preventing the release of CO2
into the atmosphere - for example, by separating out the CO2
and sequestering it in geological formations or in the deep ocean.
There is growing optimism in the scientific and technological
communities that fossil energy systems can be made compatible with a world of
severely constrained greenhouse gas emissions (Socolow, 1997). This optimism is
reflected in new fossil energy research and development programmes (for example,
in Japan, Norway, and the United States) that aim to achieve near-zero emissions
from fossil energy systems. As will be shown, even with some already developed
technologies it appears feasible to achieve deep reductions in CO2
emissions without large increases in fossil energy costs.
Although uncertainties regarding storage security and potentially adverse
environmental impacts (especially for ocean sequestration) must be resolved
before a high degree of confidence can be assigned to this option, there is
growing scientific confidence that the potential for sequestering CO2
is vast.
How can such considerations be used to frame goals for advanced
fossil energy technologies that are consistent with the UN Framework Convention
on Climate Change, when global society has not yet decided what goal is needed?
In light of the long lead times required to bring new technologies to market at
large scales, and considering that energy research and development is cheap
insurance for addressing the climate change challenge (PCAST Energy Research and
Development Panel, 1997), it is assumed here that a major element of the overall
fossil energy innovation effort should be to develop the capacity to achieve
deep reductions in CO2 and other greenhouse gases. Thus, if global
society eventually decides that deep reductions are needed, the fossil energy
community will be prepared to respond with advanced technologies and strategies.
As with air pollution, the goal of reducing greenhouse gas emissions to near
zero is a target for capacity development through technological innovation over
the long term, rather than for near-term regulations.
Of the challenges facing the fossil energy system in moving
towards sustainable development, the most formidable are likely to be near-zero
emissions of air pollutants and CO2. Consequently, these two
challenges are given the greatest emphasis in the following
sections.
Technologies and strategies for moving towards near-zero emissions
This section describes fossil energy technologies and strategies
that offer considerable promise to meet all the sustainable development criteria
set forth in the previous section, including, for the longer term, the
especially daunting criteria of near-zero emissions of both air pollutants and
greenhouse gases. Near-zero emissions could be achieved in the long term if the
dominant energy carriers were electricity and hydrogen (H2). The
importance of having H2 as an option complementing electricity as an
energy carrier is discussed in box 8.1.
Here technologies are first discussed for power generation and
then for synthetic fuels production. Key near-term strategies to hasten the
widespread use of these technologies are cogeneration (combined heat and power)
and polygeneration, which entails the simultaneous production of various
combinations of synthetic fuels, electricity, process heat, and chemicals.
Cogeneration and polygeneration offer favourable economics that can facilitate
the industrial development of energy production technology based on synthesis
gas (a mixture of gases consisting mainly of CO and H2), which will
subsequently be called syngas. Syngas is a key intermediate energy product that
makes it possible to make many clean final energy products from fossil fuels -
including, for the longer term, H2.
TABLE 8.3. ESTIMATED COSTS OF ENVIRONMENTAL DAMAGE FROM
NOX EMISSIONS OF AUTOMOBILES (LOW VALUATION FOR TYPICAL FRENCH
CONDITIONS, ASSUMING U.S. REGULATED AND ESTIMATED ACTUAL EMISSION LEVELS)
|
Model year |
NOx emission rate
(grams per
kilometre) |
Estimated environmental damage cost (dollars per thousand
kilometres, low estimate, French conditions; 55 percent urban + 45 percent rural
driving, so that average cost = $6.1 per kilogram)a |
New car fuel economy
(kilometres per litre)
|
Estimated environmental damage costs
(dollars per
thousand litres of gasoline) |
|
Regulated level |
Estimated actual levelb |
Emissions at regulated level |
Estimated actual emissions |
|
Emissions at regulated level |
Estimated actual emissions |
|
1993 |
0.62 |
1.1 |
4 |
7 |
11.8 |
45 |
79 |
|
2000 |
0.25 |
0.8 |
2 |
5 |
11.9 |
18 |
58 |
|
2010 |
0.12 |
0.5 |
1 |
3 |
12.8 |
9 |
39 |
a. Low estimates of the costs of environmental
damages for NOx emissions from gasoline-powered automobiles operated
under French conditions (from table 8.2): $5.5 per kilogram for urban areas and
$6.8 per kilogram for rural areas. For regions other than France, costs at the
same per capita GDP levels will scale roughly according to the regional
population density. b. From Ross, Goodwin, and Watkins, 1995.
|
BOX 8.1. THE STRATEGIC IMPORTANCE OF HYDROGEN AS AN ENERGY
CARRIER
For the long term, it is desirable that the energy system be
based largely on inherently clean energy carriers. Like electricity, during its
use hydrogen (H2) generates zero or near-zero emissions of air
pollutants and CO2. And, as for electricity, it can be produced from
fossil fuels as well as from non-carbon-based primary energy sources through
various processes characterised by near-zero emissions of air pollutants and
CO2 (see the section below on enhancing prospects for H2).
The importance of having H2 as well as electricity as
an inherently clean energy carrier stems from the difficulty of using
electricity efficiently and cost-effectively in some important markets such as
transportation. In principle, near-zero emissions could be realised throughout
the energy economy with electricity, which accounts for a third of global
CO2 emissions from burning fossil fuels. In practice, however, for
most applications electricity use is limited mainly to systems that can be
supplied with electricity relatively continuously from stationary sources,
because of the difficulties that have been encountered in evolving suitable
cost-competitive electricity storage technologies.
Consider that although the zero-emissions mandate for cars in
California was focused initially on developing battery-powered electric cars,
the goal of producing light-weight, low-cost batteries with adequate range
between rechargings has proven an elusive technological challenge; this
difficulty is one of the factors that has resulted in refocusing much of the
zero-emission-vehicle quest on fuel cells, with the expectation that ultimately
fuel cell vehicles will be fuelled with H2. Although storing H2
onboard vehicles is more difficult than storing liquid fuels, providing
enough low-cost storage capacity to reduce refuelling rates to acceptable levels
for consumers is a far less daunting challenge for H2 than for
electricity.
More generally, development of near-zero-emitting H2
energy systems is desirable because modellers expect, under
business-as-usual conditions, major continuing high demand levels for fluid
(liquid and gaseous) fuels and high levels of CO2 emissions
associated with fluid fuels production and use. Consider, for example, the
reference IS92a scenario (IPCC, 1995). Although electricity’s share of
worldwide secondary energy consumption grows from 15 percent in 1990 to 28
percent in 2100, the fluid fuel share is only slightly less in 2100 than in 1990
(57 versus 64 percent) in the IS92a scenario.
Moreover, because of the projected rapidly growing importance of
synthetic fuels after 2050, fluid fuel production accounts for 60 percent of
IS92a’s 20 GtC of total energy-related CO2 emissions in 2100, up
from 47 percent of the 6 GtC of total energy-related CO2 emissions in
1990. Thus, even if electricity generation could be made 100 percent free of
CO2 emissions by 2100 (through a shift of projected fossil electric
generation to some mix of renewable energy, nuclear energy, and decarbonised
fossil energy), emissions in 2100 would still be double those of 1990 (even
though CO2-neutral biomass produced at a rate equivalent to more than
half of total primary energy use in 1990 provides a third of total synthetic
fuels in 2100).
Having available H2 as well as electricity provided
by production systems with near-zero emissions would provide society with the
capacity to achieve, in the longer term, deep reductions in CO2
emissions from the fluid fuel sectors as well as from the electric sector,
and thereby help make it possible to limit the CO2 level in the
atmosphere to twice the pre-industrial level or less in response to climate
change concerns. |
Advanced technologies for power generation and
cogeneration
Promising advanced power generation and cogeneration
technologies for the near (less than 5 years) to medium (5 - 15 years) term
include natural-gas-fired gas-turbine-based technologies, coal integrated
gasifier combined cycle (IGCC) technologies, small engines suitable for
distributed cogeneration applications, and various fuel cell technologies.
Natural-gas- and gas-turbine-based technologies. The pace
of technological change has been brisk for gas turbines,11 to the
point where efficiencies are now comparable to those for coal steam-electric
plants, even though turbine exhaust gas temperatures are high. To avoid wasting
exhaust gas heat, gas turbines used in central-station power plants for purposes
other than meeting peak loads are typically coupled through heat recovery steam
generators to steam turbines in gas turbine - steam turbine combined cycles.
Table 8.4 presents cost and performance characteristics of two
NGCC units: a 50 percent efficient* Frame 7F unit (commercially available)
equipped with air-cooled gas turbine blades and a 54 percent efficient Frame 7H
unit (available in 2000 or after) equipped with steam-cooled turbine
blades.12 In competitive power markets, installed costsof NGCCs have
fallen to less than $500 per kilowatt-electric. For typical U.S. and European
fuel prices, modern NGCCs can provide electricity at lower cost and about 60
percent less CO2 emissions per kilowatt-hour than coal steam-electric
plants (see table 8.4).
* Efficiences in this chapter are expressed on a
higher heating value (HHV) basis unless explicitly indicated
otherwise.
Thermal nitrogen oxide (NOx) generated in the
combustor by oxidising nitrogen from the air at high flame temperatures is the
only significant air pollutant arising from NGCC operation. But even in areas
with tight regulations on NOx emissions,13 modern NGCCs are often
able to meet regulatory requirements without having to install costly
end-of-pipe controls, by premixing fuel and air for the combustor and thereby
avoiding high flame temperatures. With this technology, NOx emissions
per kilowatt-hour are only 10 percent of those for coal steam-electric plants
equipped with the best available control technology, and overall costs of
pollution damages from NGCCs are one-fourteenth of those for coal plants
equipped with the best available control technology (see table 8.1).
Opportunities for innovation are not exhausted. One option is to
eliminate entirely the relatively capital-intensive steam turbine in a so-called
Tophat® cycle that involves heating air exiting the compressor
with turbine exhaust heat and spray intercooling during compression (van Liere,
1998). By injecting a mist of fine water particles into the compressor to cool
the air during compression (using hot water produced from turbine exhaust heat),
compressor work requirements are greatly reduced, and net turbine output and
efficiency are increased.14
One study applying the Tophat® concept to a
redesign of a modern aeroderivative gas turbine estimated that the gas turbine
output would increase from 47 to 104 megawatts-electric, the efficiency would
increase from 36.5 to 52.2 percent (almost to the level for the
400-megawatt-electric Frame 7H NGCC; see table 8.4), and NOx
emissions would be substantially reduced. The capital cost per
kilowatt-electric for such a unit is expected to be less than for NGCCs (van
Liere, 1998).15
In addition, during the next 10 years, system efficiencies might
increase further to levels of nearly 60 percent, as technological advances make
it possible for turbine inlet temperatures to move up to about 1,500 degrees
Celsius, and various cycle configurations (for example, reheating and
intercooling) are exploited (Chiesa and others, 1993).
TABLE 8.4. PERFORMANCE, GENERATION COSTS, AND CO2
EMISSION RATES FOR ALTERNATIVE CONVENTIONAL FOSSIL FUEL POWER PLANTS
|
Performance, costs, and emission ratesa |
Pulverised coal steam-electric plant with flue gas
desulphurisation |
Coal integrated gasifier combined cycle (IGCC) plant
|
Natural gas combined cycle (NGCC) plant |
|
|
Air-cooled turbine |
Steam-cooled turbine |
Air-cooled turbine |
Steam-cooled turbine |
|
Plant capacity (megawatts) |
500 |
500 |
400 |
506 |
400 |
|
Efficiency (percent, higher heating value [HHV] basis)
|
35.5 |
40.1 |
43.8 |
50.2 |
54.1 |
|
Installed capital cost (dollars per kilowatt) |
1090 |
1320 |
1091 |
468 |
445 |
|
Generation cost components (dollars per thousand
kilowatt-hours) |
|
|
|
|
|
|
Capital chargesb |
17.9 |
21.7 |
17.9 |
7.7 |
7.3 |
|
Fixed operation and maintenance |
2.3 |
2.8 |
3.0 |
2.3 |
2.3 |
|
Variable operation and maintenance |
2.0 |
2.0 |
2.1 |
1.5 |
1.5 |
|
Fuel |
|
|
|
|
|
|
|
Typical U.S. fuel pricec |
10.1 |
9.0 |
8.2 |
19.4 |
18.0 |
|
|
Typical European fuel pricec |
17.2 |
15.3 |
14.0 |
22.9 |
21.3 |
|
Total generation cost (dollars per thousand
kilowatt-hours) |
|
|
|
|
|
|
Typical U.S. fuel pricec |
32.3 |
35.5 |
31.2 |
30.9 |
29.1 |
|
Typical European fuel pricec |
39.4 |
41.8 |
37.0 |
34.4 |
32.4 |
|
CO2 emission rate (grams of carbon per
kilowatt-hour)d |
238 |
210 |
193 |
98 |
91 |
a. Plant capacities, installed capital costs,
operation and maintenance costs, and plant efficiencies are from Todd and Stoll
(1997). Combined cycle plants with air-cooled and steam-cooled gas turbine
blades involve use of General Electric Frame 7F (commercial) and Frame 7H (near
commercial) gas turbines, respectively. b. Capital charges are calculated
assuming a 10 percent discount rate, a 25-year plant life, and an insurance rate
of 0.5 percent a year, and neglecting corporate income taxes, so that the annual
capital charge rate is 11.5 percent. It is assumed that all power plants are
operated at an average capacity factor of 80 percent. c. For the United States:
coal and natural gas prices of $1.00 and $2.70 per gigajoule, respectively
(average prices projected by the U.S. Energy Information Administration for
electric generators in 2010; EIA, 1998a). For Europe: prices for electric
generators of $1.70 per gigajoule for coal (average for OECD countries in 1997)
and $3.20 per gigajoule for natural gas (average for Finland, Germany,
Netherlands, and United Kingdom for 1997). d. The carbon contents of coal and
natural gas are assumed to be 23.4 kilograms of carbon per gigajoule and 13.7
kilograms of carbon per gigajoule, respectively.
If there are opportunities for using steam (for example, in
support of an industrial process), hot gas turbine exhaust gases can be used to
produce this steam in cogeneration configurations. Combined cycles can also be
used for cogeneration - for example, by installing a back-pressure steam turbine
instead of a condensing steam turbine with the gas turbine. With a back-pressure
turbine, the high-quality steam produced from the gas turbine exhaust heat is
first used to produce some electricity, and subsequently the lower quality steam
discharged in the steam turbine exhaust is used for process applications. For
such a system the ratio of produced electricity to process steam is higher than
for a simple cycle gas turbine (figure 8.1).
FIGURE 8.1. OUTPUT RATIOS OF POWER
(KILOWATTS-ELECTRIC) TO HEAT (KILOWATTS-THERMAL) FOR ALTERNATIVE COGENERATION
TECHNOLOGIES
Note: Ratios are for systems producing 10 bar steam.
All steam turbines are back-pressure steam turbines with no steam condenser.
Source: Simbeck, 1999b.
Cogeneration is especially important in the near term for
rapidly industrialising countries. Because these countries are in the early
stages of building their infrastructure, their process-heat-intensive,
basic-materials-processing industries are growing rapidly. Rapidly growing steam
loads represent important resource bases for cogeneration, so that these
industries have the potential of becoming major providers of clean,
cost-competitive power. In this context, cogeneration systems employing gas
turbines and combined cycles equipped with back-pressure turbines provide
several times as much electricity per unit of process steam as systems based on
simple back-pressure turbines (figure 8.1). These and other cogeneration
technologies characterised by high output ratios of electricity to steam (for
example, reciprocating internal combustion engines and fuel cells) make it
possible for cogeneration to play a far greater role in power generation than is
feasible with steam-turbine technology.16
TABLE 8.5. COGENERATION VERSUS SEPARATE PRODUCTION OF
ELECTRICITY AND STEAM USING NATURAL GAS COMBINED CYCLES
|
Rates of activity and costs |
Separate production facilities for electricity and
steam |
Cogeneration facility |
|
Electricity |
Steam |
Total |
|
|
Power generation rate (megawatts-electric) |
400 |
- |
400 |
400 |
|
Process steam production rate, 10-15 bar
(megawatts-thermal) |
- |
400 |
400 |
400 |
|
Natural gas input rate (terajoules per hour) |
2.66 |
1.77 |
4.43 |
3.48 |
|
First Law efficiency (percent) |
54.1 |
81.1 |
64.9 |
82.8 |
|
CO2 emission rate (tonnes per hour) |
132 |
88 |
220 |
172 |
|
Capital investment (millions of dollars) |
166 |
48 |
214 |
194 |
|
Energy production cost (dollars per thousand
kilowatt-hours) |
|
|
|
|
|
Capital |
6.8 |
2.0 |
- |
8.0 |
|
Operation and maintenance (4 percent of capital cost per year)
|
2.4 |
0.7 |
- |
2.8 |
|
Fuel |
18.0 |
12.0 |
- |
23.5 |
|
Credit for cogenerated steam (at $14.7 per thousand
kilowatt-hours of steam) |
- |
- |
- |
-14.7 |
|
Total (net) production cost (dollars per thousand
kilowatt-hours) |
27.2 |
14.7 |
- |
19.6 |
|
Annual cost of energy (millions of dollars) |
76.3 |
41.2 |
117.5 |
55.0+41.2 |
|
Cost of CO2 emissions avoided (dollars per tonne
of carbon) |
- |
- |
- |
-$232 |
Note: Based on calculations by Dale Simbeck, SFA
Pacific. Engineering and contingencies and general facilities are each 10
percent of process capital equipment costs. The annual capital charge rate is
11.5 percent. The natural gas price is $2.70 per gigajoule (see note c, table
8.4). The annual average capacity factor equals 80 percent. The combined cycle
plant assumed for both power only and cogeneration applications is the unit with
steam-cooled gas turbine blades analysed in table 8.4.
An example of cogeneration with NGCC technology and equal
quantities of electric and steam power is described in table 8.5. For this
system, the fuel required is a fifth less and the net cost of electricity is a
quarter less per kilowatt-hour than for electricity and heat production in
separate facilities. Moreover, net costs for CO2 emissions reduction
are strongly negative at - $230 per tonne of carbon relative to costs for
systems that produce these products singly!
Cogeneration systems based on combined cycles and other high
electricity and steam output ratio technologies will typically lead to far more
electricity generated than the host factory can consume (Williams, 1978).
Entrepreneurs will not be motivated to deploy such technologies unless they are
able to sell into the grid electricity produced at fair market rates. Existing
electric-sector policies in many countries discourage such sales - for example,
electric companies often will not purchase cogenerated power at market rates or
will charge exorbitant fees for back-up service. But other countries have
adopted policies encouraging cogeneration. In competitive power markets,
cogenerators would typically do well (see table 8.5).
A final note: NGCC economic and environmental benefits in power
and cogeneration markets are so attractive that countries with constrained
natural gas supplies (such as China and India) should consider introducing NGCC
plants as anchor users for natural gas supplies that might be introduced
transnationally, using NGCC power generation and cogeneration revenues to
underwrite pipeline and other gas infrastructure costs.
Oxygen-blown coal gasification and integrated gasifier
combined cycle technologies. Gasification technology makes it possible to
extend to coal the economic, thermodynamic, and environmental benefits of
combined cycles in the form of IGCC power plants. Gasifiers can be oxygen-blown
(O2) or air-blown. All commercial units are O2-blown,
although some systems based on air-blown units are being demonstrated. The focus
here is on systems with O2-blown gasifiers; systems with air-blown
gasifiers are discussed below.
Since the demonstration of IGCC technology with the 94-mega
watt-electric Coolwater Project in southern California (1984 - 89), there has
been much progress relating to its commercialisation. Table 8.6 lists five large
commercial-scale coal IGCC plants around the world that produce electricity or
electricity and steam (cogen-eration), as well as nine other large commercial
projects that involve gasification of petroleum residues to coproduce
electricity with H2, syngas, or steam.17 If all the syngas
capacity in these 14 plants (9,825 megawatts-thermal) were dedicated to power
generation, the equivalent electric generating capacity would be about 5,300
megawatts-electric.
Pollutant emission levels for coal IGCCs can be nearly as low as
for NGCCs - much less than for coal steam-electric plants. Environmental damage
costs associated with emission levels equivalent to those measured at the
Buggenum plant in the Netherlands are less than 2 percent of such costs for
average coal-fired power plants in the United States and about 10 percent of
such costs for coal steam-electric plants equipped with the best available
control technology (see table 8.1). Deep reductions in emissions are feasible
because pollutants are recovered in concentrated form from the fuel gas (syngas)
leaving the gasifier - undiluted by the large amounts of nitrogen from
combustion air that are present in flue gases, from which air pollutants are
recovered for conventional power plants.
IGCC technology also offers solid waste management advantages.
Most direct combustion processes recover sulphur from flue gases as a
nonmarketable wet scrubber sludge or as a dry spent sulphur sorbent (the
by-product gypsum can be marketed). For such systems, solid wastes are more
difficult to handle and market or dispose of, and volumes to be managed are two
to three times those for IGCC systems, which recover a marketable elemental
sulphur by-product.18
The cost of electricity for IGCC technology is somewhat higher
than for coal steam-electric plants (compare Frame 7F IGCC and steam-electric
plant costs in table 8.4) - when credit is not given for the environmental
benefits, which would probably tip the balance decisively in favour of IGCC (see
table 8.1). New turbine technology based on the use of steam-cooled turbine
blades (Frame 7H technology) could tip the balance slightly in favour of IGCC,
even without environmental credits (see table 8.4). But the direct economic
benefits are likely to be too small to convince users to shift from familiar
technology to any new technology, with all the attendant risks associated with
its adoption. The user will take such risks only if forced to (for example, by
environmental regulations) or because the economic benefits would be decisive.
|
Growing concerns about air quality are
leading to increased
interest in new fuels
that have a higher degree of inherent
cleanliness
than traditional
liquid fuels derived from
crude oil. |
O2-blown coal gasification probably has a better
chance of being launched in the market through applications other than
power-only - for example, cogeneration. Table 8.7 illustrates the advantages
offered by IGCC-based cogeneration. For this system, fuel requirements are
reduced one fifth and the net electricity generation cost is reduced one fourth
relative to electricity and steam production in separate facilities (as in the
corresponding natural gas case - see table 8.5).
Of course, cogeneration strategies can also be pursued with
conventional steam turbine technology. However, as illustrated by the
calculation in table 8.8 for the same levels of electricity and process steam
generation as in the IGCC case,19 the fuel savings rate (5 percent)
and the reduction in the net cost of electricity (9 percent) are far less than
for the IGCC case. Moreover, a comparison of tables 8.7 and 8.8 shows that
although there is little difference in efficiency and cost for IGCC and
ultrasupercritical steam turbine technologies in producing electricity only,
IGCC technology is a markedly better performer in cogeneration applications.
TABLE 8.6. LARGE COMMERCIAL GASIFICATION-BASED PROJECTS
INVOLVING ELECTRICITY AS PRODUCT OR COPRODUCT
|
Location |
Plant owner |
Technology |
Syngas out (megawatts - thermal) |
Feedstock(s) |
Product(s) |
Start-up year |
|
Spain |
Repsol and Iberola |
Texaco |
1,654 |
Vacuum residues |
Electricity |
2004 |
|
Italy |
SARLUX srl |
Texaco |
1,067 |
Visbreaker residues |
Electricity, H2 |
2000 |
|
Italy |
ISAB Energy |
Texaco |
982 |
ROSE asphalt |
Electricity, H2 |
1999 |
|
France |
Total France, EdF, and Texaco |
Texaco |
895 |
Fuel oil |
Electricity, H2 |
2003 |
|
Netherlands |
Shell Nederland Raffinaderij BV |
Shell |
637 |
Visbreaker residues |
Electricity, H2 |
1997 |
|
Czech Republic |
SUV and EGT |
Lurgi Dry Ash |
636 |
Coal |
Electricity, steam |
1996 |
|
United States |
Public Service of Indiana |
Destec |
591 |
Bituminous Coal |
Electricity |
1995 |
|
Spain |
Elcogas SA |
PRENFLO |
588 |
Coal, petcoke |
Electricity |
1997 |
|
United States |
Motiva Enterprises LLC |
Texaco |
558 |
Fluid petcoke |
Electricity, steam |
1999 |
|
Italy |
API Raffineria de Ancona S.p.A. |
Texaco |
496 |
Visbreaker residues |
Electricity |
1999 |
|
Netherlands |
Demkolec BV |
Shell |
466 |
Bituminous Coal |
Electricity |
1994 |
|
United States |
Tampa Electric Company |
Texaco |
455 |
Coal |
Electricity |
1996 |
|
United States |
Exxon USA Inc. |
Texaco |
436 |
Petcoke |
Electricity, syngas |
2000 |
|
Singapore |
Esso Singapore Pty. Ltd. |
Texaco |
364 |
Residual oil |
Electricity, H2 |
2000 |
Source: Simbeck and Johnson,
1999.
Once gasification technology is established in the market, a
continuing stream of innovations can be expected to improve performance and
reduce costs - because there are many opportunities (van der Burgt, 1998; Holt,
1999a). One way innovation will take place is by relatively passively
incorporating continually improving gas turbine designs into IGCC systems - the
benefits of which are illustrated by the shift from air-cooled to steam-cooled
gas turbine blades in table 8.4. And if Tophat® turbines are
developed (see above), such systems used with gasified coal would be both less
capital-intensive and more energy-efficient than current IGCC systems - for
example, van der Burgt and van Liere (1996) estimate that with such cycles
overall efficiency would increase to about 50 percent.
Specific IGCC-related improvements might also be made. For
example, new gasifiers are needed that are well suited for coals with high ash
content (typical of many coals in China, India, and South Africa) and for
low-rank coals (which are abundant world-wide; see chapter 5), because
commercially available entrained-flow gasifiers are not well suited for such
coals. Fluidised-bed gasifiers are good candidates for these coals; such
gasifiers would also be better suited for handling most biomass and waste as
co-feedstocks than are entrained-flow gasifiers. Such technology, in the form of
the High Temperature Winkler gasifier, was demonstrated with brown coal at a
plant in Berrenrath, Germany, where the syngas was used to produce methanol
(Simbeck and others, 1993). An IGCC project based on the High Temperature
Winkler gasifier for coal fines has been proposed for construction in the Czech
Republic (Holt, 1999b).
One research and development focus is technology to clean gases
at high temperatures to reduce thermodynamic losses associated with thermal
cycling of gases exiting the gasifier.20 Such technology is being
pursued largely because it is necessary for successful development of IGCC
systems based on air-blown gasifiers and advanced pressurised fluidised-bed
combustion systems (see below). However, hot gas clean-up is not necessary for
IGCC systems with O2-blown gasifiers. The technology is challenging
(especially to realise the low emission levels achievable with present cold-gas
cleanup), and potential economic benefits are modest even if positive,
especially because coal prices are low and declining (Simbeck, 1995; Williams,
1999b).
Despite coal IGCC technical successes, there are few
opportunities for deploying the technology in the industrialised world, where
electricity demand is growing slowly, and where the NGCC is the technology of
choice wherever there is a need for new power supplies and natural gas is
available. The best potential opportunities for IGCC technology are in China and
other developing countries where natural gas is not readily available and rapid
growth in coal use is expected. There, IGCC technology could have enormous
positive impacts in reducing local and regional air pollution, while
substantially improving efficiencies and reducing greenhouse gas emissions. To
make initial deployment of IGCC technology economically interesting to such
countries, the first installations might be in cogeneration or polygeneration
(see below) configurations. As in the case of NGCC cogeneration, the key to
unlocking the cogeneration potential offered by IGCC technology is policies that
make competitive electricity prices available to these producers for the
electricity they wish to sell into electricity grids.
|
Encouraging competitive power
markets could help put
industry on a
path to fossil energy with near-zero
emissions by helping
launch syngas-
based polygeneration
activities. |
Small engines for cogeneration (reciprocating engines and
microturbines). IGCC cogeneration technologies are suitable for deployment
at scales of hundreds of megawatts; NGCC cogeneration technologies can be
deployed at scales from a few up to hundreds of megawatts. But many small
factories, commercial buildings, and apartment buildings would be good
candidates for clean, gas-based cogeneration if appropriate technologies were
available at scales from less than 100 kilowatts-electric to a few megawatts.
Both reciprocating engines and microturbines show promise as near-term
technologies for cogeneration at such scales.
From June 1997 through May 1998, world-wide sales of
reciprocating engines for stationary power markets totalled about 5,100 units
(9.6 gigawatts-electric of total capacity) - a gain of five times from 10 years
earlier (Wadman, 1998). More than half of the units will be for continuous
service.21 Although most units will use oil, 13 percent will use
natural gas or will be capable of using dual fuels. Gas applications might
expand markedly under increasingly competitive power market conditions.
For spark-ignited engines, shifting to natural gas involves
significant de-rating. Compression-ignition engines can also be converted to
gas, either by adding a spark plug or by using a liquid spark - a small amount
of diesel fuel for ignition. The latter approach is preferable with regard to
both first cost and efficiency. Compression-ignition engines with liquid sparks
bring to natural gas applications the low cost and high efficiencies of these
engines, with much less de-rating. Recent advances have reduced liquid spark
requirements for dual-fuel engines to 1 percent of system fuel requirements for
larger engines. Such engine generator sets are commercially available at scales
of 1 - 16 megawatts-electric with lower heating value (LHV) efficiencies of 39 -
42 percent.
Prices for both spark-ignited and dual-fuel engine generator
sets (for equipment only) for the capacity range under 1 megawatt-electric
typically lie in the range $425 - 600 per kilowatt-electric - prices that do not
include the costs for heat recovery equipment for cogeneration. Operation and
maintenance costs for reciprocating engines are typically significantly higher
than for combustion turbines. Reciprocating engines can be used for cogeneration
by recovering both high-quality heat from the engine exhaust and low-quality
heat from the engine jacket cooling water. Like gas turbines and combined
cycles, reciprocating engines are attractive for such applications because of
their high electricity-heat output ratios (see figure 8.1). Some reciprocating
engine vendors offer complete cogeneration package systems. Very small-scale
systems (under 100 kilowatts-electric) sell in the United States for $1,500 -
2,000 per kilowatt-electric. The engines for such systems last only 3 - 4 years,
but replacement engines cost only $75 per kilowatt-electric.
TABLE 8.7. COGENERATION VERSUS SEPARATE PRODUCTION OF
ELECTRICITY AND STEAM USING COMBINED CYCLE AND COAL GASIFICATION
TECHNOLOGIES
|
Rates of activity and costs |
Separate production facilities for electricity and
steam |
Cogeneration plant |
|
IGCC plant |
Industrial boiler |
Total |
|
|
Power generation rate (megawatts-electric) |
400 |
- |
400 |
400 |
|
Process steam production rate, 10-15 bar
(megawatts-thermal) |
- |
400 |
400 |
400 |
|
Coal input rate (terajoules per hour) |
3.20 |
1.65 |
4.85 |
3.88 |
|
First Law efficiency (percent) |
45.1 |
87.2 |
59.4 |
74.3 |
|
CO2 emission rate (tonnes per hour) |
274 |
142 |
416 |
333 |
|
Capital investment (millions of dollars) |
453 |
197 |
650 |
537 |
|
Annual energy production cost (millions of dollars per
year) |
|
|
|
|
|
Capital |
52.19 |
22.69 |
74.88 |
61.86 |
|
Operation and maintenance (4 percent of capital cost per year)
|
18.12 |
7.88 |
26.00 |
21.48 |
|
Fuel |
22.44 |
11.57 |
34.01 |
27.21 |
|
Total annual energy cost |
92.75 |
42.14 |
134.89 |
110.55 |
|
Specific cost of energy (dollars per thousand
kilowatt-hours) |
For power: |
For steam: |
|
For power: |
|
Gross cost |
33.1 |
15.0 |
- |
39.4 |
|
Credit for steam coproduct |
- |
- |
- |
-15.0 |
|
Net cost |
33.1 |
15.0 |
- |
24.4 |
Note: Based on calculations by Dale Simbeck, SFA
Pacific. Engineering plus contingencies are 10 percent of process capital
equipment costs; general facilities are 10 percent of process capital equipment
costs. The annual capital charge rate is 11.5 percent. The coal price is $1.00
per gigajoule (see note c, table 8.4). The annual average capacity factor is 80
percent. Both the stand-alone integrated gasifier combined cycle (IGCC) power
plant and the cogeneration plant use a Destec O2-blown coal gasifier
coupled to a combined cycle with steam-cooled gas turbine blades.
TABLE 8.8. COGENERATION VERSUS SEPARATE PRODUCTION OF
ELECTRICITY AND STEAM USING STEAM TURBINE AND PULVERIZED COAL COMBUSTION
TECHNOLOGIES
|
Rates of PCC activity and costs |
Separate production facilities for electricity and
steam |
Cogeneration plant |
|
PCC power plant |
Industrial boiler |
Total |
|
|
Power generation rate (megawatts-electric) |
400 |
- |
400 |
400 |
|
Process steam production rate, 10-15 bar
(megawatts-thermal) |
- |
400 |
400 |
400 |
|
Coal input rate (terajoules per hour) |
3.39 |
1.65 |
5.04 |
4.68 |
|
First Law efficiency (percent) |
42.4 |
87.2 |
57.1 |
61.6 |
|
CO2 emission rate (tonnes per hour) |
291 |
142 |
433 |
402 |
|
Capital investment (millions of dollars) |
453 |
197 |
650 |
612 |
|
Annual energy production cost (millions of dollars per
year) |
|
|
|
|
|
Capital |
52.19 |
22.69 |
74.88 |
70.50 |
|
Operation and maintenance (4 percent of capital cost per year)
|
18.12 |
7.88 |
26.00 |
24.48 |
|
Fuel |
23.77 |
11.57 |
35.34 |
32.82 |
|
Total annual energy cost |
94.08 |
42.14 |
136.22 |
127.8 |
|
Specific cost of energy (dollars per thousand
kilowatt-hours) |
For power: |
For steam: |
|
For power: |
|
Gross cost |
33.6 |
15.0 |
- |
45.6 |
|
Credit for steam coproduct |
- |
- |
- |
-15.0 |
|
Net cost |
33.6 |
15.0 |
- |
30.6 |
Note: Based on calculations by Dale Simbeck, SFA
Pacific. Engineering plus contingencies are 10 percent of process capital
equipment costs, as are general facilities. The annual capital charge rate is
11.5 percent. The coal price is $1.00 per gigajoule (see note c, table 8.4). The
average capacity factor is 80 percent. The pulverized coal combustion (PCC)
plant is an ultrasupercritical unit for the stand-alone power plant and a
sub-critical unit for the cogeneration plant.
Air pollutant emissions, especially NOx, are a
concern. Uncontrolled gas engines produce significant CO and non-methane
hydrocarbon emissions; however, relatively low-cost oxidation catalytic
converters can control such emissions. Most lean-burning, spark-ignited natural
gas engines and micro-liquid-spark, dual-fuel engines can achieve NOx
emission of 1.4 grams per kilowatt-hour (100 parts per million by volume
at 15 percent O2) - about 15 times the emission rate for large modern
NGCCs with state-of-the-art NOx controls (see table 8.1). Some
vendors now offer systems with half this level of emissions but at an energy
efficiency penalty of about 1 percentage point. In some areas (for example, many
parts of the United States), NOx emission regulations will severely
limit deployment of reciprocating engines for stationary power markets at scales
from 100 kilowatts-electric to 2 megawatts-electric.
Operation of reciprocating engines on town gas (that is, syngas)
is also feasible and would be an especially attractive option for
natural-gas-poor, coal-rich regions. There town gas could be produced from coal
at centralised facilities along with syngas for other poly-generation activities
and piped up to 30 kilometres to various distributed cogeneration facilities.
The air quality benefits of such gas-based technologies relative to direct coal
combustion would be especially important in countries such as China, where coal
is used for heating in small, inefficient boilers equipped with little or no air
pollution control equipment. However, such systems would not be pollution free.
Air emission concerns would be similar to those for reciprocating engines
operated on natural gas, except that NOx emissions might be higher
because of higher adiabatic flame temperatures.
Reciprocating engines can also be adapted to small-scale
operations in rural areas using either biogas (from anaerobic digesters) or
producer gas generated by thermochemical gasification of biomass (see Mukunda,
Dasappa, and Srinivasa, 1993; chapters 7 and 10).
Efforts under way to improve reciprocating engine markets for
stationary power include the five-year Advanced Reciprocating Engine Systems
(ARES) programme - being carried out by a consortium of U.S. manufacturers, the
U.S. Department of Energy, the Gas Research Institute, and the Southwest
Research Institute. ARES is targeting development of an advanced gas engine with
an efficiency of 50 percent (LHV basis) and a NOx output of 5 parts
per million by volume (including catalytic aftertreatment if necessary).
|
There is growing confidence
among scientists that
underground
sequestration of CO2 will prove
to be a major
option for
mitigating climate-
change risks. |
The microturbine is a gas turbine just entering the market for
applications at scales less than 100 kilo-watts-electric. Its development
recently got a boost as a result of its being chosen as a cruise missile engine.
One vendor has already launched the technology in the market, and several other
aerospace firms are getting ready to market it for stationary power
applications. Promoters project that it will do well in new highly competitive
distributed power markets (Craig, 1997).
The system involves a low-pressure ratio (3 to 4) gas turbine
and compressor mounted on a single shaft.22 The most promising models
available are air cooled and have variable speed generators (the output of which
is rectified and converted electronically to the alternating-current line
frequency), no gear-box, no lubricating oil requirements, and only one moving
part. Turbine blades are not cooled, turbine inlet temperatures are modest (840
degrees Celsius), but engine speeds are high - 80,000 revolutions a minute or
more. Conversion efficiencies with natural gas fuelling are 25 percent (LHV
basis) at full power output - far less than for large reciprocating engines but
comparable to reciprocating engine generator set efficiencies at scales of tens
of kilowatts-electric. Efficiency falls off at part load - to 75 percent of the
efficiency at full output when output falls to a third of the peak level
(Campanari, 1999).
Although electric efficiencies are not especially high, the
technology offers four attractive features:
· Potentially low
capital costs in mass production, because of the simple design.
· Low maintenance costs -
probably considerably lower than for reciprocating engines, because of the low
combustion temperature and the simple design’s expected higher reliability.
· Suitability for cogeneration,
because all waste heat is of high quality, in the form of hot (230 - 270 degrees
Celsius) air.
· The possibility of low
NOx emissions without stack gas controls.23
The microturbine faces competition from both reciprocating
engines and fuel cells. Maintenance and air quality issues will be important in
determining the outcome of competition with reciprocating engines. At scales of
hundreds of kilowatts-electric, it will be very difficult for microturbines to
compete in efficiency with reciprocating engines. Moreover, if the ARES
programme meets its NOx emissions reduction target, the competition
from reciprocating engine technology will be strong at all sizes for which such
emissions can be realised.
At the small scales (under 100 kilowatts-electric) that are the
focus for market development, the major competition will be from fuel cells -
for example, the proton exchange membrane (PEM) fuel cell (see below). Fuel
cells will be more efficient in producing electricity from natural gas and will
have lower air pollutant emissions. But microturbines will be better performers
in providing heat for cogeneration than PEM fuel cells, for which the waste heat
quality is low. And microturbines will probably be valued more by utilities as
peaking units than PEM fuel cells operated on natural gas, which cannot so
readily be dispatched to serve peaking needs.
Microturbines could have great appeal in markets where low-cost
gaseous fuels are available - for example, producer gas derived from low-cost
crop residues in rural areas of developing countries (chapter 10). They also
appear to be well suited for use as bottoming cycles for hybrid cycles that
employ pressurised molten carbonate or solid oxide fuel cells as topping cycles
(Campanari, 1999; Kartha, Kreutz, and Williams, 1997).
Fuel cells for stationary power and cogeneration. The
fuel cell converts fuel into electricity electrochemically, without first
burning it to produce heat (Kartha and Grimes, 1994). Fuel cells have attractive
features for electricity markets characterised by increasing competition and
environmental regulations: high thermodynamic efficiency, low maintenance
requirements, quiet operation, zero or near-zero air pollutant emissions without
exhaust-gas controls, and high reliability. Fuel cells are likely to be
economically viable even in small-scale (100 kilowatts-electric or less)
applications. Its properties make it possible to site systems in small,
unobtrusive generating facilities close to end users.
Such distributed power sources make cogeneration designs
economically attractive and offer the potential of reducing capital outlays for
electricity transmission and distribution equipment (Hoff, Wenger, and Farmer,
1996). Low-temperature phosphoric acid fuel cells (PAFCs) and proton exchange
membrane fuel cells (PEMCs) are well suited for combined heat and power
applications in small- to medium-scale commercial and residential buildings,
providing domestic hot water and space heating and cooling (Little, 1995;
Dunnison and Wilson, 1994). Developers of high-temperature molten carbonate fuel
cells (MCFCs) and solid-oxide fuel cells (SOFCs) target medium- to large-scale
industrial applications.
The PAFC, developed largely in Japan and the United States, is
the only commercial fuel cell. Several hundred PAFC power plants (mostly
200-kilowatt-electric natural-gas-fuelled units) are operating. Accumulated
experience has demonstrated that fuel cell power plants can be made to operate
reliably. Costs are high, however, and whether they can be reduced enough with
volume production to make the PAFC widely competitive is uncertain.
Because of recent technological advances, substantial U.S.,
European, and Japanese activities are seeking to accelerate commercialisation of
the PEMFC for residential and commercial building cogeneration markets (Dunnison
and Wilson, 1994; Little, 1995; Lloyd, 1999) as well as for transportation (see
below). Several companies are developing residential PEMFC combined heat and
power systems (Lloyd, 1999). Ballard Generation Systems plans to begin selling
250-kilowatts-electric system for commercial buildings by 2003 - 04; Plug Power
is focussing on smaller (less than 35-kilowatt-electric) units and plans to
install the first residential units by 2001.24 In initial
applications it is expected that most systems would use mainly existing natural
gas infrastructure and, like PAFCs, process natural gas at the point of use in
an external fuel processor into an H2-rich gas the fuel cell can use.
The best chances for making small fuel cells competitive are in
markets that value electricity highly (for example, in residential or other
buildings, where produced electricity must be less costly than the retail rate)
and where fuel cell waste heat can be used effectively. Space heating and
cooling markets are not well matched to PEMFC capabilities; space heating demand
is seasonal with enormous variation in the heating season; and the operating
PEMFC temperature (80 degrees Celsius) is too low to use waste heat for
heat-driven air conditioners.
However, domestic hot water demand often provides a good match -
demand is fairly level year-round, and the PEM operating temperature is well
suited for domestic hot water. Especially promising opportunities are where the
fuel cell is sized to meet the demand for domestic hot water, so that very
little waste heat is discarded. If the PEMFC size were increased to meet a
larger fraction of the electrical load, it would become more and more difficult
to compete, because more and more of the waste heat would have to be discarded,
reducing the credit (per kilowatt-hour of electricity) for waste heat
utilisation.
The economic prospects are best for apartment buildings, hotels,
and hospitals, where a centralised building-scale PEM fuel cell system serves
power and hot water needs throughout. It would be more difficult for such
systems to compete at the level of single-family dwellings for currently
expected PEMFC economies of scale (Kreutz and Ogden, 2000).
The high operating temperatures for MCFCs (600 - 650 degrees
Celsius) and SOFCs (1,000 degrees Celsius) make them well suited for
cogeneration, including applications that use the waste heat to operate
heat-driven air conditioners. They also offer the option of using directly
natural gas or syngas derived through gasification from coal or other feedstocks
without an external fuel processor - because these gases can be reformed (using
waste heat from fuel cell operation) and shifted on the anode into an
H2-rich gas the fuel cell can easily use - leading, potentially, to
higher efficiency, simplified operation, and increasing reliability. (But having
an external reformer offers the flexibility of being able to switch relatively
easily to operation on alternative fuels.)
The two principal vendors for MCFCs have been Energy Research
Corporation and MC Power. Energy Research Corporation units operate at
atmospheric pressure with internal reforming; MC Power units operate at pressure
but with an external reformer. A 1.8-megawatt-electric demonstration plant based
on Energy Research Corporation technology was built and operated on natural gas
beginning in April 1996 in Santa Clara, California; a peak efficiency of 40
percent was achieved. Because of various difficulties, the unit was operated for
only 4,000 hours and was dismantled in March 1997. In March 1999 Energy Research
Corporation put into operation a 250-kilowatt-electric demonstration unit at its
Danbury, Connecticut, headquarters. In 1997 MC Power operated a
250-kilowatt-electric cogeneration unit at the Naval (now Marine Corps) Mirimar
Air Station in San Diego, California. Unable to raise new funding for research
and development, MC Power went out of business in March 2000.
SOFCs offer the potential for high efficiency, low cost, and
potentially long operating lifetimes (Bakker, 1996). The main uncertainties
concern manufacturing costs and durability in operation as a result of the fact
that SOFCs are made of ceramics. Although the cost of the materials in the
ceramics is inherently low ($7 - 15 per kilowatt-electric; Goldstein, 1992),
fabrication of ceramics is difficult and costly. Moreover, there are risks that
the ceramic components will develop cracks during operation as a result of
thermal cycling.
Siemens Westinghouse, the leading SOFC developer, has focussed
on a tubular design and has deployed seven fully integrated, automatically
controlled, packaged SOFC systems as experimental field units. The largest of
these is a 100-kilowatt-electric natural-gas-fuelled cogeneration system
deployed in the Netherlands in early 1998. The system has realised extremely low
pollutant emissions - 0.2 parts per million by volume of NOx and
undetectable levels of sulphur dioxide (SO2), CO, and unburned
hydrocarbons (Veyo, 1998).
The tubular design facilitates manufacture and realisation of
properly operating seals, but it is uncertain how low costs can become in mass
production. Planar designs that operate at lower temperatures (800 degrees
Celsius)25 seem promising with regard to both high efficiency (55 -
70 percent on natural gas, LHV basis) and capital cost in mass production ($700
- 800 per kilowatt-electric at a scale of 500 kilowatts-electric; Chen, Wright,
and Krist, 1997). But such designs require considerable more research and
development.
In the 1970s and 1980s it was expected that high-temperature
fuel cells would eventually be able to compete with conventional power
generating technologies at a wide range of scales - including large
central-station power plants as well as cogeneration plants of all sizes. But
the enormous success of gas turbines and combined cycles dampened the prospects
for large-scale fuel cell applications during the early 1990s - when it became
apparent that the marginal efficiency gains offered by fuel cells over combined
cycles would not be able to justify the expected higher capital costs - except
in small-scale operations (1 megawatt-electric or less). However, since the
early 1990s two developments have once more brightened the prospects for
high-temperature fuel cells for larger-scale installations.
The first is a hybrid concept that offers both higher efficiency
and lower capital cost. A hybrid would be made up of a high-temperature fuel
cell topping cycle and a gas turbine or a steam turbine or gas turbine - steam
turbine combined cycle bottoming cycle. A high-temperature fuel cell operated on
natural gas or syngas will utilise only 80 - 90 percent of the gas energy. The
chemical energy remaining in the hot anode exhaust gases can be burned to
generate more electricity in a bottoming cycle. Modelling carried out at the
Electric Power Research Institute indicates that a 56 percent efficient
natural-gas-fuelled SOFC combined with a regenerative gas turbine bottoming
cycle could lead to a system efficiency of 71 percent (Bakker, 1996) -
efficiencies well above the levels that can be realised with gas turbine - steam
turbine combined cycles. Because the cost per kilowatt-electric of the bottoming
cycle will typically be less than the than the cost per kilowatt-electric for
the fuel cell itself, the overall capital cost for the hybrid will be less than
for a purebred fuel cell.
The second new development is related to the fact that
pressurised high-temperature fuel cells offer an option for low-cost CO2
recovery and disposal as a response to climate change concerns. The
concept is related to the fact that CO2 is available at high partial
pressure in the anode exhaust of pressurised SOFCs or MCFCs in highly
concentrated form. To illustrate, consider operation of a pressurised SOFC on
syngas (mainly CO and H2) derived from coal through
O2-blown gasification. Both the CO and the H2 react in the
anode directly with O2 (transported across the electrolyte from the
cathode as an oxygen ion) to form CO2 and H2O. If the 10 -
20 percent of the unconverted CO and H2 exiting the anode is then
burned in O2 for use in a bottoming cycle,26 the gaseous
product will be a mixture of CO2 and H2O, from which the
H2O can easily be removed by cooling and condensation. Moreover, if
the bottoming cycle is a steam turbine, the CO2 can be recovered for
disposal at relatively high pressure, leading to low costs for further
pressurising the CO2 to the level needed for disposal. Recognising
the value of this strategy, Shell announced in July 1999 plans to develop and
market with Siemens Westinghouse SOFC technology capable of disposing of
CO2 in this manner.27
|
BOX 8.2. DEEP OCEAN SEQUESTRATION OF ANTHROPOGENIC CARBON
DIOXIDE
The ocean, containing 40,000 gigatonnes of carbon (relative to
750 GtC in the atmosphere), represents the largest potential sink for
anthropogenic CO2; disposing in the ocean of an amount of CO2
that would otherwise lead to a doubling of the atmosphere’s content
would thus increase the ocean concentration by less than 2 percent. On a
1,000-year time scale, more than 90 percent of today’s anthro-pogenic
emissions will be transferred to the oceans through a slow, natural process. The
basic idea of ocean sequestration of CO2 is to inject CO2
directly into the deep ocean to accelerate this process and reduce both
peak atmospheric CO2 concentrations and their rate of increase.
For a large fraction of injected CO2 to remain in the
ocean, injection must be at great depths. This is because CO2 would
be a gas above 800 metres and a liquid below 800 metres. Liquid CO2
is negatively buoyant relative to ordinary seawater only below 3,000
metres. Liquid CO2 is negatively buoyant relative to seawater
saturated with CO2 only below 3,700 metres. And at injection depths
of about 500 metres or more, a CO2-seawater mixture (depending on the
relative compositions) can lead to formation of a CO2 hydrate, which
is about 10 percent denser than seawater.
A consensus is developing that the best near-term strategy would
be to discharge CO2 at depths of 1,000 - 1,500 metres, which can be
done with existing technology. A major uncertainty that requires more research
for clarification relates to the sequestration efficiency (the fraction of the
CO2 that remains in the ocean) of injection at such depths (see, for
example, Brewer and others, 1999). Another approach, aimed at maximising
sequestration efficiency, is to inject liquid CO2 into a deep
sea-floor depression, forming a stable deep lake at a depth of 4,000 metres - an
approach that is technologically challenging with current technology. A simple
and feasible but very costly option is to release dry ice from a surface ship.
Another approach is to create a dense CO2-seawater mixture at a depth
of 500 - 1,000 metres and cause it to form a sinking-bottom gravity current - an
approach that has raised many environmental impact concerns.
On a global scale, both climate change and other environmental
impacts of ocean disposal (for example, increased ocean acidity) are positive.
But on a local scale, there are considerable environmental concerns arising
largely as a result of the increased acidification near the points of injection
- for example, impacts on non-swimming marine organisms residing at depths of
1,000 metres or more.
Japan has the world’s most active ocean sequestration
research programme, led by the Research Institute of Innovative Technology for
the Earth and the Kansai Environmental Engineering Centre, and funded at an
annual level of more than 10 million dollars.
Although the deep ocean has been the most-discussed option for
CO2 disposal, much more research is needed to better understand the
security, costs, and environmental impacts of various ocean disposal schemes
(Turkenburg, 1992). In addition, the viability of ocean storage as a greenhouse
gas mitigation option hinges on social and political as well as technical,
economic, and environmental considerations. The public is generally cautious
regarding ocean projects. |
Source: Herzog, 1999b.
Decarbonisation and carbon dioxide sequestration strategies
for power generation systems. Because of climate change concerns, increasing
attention has been given in recent years to strategies for extracting energy
from fossil fuels without releasing CO2 into the atmosphere. The
issues involved concern the capacity, security, and cost of alternative CO2
disposal options and the costs of separating the CO2 from
fossil energy systems and preparing it for disposal.
The options for CO2 sequestration include both the
deep ocean and geological reservoirs. Although ocean disposal has received the
most attention (box 8.2), large uncertainties in its prospects (Turkenburg,
1992) have led to a shift of focus in recent years to give more attention to
geological (underground) storage of CO2, in depleted oil and natural
gas fields (including storage in conjunction with enhanced oil and gas
recovery), in deep coal beds (in conjunction with coal bed methane recovery),
and in deep saline aquifers.
CO2 injection for enhanced oil recovery (Blunt,
Fayers, and Orr, 1993), enhanced gas recovery (van der Burgt, Cantle, and
Boutkan, 1992; Blok and others, 1997), and enhanced recovery of deep coal bed
methane (Byrer and Guthrie, 1999; Gunter and others, 1997; Stevens and others,
1999; Williams, 1999a) might become profitable focuses of initial efforts to
sequester CO2. Enhanced oil recovery using CO2 injection
is well-established technology; one project that began in 2000 in Saskatchewan,
Canada, is injecting yearly up to 1.5 million tonnes of CO2, which is
transported 300 kilometres to the injection site from a synthetic natural gas
plant in North Dakota (see below).
Sequestration in depleted oil and gas fields is generally
thought to be a secure option if the original reservoir pressure is not exceeded
(van der Burgt, Cantle, and Boutkan, 1992; Summerfield and others, 1993). One
estimate of the prospective global sequestering capacity of such reservoirs
associated with past production plus proven reserves plus estimated undiscovered
conventional resources is 100 GtC for oil fields and 400 GtC for gas fields
(Hendriks, 1994). Other estimates are as low as 40 GtC for depleted oil fields
and 90 GtC for depleted gas fields, plus 20 GtC associated with enhanced oil
recovery (IPCC, 1996a). The range is wide because reservoir properties vary
greatly in their suitability for storage, and because oil and gas recovery may
have altered the formations and affected reservoir integrity. Much of the
prospective sequestering capacity will not be available until these fields are
nearly depleted of oil and gas.
|
A fierce global
competition is underway
to accelerate
the
development of fuel
cell vehicles. |
Deep aquifers are much more widely available than oil or gas
fields. Such aquifers underlie most sedimentary basins, the total areas of which
amount to 70 million square kilometres (two-thirds onshore and one-third
offshore), more than half the 130-million-square-kilometre land area of the
inhabited continents. Some sedimentary basins offer better prospects for
CO2 storage than others (Hitchon and others, 1999; Bachu and Gunter,
1999). To achieve high storage densities, CO2 should be stored at
supercritical pressures (more than about 75 times atmospheric pressure), which
typically requires storage at depths greater than 800 metres. The aquifers at
such depths are typically saline and not effectively connected to the much
shallower (typically less than 300-metre) sweet-water aquifers used by people.
If aquifer storage is limited to closed aquifers with structural traps, the
potential global sequestering capacity is relatively limited - about 50 GtC
(Hendriks, 1994), equivalent to less than 10 years of global CO2
production from burning fossil fuel at the current rate.
However, if structural traps are not required for effective
storage, potential aquifer storage capacity might be huge; estimates range from
2,700 GtC (Omerod, 1994) to 13,000 GtC (Hendriks, 1994). For comparison,
estimated remaining recoverable fossil fuel resources (excluding methane
hydrates) contain about 5,600 GtC (see table 5.7). A growing body of knowledge
indicates that many large horizontal open aquifers might provide effective
storage28 if the CO2 is injected far enough from reservoir
boundaries that it dissolves in the formation water or precipitates out as a
mineral as a result of reactions with the surrounding rock before migrating more
than a few kilometres towards the basin boundaries (Bachu, Gunter, and Perkins,
1994; Gunter, Perkins, and McCann, 1993; Socolow, 1997). The relatively new idea
that large horizontal aquifers can provide effective sequestration has
contributed to growing confidence among scientists that underground
sequestration of CO2 will prove to be a major option for mitigating
climate-change risks (Holloway, 1996; Socolow, 1997; PCAST Energy Research and
Development Panel, 1997).
Experience with aquifer disposal will be provided by two
projects involving injection into nearby aquifers of CO2 separated
from natural gas recovered from CO2-rich gas reservoirs. One is a
Statoil project begun in 1996 to recover 1 million tonnes of CO2 a
year from the Sleipner Vest offshore natural gas field in Norway (Kaarstad,
1992). The second, which will commence in 10 years, will involve the recovery of
more than 100 million tonnes a year (equivalent to 0.5 percent of total global
emissions from fossil fuel burning) from the Natuna natural gas field in the
South China Sea (71 percent of the reservoir gas is CO2) (IEA, 1996).
Extensive historical experience with underground gas storage
contributes to the growing scientific confidence in the reliability of
geological reservoirs for storing CO2. And regulations that have been
evolving for underground gas storage provide a good basis for defining the
issues associated with formulation of regulations for CO2 storage
(Gunter, Chalaturnyk, and Scott, 1999).
More research, field testing, modelling, and monitoring are
needed to narrow the uncertainties relating to CO2 storage in
geological reservoirs. From a policy perspective, it is particularly important
to understand better potential effective storage capacities on a
region-by-region basis so that energy and environmental planners will have a
better understanding of the overall potential for fossil fuel decarbonisation
with CO2 sequestration as an option for dealing with climate change.
Getting such important information is not likely to be especially costly. For
example, Stefan Bachu of the Alberta Research Council has estimated that
obtaining a reasonable estimate of the geological CO2 storage
capacity of Canada would cost $14 million (Gunter, 1999). The cost is relatively
low because geological surveys have collected an enormous amount of relevant
data during the past 100 years, and many more relevant data from industrial
sources are available from regulatory bodies.
Public acceptability issues are paramount. Fuel decarbonisation
with CO2 sequestration is unfamiliar to most people as a strategy for
dealing with the climate change challenge. What will public attitudes be? The
scientific community has a major responsibility to inform the public debates on
the various issues relating to safety and environmental impacts. Much can be
learned from both natural events (Holloway, 1997) and from the extensive
historical experience with use of CO2 injection for enhanced oil
recovery and with underground gas storage (Gunter, Chalaturnyk, and Scott,
1999). But more research is needed to clarify the issues.
An optimistic note on which to end this discussion: in the
sections that follow, it will be shown that those advanced fossil energy
technologies offering the potential for CO2 disposal at the least
costs are also characterised by near-zero emissions of air pollutants.
TABLE 8.9. ALTERNATIVE TECHNOLOGIES FOR REDUCING CO2
EMISSIONS FROM 400-MEGAWATT-ELECTRIC COAL PLANTS
|
Technology |
Efficiency (percent, HHV) |
Capital cost (dollars per kilowatt) |
Generation cost (dollars per thousand kilowatt-hours)
|
O2 requirements (tonnes per hour) |
CO2 emissions (grams of carbon per
kilowatt-hour) |
Cost of avoiding CO2 emissions (dollars per
tonne of carbon) |
|
Ultrasupercritical pulverised coal steam turbine plant
|
|
|
|
|
|
|
|
Reference, CO2 vented |
43.1 |
1,114 |
33.0 |
0 |
196 |
- |
|
CO2 recovery from flue gasses |
34.3 |
1,812 |
52.2 |
0 |
36.8 |
134 |
|
O2 firing, CO2 recovery from flue gasses
|
32.0 |
1,661 |
52.8 |
339 |
0 |
111 |
|
Pressurised fluidised-bed combustion plant |
|
|
|
|
|
|
|
Reference, CO2 vented |
43.1 |
1,114 |
33.0 |
0 |
196 |
- |
|
O2 firing, CO2 recovery from flue gasses
|
35.4 |
1,675 |
51.6 |
307 |
0 |
104 |
|
Integrated gasifier - combined cycle plant |
|
|
|
|
|
|
|
Reference, CO2 vented |
45.9 |
1,114 |
32.5 |
80 |
184 |
- |
|
Cold CO2 recovery from synthesis gas |
36.1 |
1,514 |
47.9 |
108 |
23.9 |
96 |
|
Warm CO2 recovery from synthesis gas (advanced
technology) |
41.5 |
1,466 |
44.5 |
94 |
20.4 |
73 |
|
H2-O2 Rankine cycle plant: Cold
CO2 recovery from synthesis gas (advanced technology) |
40.5 |
1,622 |
48.4 |
259 |
6.1 |
90 |
|
Solid oxide fuel cell (SOFC) plant |
|
|
|
|
|
|
|
H2-fueled SOFC - gas turbine - steam turbine plant,
warm CO2 recovery from synthesis gas (advanced technology) |
45.7 |
1,461 |
43.3 |
85 |
19.1 |
65 |
|
SOFC - steam turbine plant, CO2 recovered from anode
exhaust burned with O2 (advanced technology) |
44.3 |
1,427 |
43.1 |
114 |
6.8 |
60 |
Note: Based on calculations by Dale Simbeck, SFA
Pacific. Engineering and contingencies are 10 percent of process capital
equipment costs; general facilities are 10 percent of process capital equipment
costs. The annual capital charge rate is 11.5 percent. The coal price is $1.00
per gigajoule. The annual average capacity factor is 80 percent. All options
involving CO2 separation and disposal include the cost of compressing
the separated CO2 to 135 bar plus a cost of $5 per tonne of CO2
($18 per tonne of carbon) for pipeline transmission and ultimate
disposal.
People are likely to be more willing to accept fuel
decarbonisation with CO2 sequestration as a major energy
option if the technology also offers near-zero emissions than if they view it as
a way to sustain a dirty energy system - away from which they would rather
evolve.
Table 8.9 presents performance and cost calculations (developed
in a self-consistent manner across options) for eight alternative technologies
and strategies for CO2 removal and disposal for coal-fired power
systems - variants of calculations developed earlier by Simbeck (1999c). Four
options are based on current or near-term (before 2005) technologies. The other
four (labelled advanced technology) require considerable technological
development. The H2-O2 Rankine cycle plant involves
producing H2 through coal gasification and burning it with O2
in a Rankine cycle - a technology proposed by Westinghouse researchers
(Bannister and others, 1996; Bannister, Newby, and Yang, 1997, 1998). The
turbine in this system looks like a gas turbine in the high-pressure stages but
a steam turbine at the condensing end - because the combustion of H2
in O2 leads to the production of only steam. If there were a
market for the turbine used in this system, it could probably be developed in
2010 - 20. The SOFC options require commercialisation of SOFC power technology,
which developers expect to take place before 2010. The two warm gas recovery
options require the development of relatively challenging advanced gas
separation technologies, which could be commercial by 2015.
The CO2 separation and disposal options are compared
with three reference technologies for power generation without CO2
removal and disposal: an ultrasupercritical steam-electric plant (see
below), a pressurised fluidised-bed combustion plant (see below), and an IGCC
plant (the Frame 7H option described in table 8.4). Identical capital costs are
assumed for these reference plants: Not only is this a reasonable approximation,
but also this assumption helps clarify cost differences for CO2
separation and disposal among alternatives.29 The cost of
avoided CO2 emissions for each case is calculated relative to the
least costly option in the table (the reference IGCC case, with CO2
venting).
The first CO2 recovery option involves CO2
scrubbing from the stack gases of an ultrasupercritical steam-electric
plant using an amine solution (flue gas scrubbing). The cost of avoiding
CO2 emissions and the power generation cost penalty are relatively
high ($134 per tonne of carbon and $0.020 per kilowatt-hour), largely because of
the high cost penalties associated with recovering CO2 from the stack
gases, where its concentration and partial pressure are low (15 percent and 0.15
bar, respectively).
The second option uses atmospheric pressure O2 rather
than air as oxidant, and recycles the separated CO2 back to the ultra
supercritical steam plant combustor. This strategy greatly increases the partial
pressure of CO2 in the flue gas. Cost penalties are comparable to
those for flue gas recovery because of the large quantities of costly O2
required. The third option is for a pressurised fluidised-bed combustion
unit that uses pressurised O2 as the oxidant instead of pressurised
air. This further increases the CO2 partial pressure in the flue gas
and reduces CO2 removal costs; however, because pressurised O2
is more costly than O2 at atmospheric pressure, the savings
relative to the ultra-supercritical steam-electric cases is modest.
|
The air pollution emissions issue will be
in centre stage
during the competition
between fuel cell and hybrid internal
combustion
engine vehicles
to be car of the
future. |
The five remaining options - which have avoided CO2
emission costs that are much lower than for the first three - are for
systems involving O2-blown gasifiers. The first, cold CO2
recovery from synthesis gas for IGCC plants, is based on existing CO2
recovery technology. This option starts with gasification to produce
syngas (mainly CO and H2). The syngas is reacted with steam in shift
reactors to convert CO into H2 and CO2. Subsequently,
CO2 is separated out for disposal, and the H2-rich fuel
gas is burned in the gas turbine combustor.30 This option has the
least cost penalties of all the near-term options ($96 per tonne of carbon and
$0.015 per kilowatt-hour). The low cost is realised largely because, when
CO2 is recovered from the shifted syngas in an IGCC, its
concentration is high (33 percent), as is its partial pressure (more than 10
bar). The advanced technology option labelled warm CO2 recovery from
synthesis gas for IGCC plants, could - if successfully developed - reduce
avoided CO2 emission costs by a fourth relative to the cold gas
recovery option. For the advanced technology option labelled cold CO2
recovery from synthesis gas for an H2-O2 Rankine
cycle, the H2-O2 turbine capital cost is expected to be
relatively low, and the efficiency of converting H2 into electricity
high. However, the system requires large quantities of costly O2. As
a result this system would not improve on the least costly current technology
option - cold CO2 recovery from synthesis gas for an IGCC plant.
The last two entries depend on the successful development of
SOFC technology. The penultimate entry also depends on the success of warm-gas
separation technology. The last entry is the least costly of the advanced
technology options - involving recovery of CO2 at pressure from the
anode exhaust (see above). This technology would provide electricity from coal
with only 3 percent of the CO2 emissions for the conventional coal
steam-electric plant at a generation cost of $0.043 per kilowatt-hour, for an
avoided CO2 emission cost of $60 per tonne of carbon.31
This is about $0.01 per kilowatt-hour more than the cost of electricity
from a coal-fired power plant today with no CO2 removal and
sequestration. This is consistent with findings by a group at the Massachusetts
Institute of Technology (MIT) Energy Laboratory that, with advanced IGCC
technology (expected to be commercially available by 2012), the cost penalty for
decarbonisation and sequestration would be less than $0.01 per kilowatt-hour
(Herzog, 1999a).
An implicit assumption for these calculations is that a new coal
plant is the least costly option - for example, the calculations are appropriate
for coal-rich, natural-gas-poor countries. If natural gas were available, the
cost of CO2 emissions avoided by CO2 recovery and disposal
at a coal plant would typically be higher. Table 8.10 presents calculations,
also based on Simbeck (1999c), that illustrate the situation for near-term
(before 2005) technology when NGCCs and coal IGCCs are competing, and emission
reductions of 90 percent are considered for both. The IGCC option is the IGCC
with cold CO2 recovery from table 8.9. For NGCCs, two CO2
separation-and-disposal options are considered. The least costly option
involves scrubbing CO2 from flue gases.
TABLE 8.10. THE COST OF ELECTRICITY FROM COAL AND NATURAL
GAS WITH AND WITHOUT CO2 SEQUESTRATION, BASED ON NEAR-TERM
TECHNOLOGIES
|
Rates of activity and costs |
USC steama |
Natural gas-fired combined cycleb |
Coal IGCCb |
|
CO2 sequestered? |
No |
No |
Yes |
Yes |
No |
Yes |
|
CO2 separation method |
- |
- |
FGSc |
NG®H2c |
- |
Syngas®H2
|
|
Efficiency (percent, HHV basis) |
43.1 |
54.0 |
45.7 |
42.2 |
45.9 |
36.1 |
|
Emission rate (grams of carbon per kilowatt-hour) |
196 |
90 |
15.7 |
11.6 |
184 |
23.9 |
|
CO2 disposal rate (grams of carbon per
kilowatt-hour) |
- |
- |
91 |
104 |
- |
210 |
|
Capital cost (dollars per kilowatt) |
1,114 |
416 |
907 |
918 |
1,114 |
1,514 |
|
Generation costd (dollars per thousand
kilowatt-hours) |
|
|
|
|
|
|
|
Capital |
18.30 |
6.83 |
14.90 |
15.08 |
18.30 |
24.87 |
|
Operation and maintenance |
6.35 |
2.37 |
5.17 |
5.24 |
6.35 |
8.64 |
|
Fuel |
8.35·PC |
6.67·PNG |
7.88·PNG |
8.53·PNG |
7.84·PC |
9.97·PC |
|
CO2 disposal (at $5 per tonne of
CO2)e |
- |
- |
1.66 |
1.90 |
- |
4.38 |
|
Total generation costf |
24.65+8.35·PC |
9.20+6.67·PNG |
21.73+7.88·PNG
|
22.22+8.53·PNG
|
24.65+7.84·PC |
37.89+9.97·PC |
|
|
at 1998 U.S. fuel prices |
34.6 |
23.8 |
39.5 |
41.5 |
34.0 |
49.8 |
|
|
at 2020 U.S. fuel prices |
32.0 |
29.7 |
45.9 |
48.4 |
31.6 |
46.7 |
|
Avoided CO2 emissions cost, relative to same
technology without separation and disposal (dollars per tonne of carbon, for
2020 U.S. fuel prices)g |
- |
- |
219 |
236 |
- |
96 |
|
Electricity cost (dollars per thousand kilowatt-hours), for
2020 U.S. fuel prices and $219 tax per tonne of carbon |
74.9 |
49.3 |
49.3 |
51.0 |
71.8 |
51.9 |
a. For a 400-megawatt-electric, pulverised-coal,
ultrasupercritical steam-electric plant; see table 8.9. b. Based on an analysis
developed in Simbeck (1999c); coal IGCC technologies are the same as for
reference and cold CO2 recovery cases in table 8.9. c. FGS = flue gas
scrubber; for NG®H2 case, natural gas
(NG) is converted to H2 using an O2-autothermal reformer.
d. Annual capital charge rate = 11.5 percent; annual operation and maintenance
cost = 4 percent of capital cost; PC = coal price, PNG =
natural gas price (dollars per gigajoule). e. To account for pipeline
transmission and ultimate disposal costs. f. For 1998: PC
= $1.19 per gigajoule; PNG = $2.26 per gigajoule, average U.S.
prices for electric generators (EIA, 1999b). For 2020: PC = $0.88 per
gigajoule; PNG = $3.07 per gigajoule, average U.S. prices projected
for electric generators in the Energy Information Administration's reference
scenario (EIA, 1998a). g. Avoided cost = (generation cost with sequestration
minus generation cost without sequestration) divided by (emissions without
sequestration minus emissions with sequestration).
Even though removal of twice as much CO2 per
kilowatt-hour is required for the IGCC case, the cost penalty per kilowatt-hour
of CO2 separation and disposal is not greater than for the NGCC case.
This counterintuitive result arises because scrubbing CO2 from NGCC
flue gases is more capital- and energy-intensive than recovering CO2
from IGCC fuel gas. H2 could also be made from natural
gas by reforming. But as shown, with current technology doing so would not be
less costly than scrubbing flue gas, because the gain in reduced cost by
avoiding the flue gas scrubber would be offset by the added costs for reformer
and shift reactors.32
One result of the analysis shown in table 8.10 is that - for the
CO2 recovery-and-disposal cases and 2020 U.S. fuel prices - the costs
of generating electricity from natural gas and coal are about the same ($0.046 -
0.047 per kilowatt-hour). The findings of Herzog (1999a) - who considered
improvements in the technologies relative to the cases presented in table 8.10
and which he projected would be commercial by 2012 - indicate that this cost
parity between coal and natural gas systems is likely to hold even when
technological improvements are taken into account for natural gas as well as
coal technologies.33
The last row in table 8.10 shows the electric generating costs
with a carbon tax high enough to induce NGCC power generators (as well as coal
IGCC power generators) to separate and dispose of CO2. This tax ($220
per tonne of carbon) is 2.3 times the carbon tax needed if there were no
competition from natural gas. The cost of power generation (including the carbon
tax) would be $0.05 per kilowatt-hour for all options except coal plants without
CO2 separation and disposal. With the advanced technologies
considered by Herzog (1999a), the carbon tax needed to induce CO2
recovery and disposal for NGCC plants would be less ($170 versus $70 per
tonne of carbon for coal IGCC plants).
The technologies considered here for CO2 recovery and
disposal do not exhaust the possibilities. A class of advanced technologies that
offers considerable promise of increasing system efficiency and reducing
CO2 removal costs for both natural gas and coal power systems
involves using inorganic membranes that are highly permeable to H2
but not other gases. If such membranes were applied to natural gas
combined cycles, they might make it possible to carry out simultaneously steam
reforming, water gas shifting, and H2 separation in a single vessel.
Continuous H2 removal by the membrane might make it feasible to carry
out reforming reactions at temperatures low enough that gas turbine exhaust heat
could be used to provide the needed heat (Moritsuka, 1999). (The application of
such technologies to coal systems is discussed below.)
Advanced fuels for transportation and other applications
This section discusses the prospects for using advanced fuels to
satisfy the sustainable development objectives of keeping fuels affordable,
increasing energy security, and evolving towards near-zero emissions of both air
pollutants and greenhouse gases. The focus here is mainly on transport fuels
that can be derived from syngas, with some reference to synthetic cooking fuels.
(The prospects for synthetic fuels derived by direct coal liquefaction are
discussed in the next section below.) This discussion of transport fuels is
presented in the context of the associated vehicle technologies and the
challenges posed by various fuel-vehicle combinations.
Oxygenated fuels: the current focus. U.S. fuel
improvement efforts have focussed on reducing levels of benzene (an extremely
carcinogenic aromatic compound) in gasoline and on adding oxygenates such as
methyl tertiary butyl ether (MTBE) to gasoline to reduce CO emissions and
inhibit photochemical smog formation, while maintaining octane ratings that
would otherwise fall as a result of lead removal. Although oxygenates are
effective in reducing CO emissions and maintaining octane rating, they offer
negligible benefits in reducing atmospheric ozone formation (Calvert and others,
1993).
MTBE derived from methanol (MeOH) is widely added to gasoline in
volumetric quantities up to 15 percent to help control CO emissions. About 30
percent of the U.S. population lives in areas where MTBE is in regular use; U.S.
production levels reached more than 6 million tonnes in 1995. But MTBE use in
the future is likely to be severely limited. In July 1999 the U.S. Environmental
Protection Agency announced that it would act to greatly reduce the use of MTBE
in reformulated gasoline, and in December 1999 the California Air Resources
Board banned the use of MTBE in reformulated gasoline in California beginning in
2003.
The shift from MTBE is taking place not only because its air
quality benefits appear to be marginal, but also because it is extremely soluble
and persistent in water, and humans may be experiencing prolonged exposure to it
through tap water. Although it is not especially harmful to humans at typical
exposure levels, it imparts a bitter taste and solvent-like odour to water that
it contaminates - and human taste and odour thresholds are extremely low (40
parts per billion). MTBE enters drinking water through leaks in gasoline tanks
or spills into surface water or groundwater. Although tank leaks also release
benzene and many other aromatic and non-aromatic compounds, MTBE tends to
migrate faster than other contaminants and is likely to be at the leading edge
of a travelling plume (Stern and Tardiff, 1997).
Alcohols. Alcohols (methanol and ethanol) have attracted
considerable interest as alternative automotive fuels, especially in Brazil and
the United States. The production from biomass of ethanol through biological
processes and methanol through t hermochemical processes that begin with
thermochemical gasification are discussed in chapter 7.
MeOH can be produced from any carbonaceous feedstock through
processes that begin with syngas production - for example, from natural gas
through steam reforming, from coal through O2- blown gasification, or
from biomass through steam gasification (Williams and others, 1995). Nearly all
MeOH is produced from low-cost sources of natural gas, which are often available
at remote sites where a natural gas pipeline infrastructure has not been
established. Because MeOH is an easily transported liquid, its production from
remote gas sources provides a means of exploiting such resources. Most MeOH is
used as a chemical feedstock. Its use as a fuel has mainly been for MTBE
manufacture. In addition, modest amounts have been used directly in blends with
gasoline for cars. With conventional technology, the cost of making it from coal
is much greater than from natural gas, because the added capital cost for
gasification generally cannot be adequately compensated for by the lower cost of
coal relative to natural gas.
Although the use of alcohol fuels in vehicles with internal
combustion engines can lead to reduced oil dependence, it is now generally
believed that alcohol fuels - especially when blended with gasoline and used in
flexible-fuel internal combustion engine vehicles - offer little or no air
quality advantages other than lower CO emissions (Calvert and others, 1993).
Moreover, reformulated gasoline can meet or surpass the air pollution reductions
of alcohol-gasoline blends (CTOFM, 1991). With MeOH, CO emissions would be
reduced, and emissions of volatile organic compounds would be less problematic
than for gasoline. NOx emissions would probably not be reduced,
however. Ethanol offers fewer air quality benefits than MeOH and may produce
more ozone per carbon atom (Calvert and others, 1993).
Emissions from alcohol-fuelled fuel cell vehicles would be a
tiny fraction of the emissions from gasoline-fuelled internal combustion engine
vehicles. Moreover, the use of alcohols in fuel cell vehicles would lead to
marked improvements in fuel economy relative to their use in internal combustion
engine vehicles. Several auto manufacturers plan to launch fuel cell vehicles in
the market using MeOH as fuel (see below).
If MeOH were to become widely used as an energy carrier for
transportation, a concern is its toxicity through direct ingestion, absorption
through the skin, or ingestion as a result of drinking methanol-contaminated
groundwater.34 Detailed risk assessments indicate that toxicity is
not likely to be a significant concern in routine use, although it might be
problematic for accidents involving large spills (Health Effects Institute,
1987). In the case of groundwater contamination, risks are generally much less
than for MTBE, because in most situations MeOH would degrade quickly. But oil
companies - having been burned by recent decisions to ban MTBE after having made
enormous investments in MTBE production, and concerned about liability issues
relating to MeOH’s toxicity - might be reluctant to make major investments
in MeOH, especially if there are promising non-toxic, clean alternative fuels.
The need for a policy framework for transport fuels and
engines. The discussions of MTBE and alcohol fuels highlight the lack of a
coherent, consistent policy framework for developing advanced fuels and engines
for transportation. Closely related to these discussions is the emerging view
that environmental regulations are not focussed on the most important
pollutants.
Recent studies indicate that by far the greatest costs
associated with health impacts arising from transport-related air pollutant
emissions are those from fine particles (chapter 3) - both those emitted from
vehicles directly and nitrate particles formed in the atmosphere from NOx
emissions. Spadaro and Rabl (1998) estimate that relative to the costs
associated with fine particles the health costs posed by CO emissions are
negligible, and health costs associated with ozone formation are modest (see
table 8.2). It thus appears that concerns about NOx and particulate
emissions will shape future technological choices for fuels and engines.
Besides the lack of a properly focused environmental policy, low
oil prices and gasoline taxes also provide no market incentive in the United
States for fuel-efficient cars. There the trend has been towards an increasing
market share of fuel-guzzling sport utility vehicles - exacerbating concerns
about energy supply security and emissions of air pollutants and CO2.
One auspicious development from Japan is recent
commercialisation of a gasoline-fuelled car powered by a hybrid of an internal
combustion engine and a battery. This hybrid offers fuel economy twice that of
conventional cars with internal combustion engines. Their high efficiency and
the fact that they can be operated most of the time near their optimal operating
points make it feasible to achieve much lower emissions with gasoline hybrids
than with conventional internal combustion engine vehicles.
Advanced hybrid vehicles are being developed under the U.S.
Partnership for a New Generation of Vehicles (PNGV), a government-industry
initiative that seeks to develop production-ready prototypes that will get 80
miles a gallon (34 kilometres a litre) by 2004 (NRC, 1998). Because this goal is
three times the fuel economy of existing cars, emphasis is being given to
hybrids based on compression ignition engines (specifically,
compression-ignition direct-injection, or CIDI, engines), which are more fuel
efficient than spark-ignited hybrids. The CIDI hybrid and the fuel cell car (see
below) are the leading contenders to meet PNGV goals for the car of the future.
But the ambitious PNGV research and development programme is not
complemented by incentives to introduce such fuel-efficient vehicles into the
market. Moreover, unlike the situation with gasoline hybrids, there is no strong
air quality driver for advancing CIDI hybrids. To the contrary, air pollution
mitigation challenges are far more daunting for compression-ignition than for
spark-ignited engines (see table 8.2). In early 2000 DaimlerChrysler introduced
a prototype CIDI hybrid car developed under the PNGV that got 72 miles a gallon
(30.6 kilometres a litre). Although this car met the air quality standards in
effect in 1993, when the PNGV was launched, the current design cannot meet the
standards that will be in effect in 2005, when such cars might first be produced
on a commercial basis.
There is also a need for better coordination between development
activities for fuels and engines. There are needs not only for new fuels but
also new engines that are optimised for these fuels.
Syngas-derived fuels for compression-ignition engines and
other applications. Compression-ignition engines play major roles in
transport, where they are used for buses, trucks, and trains, and in some
regions (such as Europe) for cars as well. Such engines are especially important
for developing and transition economies, where in 1996 diesel fuel accounted for
half of all transport fuel (relative to a fifth in the United States; EIA,
1999a). The efficiency benefits offered by these engines will be even more
important in the future as transport demand grows. For example, the World Energy
Council’s 1995 market rules scenario projects that the number of cars will
grow by six times between 1990 and 2020 in developing and transition economies,
from 95 million to 580 million (WEC, 1995). Both improved engines and improved
fuels will be needed to help mitigate the challenges that such growth poses for
energy supply security, air quality, and greenhouse gases.
CIDI engines are promising advanced technologies for improving
efficiency, especially when used in hybrid vehicles. Concerns about CIDI hybrids
include high costs and whether they will be able to meet expected tougher
regulatory goals for NOx and particulate emissions. In its fourth
review of the PNGV, the U.S. National Research Council urged the PNGV to
consider shifting emphasis in its CIDI research to non-hybrid versions, in light
of the high costs of hybrids (NRC, 1998).
Among the leading candidate fuels for addressing the challenges
posed by compression-ignition engines are synthetic middle distillates (SMDs)
and dimethyl ether (DME). SMDs are straight-chain hydro-carbon fuels (paraffins
and olefins) produced through the Fischer-Tropsch (F-T) process. The F-T process
begins with the production of syngas from a carbonaceous feedstock - for
example, from natural gas through steam reforming or partial oxidation, or from
coal through O2-blown gasification and even from biomass through
gasification.
SMDs are well suited for use in compression-ignition engines, in
part because of their high cetane numbers.35 Moreover, they contain
no benzene, other aromatic compounds, or sulphur. Measurements have shown 13 -
37 percent reductions in particulate emissions and 6 - 28 percent reductions in
NOx emissions relative to operation on diesel fuel (Sirman, Owens,
and Whitney, 1998; Schaberg and others, 1997; Norton and others, 1998). Even
greater reductions would be likely if the engines were optimised for use with
these fuels, including exhaust gas aftertreatment as well as engine
modifications.
The well-established F-T technology for making SMDs can be used
with either natural gas or coal as feedstock. Near-term activities will be
focussed on use of low-cost supplies of natural gas. Despite high production
costs, Shell’s small, natural-gas-based Malaysian SMD plant (12,500 barrels
a day; see below) made money by selling SMDs for making blends with ordinary
diesel fuel to enable compression-ignition engines to meet the tough air
pollution standards in California and by selling high-value coproducts (for
example, waxes) in niche markets.36
Efforts to reduce costs will involve building larger plants. For
example, Exxon is considering building a large (50,000 - 100,000 barrels a day)
SMD plant in Qatar as a strategy for developing that country’s vast
low-cost gas supplies (Fritsch, 1996; Corzine, 1997). Reducing costs will also
involve pursuing polygeneration strategies (see the next section).
Another candidate fuel for compression ignition engines is DME,
an oxygenated fuel that can be produced from any carbonaceous feedstock by a
process that begins, as in the case of MeOH and SMDs, with syngas production.
Today DME is produced (150,000 tonnes a year) mainly to provide a replacement
for chlorofluoro-carbons as a propellant in aerosol spray cans. Not only does
DME not harm the ozone layer (it degrades quickly in the troposphere), but it is
non-toxic and non-carcinogenic.
For compression ignition engine applications, DME offers a high
cetane number and the potential to achieve low emissions without tailpipe
emission controls. Because DME has no carbon-carbon bonds, soot emissions from
its combustion are zero. In addition, NOx emissions can be
substantially less than with ordinary diesel fuel. Truck engine emission tests
show that NOx emission are down 55 - 60 percent and particle
emissions are down 75 percent relative to diesel fuel. Residual particle
emissions appear to come from the lubricating oil (Fleisch and Meurer, 1995).
DME has also been identified as an especially promising clean
cooking fuel (Chen and Niu, 1995). Its wide availability in developing countries
could dramatically mitigate the horrendous air pollution health impacts from
burning biomass and coal for cooking (chapters 3 and 10). The main drawback of
DME is that at atmospheric pressure it boils at - 25 degrees Celsius, so it must
be stored in moderately pressurised (9-bar) tanks (much as liquid petroleum gas,
which boils at - 42 degrees Celsius, is stored). Thus infrastructure challenges
would be more demanding in shifting to DME than in shifting to SMDs. But this is
not a show-stopper.
|
The fossil energy system can evolve in ways
consistent with
sustainable development
objectives if public policies guide a
high rate of
innovation toward
super-clean fossil energy
technologies |
Today DME is produced by catalytic dehydration of MeOH and is
thus more costly than MeOH. However, an advanced single-step process under
development by Haldor Topsoe would make it possible to make DME from natural gas
at higher efficiency and less cost than for MeOH. Haldor Topsoe and Amoco have
estimated that if DME were produced in large plants in areas with low-cost
natural gas, it could be produced at costs not much higher than comparable
diesel prices, taking into account the environmental benefits of DME (Hansen and
others, 1995). Also promising is the outlook for DME production in
polygeneration systems (see below).
It is very likely that fuel strategies will have to be
complemented by engine strategies to realise needed low levels of emissions from
compression-ignition engines. The possibilities include the use of high-pressure
fuel injectors, of catalytic converters to reduce the soluble organic fraction
of the particulates, and of particulate traps positioned in the engine exhaust
stream - along with some means of burning off the collected particulate matter,
most of which is soot (Walsh, 1995; 1997). One new twist is that new engines and
exhaust controls being developed to dramatically reduce the mass concentration
of particles, in response to tightening air quality regulations, seem to give
rise to larger number concentrations (Kittelson, 1998; Bagley and others, 1996;
Kruger and others, 1997; Mayer and others, 1995).37 The larger number
concentrations might be problematic because of growing concerns about health
impacts of small particle pollutants - although the public health implications
of this emissions shift are unclear because of the paucity of data.
Although there are many promising technological opportunities to
reduce emissions from compression-ignition engines, it is not clear if advanced
fuel and engine technological strategies will be adequate to address air quality
challenges fully. The fuel cell is a competing technology for addressing these
challenges (see below).
Polygeneration strategies for synthetic fuels production.
Just as cogeneration can lead to improved economics relative to production of
electricity and process steam in separate facilities (see tables 8.5 and 8.7),
so can synthetic fuel production economics be improved by polygeneration -
including as coproducts various combinations of electricity, steam, town gas,
and chemicals. Especially promising are strategies that coproduce electricity
and synthetic fuels from syngas in once-through processes - in which syngas is
passed once through a reactor to produce synthetic fuel, and the unconverted
syngas is burned to produce electricity in a combined cycle.
Once-through processes are well matched to new liquid-phase
reactors. With conventional gas-phase reactors, relatively low conversions are
achieved in a single syngas pass through the reactor, so that syngas is usually
recycled to achieve higher conversions using recycling equipment that is
typically capital- and energy-intensive. New liquid-phase reactors - which
involve bubbling syngas through a column of heavy oil in which catalysts
appropriate to the desired conversion are suspended - offer outstanding heat
removal capability in controlling highly exothermic reactions and can achieve
high conversions in a single pass, making recycling less attractive and
once-through conversion more attractive.
TABLE 8.11. TRIGENERATION VERSUS SEPARATE PRODUCTION
OF METHANOL AND COGENERATION USING COAL GASIFICATION TECHNOLOGY
|
Rates of activity and costs |
Separate production facilities for MeOH and
cogeneration |
Trigeneration plant |
|
MeOH plant |
Cogeneration plant |
Total |
|
|
Power generation rate (megawatts-electric) |
- |
400 |
400 |
400 |
|
Process steam production rate, 10-15 bar
(megawatts-thermal) |
- |
400 |
400 |
400 |
|
Methanol production rate (megawatts-thermal) |
400 |
- |
400 |
400 |
|
Coal input rate (terajoules per hour) |
2.46 |
3.88 |
6.34 |
6.46 |
|
First Law efficiency (percent) |
58.6 |
74.3 |
68.1 |
66.9 |
|
CO2 emission rate (tonnes per hour) |
211 |
333 |
544 |
555 |
|
Capital investment (millions of dollars) |
379 |
537 |
916 |
700 |
|
Annual energy production cost (millions of dollars per
year) |
|
|
|
|
|
Capital |
43.66 |
61.86 |
105.52 |
80.64 |
|
Operation and maintenance (4 percent of capital cost per year)
|
15.16 |
21.48 |
36.64 |
28.00 |
|
Fuel |
17.25 |
27.21 |
44.46 |
45.30 |
|
Total annual energy cost |
76.07 |
110.55 |
186.62 |
153.94 |
|
Specific cost of energy (dollars per thousand
kilowatt-hours) |
For MeOH: |
For power: |
|
For MeOH: |
|
Gross cost |
27.1 |
39.4 |
- |
54.9 |
|
Credit for steam coproduct |
- |
-15.0 |
- |
-15.0 |
|
Credit for electricity coproduct |
- |
- |
- |
-24.4 |
|
Net cost |
27.1 ($0.12 per litre) |
24.4 |
- |
15.5 ($0.07 per litre) |
Note: Based on calculations by Robert Moore
(formerly Air Products), building on Dale Simbeck’s analysis in table 8.7
for a gasification-based cogeneration plant, assuming Air Products’
liquid-phase reactor for MeOH production. Engineering plus contingencies and
general facilities are each 10 percent of process capital equipment costs. The
annual capital charge rate is 11.5 percent. The coal price is $1 per gigajoule
(see note c, table 8.4). The annual average capacity factor is 80
percent.
TABLE 8.12. QUADGENERATION VERSUS SEPARATE PRODUCTION OF
TOWN GAS AND TRIGENERATION USING COAL GASIFICATION TECHNOLOGY
|
Rates of activity and costs |
Separate production facilities for towngas and
trigeneration |
Quadgeneration plant |
|
Towngas plant |
Trigen plant |
Total |
|
|
Power generation rate (megawatts-electric) |
- |
400 |
400 |
400 |
|
Process steam production rate, 10-15 bar
(megawatts-thermal) |
- |
400 |
400 |
400 |
|
Methanol production rate (megawatts-thermal) |
- |
400 |
400 |
400 |
|
Syngas production rate (megawatts-thermal) |
400 |
- |
400 |
400 |
|
Coal input rate (terajoules per hour) |
1.89 |
6.46 |
8.35 |
8.36 |
|
First Law efficiency (percent) |
76.0 |
66.9 |
69.0 |
68.9 |
|
CO2 emission rate (tonnes per hour) |
163 |
555 |
718 |
718 |
|
Capital investment (millions of dollars) |
228 |
700 |
928 |
783 |
|
Annual energy production cost (millions of dollars per
year) |
|
|
|
|
|
Capital |
26.27 |
80.64 |
106.91 |
90.20 |
|
Operation and maintenance (4 percent of capital cost per year)
|
9.12 |
28.00 |
37.12 |
31.32 |
|
Fuel |
13.25 |
45.30 |
58.55 |
58.63 |
|
Total annual energy cost |
48.64 |
153.94 |
202.58 |
180.15 |
|
Specific cost of energy (dollars per thousand
kilowatt-hours) |
For town gas: |
For MeOH: |
|
For town gas: |
|
Gross cost |
17.3 |
54.9 |
- |
64.2 |
|
Credit for steam coproduct |
- |
-15.0 |
- |
-15.0 |
|
Credit for electricity coproduct |
- |
-24.4 |
- |
-24.4 |
|
Credit for MeOH coproduct |
- |
- |
- |
-15.5 |
|
Net cost |
17.3 ($4.80
per gigajoule) |
15.5 ($0.07
per litre) |
- |
9.3 ($2.60
per gigajoule) |
Note: Based on calculations by Robert Moore
(formerly Air Products), building on Dale Simbeck’s analysis in table 8.7
for a gasification-based cogeneration plant, assuming Air Products’
liquid-phase reactor for MeOH production. Engineering plus contingencies and
general facilities are each 10 percent of process capitalequipment costs. The
annual capital charge rate is 11.5 percent. The coal price is $1 per gigajoule
(see note c, table 8.4). The annual average capacity factor is 80
percent.
To illustrate polygeneration based on coal-derived syngas, table
8.11 presents calculations for the coproduction of 400 megawatts each of MeOH,
electricity, and process steam (trigeneration) from coal by adding extra syngas
production capacity to the system described in table 8.7 for the cogeneration of
400 megawatts each of electricity and process steam. Table 8.12 presents
calculations for the coproduction of 400 megawatts each of town gas, MeOH,
electricity, and process steam (quadgeneration) from coal by adding still more
syngas production capacity to the system described in table 8.11.38
Costs for MeOH produced in liquid-phase reactors through once-through
processes have been extensively analysed (Drown and others, 1997), and the
technology is relatively well developed.39
Consider first the trigeneration system (see table 8.11). In
contrast to the cogeneration system (see table 8.7) from which it is evolved,
trigeneration does not lead to further fuel savings, but capital cost savings
are large. Values assumed for coproducts are $0.0150 a kilowatt-hour for steam
(its cost in a stand-alone boiler) and $0.0244 a kilowatt-hour for electricity
(its cost in gasification-based cogeneration). Thus the incremental cost for
methanol is $0.07 a litre ($4.30 a gigajoule) - compared with $0.012 a litre for
MeOH produced from coal in a stand-alone plant. This MeOH cost is less than the
average U.S. refinery (wholesale, untaxed) gasoline price in 1997 ($5.10 a
gigajoule).
In the quadgeneration example, extra syngas is produced as town
gas for distribution by pipelines to nearby users - for example, small-scale
cogeneration facilities based on compression-ignition reciprocating engines with
pilot oil (see above). Note that, whereas producing 400 megawatts of town gas in
a dedicated gasification facility would cost $4.80 a gigajoule, the cost of
adding an extra 400 megawatts of syngas capacity for town gas purposes at a
trigeneration plant would cost instead $2.60 a gigajoule, because of the scale
economy effect. For comparison, the average 1997 U.S. city-gate price of natural
gas was $3.30 a gigajoule.
The trigeneration and quadgeneration calculations illustrate the
importance of building large, centralised, coal-syngas-based production systems
to serve distributed markets for the products. The synthetic liquid fuels
produced can be readily transported to vast markets of remote users. Likewise,
the electricity coproduct can serve large markets if the polygenerator is able
to sell the electricity coproduct into the electric grid at market rates. In
contrast, the extra syngas produced as town gas can be transported economically
only up to distances of 10 - 30 kilometres from the production facility. But
even in this case, the markets served could be large if the centralised coal
conversion plant were located near cities where large numbers of small
factories, commercial buildings, and apartment buildings could be served.
Urban siting for these facilities can be considered for
gasification-based coal conversion systems because of the very low levels of air
pollutant emissions that can be realised (see table 8.1). The major restriction
imposed by the market for the strategy illustrated in tables 8.7, 8.11, and 8.12
is that the process steam demand is defined by the needs of the host and is thus
very site-specific, with limited overall market opportunity. Thus the
coproduction of process steam should be considered an important initial market
for helping to launch coal gasification technology in the market rather than a
large, unconstrained market opportunity. Polygeneration strategies will often
make economic sense, even without the benefit of the process steam coproduct.
Coal-based polygeneration strategies will be especially
important for coal-rich, natural-gas-poor countries like China. Although most
polygeneration activity relating to syngas production is taking place in
industrialised countries, it is also getting under way in some developing
countries (table 8.13 - and table 8.6 above). Consider that - although China has
deployed no modern O2-blown gasifiers in the power sector - it is
already using many such gasifiers in the chemical process industries.40
Such industries might provide better homes for launching IGCC technologies
on the market in China and many other countries than would the electric power
industry as it now exists.
Simbeck and Johnson (1999) point out that gasification-based
polygeneration is being carried out in some countries without subsidy at
refineries and chemical plants, because the economics are inherently attractive.
They also point out that polygeneration based on gasification of refinery
residues will often be more attractive economically than for coal. Such residues
often have high sulphur content and are priced low. Moreover, capital costs tend
to be lower - for example, because solids handling, crushing, and feeding
systems are not needed. In addition, the generally lower levels of ash in heavy
oils means less fouling of syngas coolers, so that lower cost designs might be
employed (Todd and Stoll, 1997). Yet much of the technology is the same as for
coal, so that this early experience will be helpful in buying down the cost of
the technology as experience accumulates, making the technology increasingly
attractive for coal as well.
In contrast to the use of large-scale polygeneration systems for
improving the economics of coal-based synthetic fuels, the focus for
natural-gas-based polygeneration is likely to be on making synfuels production
more attractive at small scales - by enabling the production of
easy-to-transport liquid fuels from remote, small-scale sources of cheap natural
gas.
To illustrate, consider the economics of the coproduction of F-T
liquids and electricity from natural gas using liquid-phase reactors in a
once-through process. Choi and others (1997) found that such systems producing
about 8,800 barrels a day of liquids - plus 84 megawatts-electric of by-product
power from remote gas - would be able to provide liquid fuels at a cost
competitive with liquid fuels derived from $19 a barrel crude oil, assuming that
the by-product electricity is sold for $0.03 a kilowatt-hour. The authors also
found that such a plant would be competitive with a F-T plant employing
recycling technology producing five times as much synfuels output. Thus, as long
as crude oil prices do not plunge much below $20 a barrel, gas liquids derived
from natural gas through liquid-phase reactor technology in once-through
configurations are likely to be cost-competitive.
TABLE 8.13. LARGE COMMERCIAL GASIFICATION-BASED PROJECTS
THAT DO NOT GENERATE ELECTRICITY
|
Location |
Plant owner |
Technology |
Syngas out (megawatts- thermal) |
Feedstock(s) |
Product(s) |
Start-up year |
|
South Africa |
Sasol-II |
Lurgi Dry Ash |
4,130 |
Sub-bituminous coal |
F-T liquids |
1977 |
|
South Africa |
Sasol-III |
Lurgi Dry Ash |
4,130 |
Sub-bituminous coal |
F-T liquids |
1982 |
|
United States |
Dakota Gasification Company |
Lurgi Dry Ash |
1,545 |
Lignite, refinery residues |
Synthetic natural gas |
1984 |
|
Malaysia |
Shell MDS Sdn. Bhd. |
Shell |
1,032 |
Natural gas |
Middle distillates |
1993 |
|
Germany |
Linde AG |
Shell |
984 |
Visbreaker residues |
Methanol, H2 |
1997 |
|
South Africa |
SASOL-I |
Lurgi Dry Ash |
911 |
Sub-bituminous coal |
F-T liquids |
1955 |
|
United States |
Unspecified |
Texaco |
656 |
Natural gas |
MeOH, CO |
1979 |
|
Taiwan, China |
Chinese Petroleum Corp. |
Texaco |
621 |
Bitumen |
H2, CO |
1984 |
|
Germany |
Hydro Agri Brunsb�ttel |
Shell |
615 |
Heavy vacuum residues |
NH3 |
1978 |
|
Germany |
VEBA Chemie AG. |
Shell |
588 |
Vacuum residues |
NH3, MeOH |
1973 |
|
Czech Republic |
Chemopetrol a.s. |
Shell |
492 |
Vacuum residues |
NH3, MeOH |
1971 |
|
Brazil |
Ultrafertil S.A. |
Shell |
451 |
Asphalt residues |
NH3 |
1979 |
|
China |
Shanghai Pacific Chemical Corp. |
Texaco |
439 |
Anthracite coal |
MeOH, town gas |
1995 |
|
China |
Shanghai Pacific Chemical Corp. |
IGT U-Gas |
410 |
Bituminous coal |
Fuel gas, town gas |
1994 |
|
India |
Gujarat National Fertilizer Corp. |
Texaco |
405 |
Refinery residues |
NH3, MeOH |
1982 |
|
Portugal |
Quimigal Adubos |
Shell |
328 |
Vacuum residues |
NH3 |
1984 |
Source: Simbeck and Johnson,
1999.
The benefits of this technology are related not just to the
product price but also to natural gas resource development prospects. The total
plant cost (including the cost of an 84-meagwatt-electric combined cycle power
plant) estimated by Choi and others (1997) is $415 million. This is in contrast
to capital requirement per plant of $2 - 4 billion for a typical liquid natural
gas (LNG) facility. Thus the investment hurdle is far less for a once-through
F-T liquids plus power plant than for an LNG plant. Moreover, the proven gas
reserves required per site for an F-T plant amounts to only 1 exajoule, relative
to 6 - 8 exajoules for an LNG facility.
Thus F-T technology makes it feasible to exploit much smaller
remote gas fields than is feasible for LNG. Of course, this strategy requires
that there be markets for the electricity coproduct, and many remote gas fields
are not near transmission networks. However, the costs of building transmission
lines to deliver baseload electricity to demand centres might often be
economically attractive (requiring much less investment than for
energy-equivalent gas infrastructure) given the low generation cost,
particularly if outputs of several small fields in the region could be combined
for long-distance transmission at scales on the order of 1 gigawatt-electric.
Air Products is also developing liquid-phase reactor technology
for DME production (Peng and others, 1997; Peng and others, 1998). As in the
case of MeOH and F-T liquids production, liquid-phase reactor technology used in
conjunction with once-through process is expected to make DME production from
natural gas economically attractive at relatively small scales.
There needs to be continuing research and development on all
these liquid-phase reactor synthetic fuels technologies - especially on DME,
which has attractive attributes but is the least developed of the technologies
described here. But the main barriers to the deployment of these technologies
are institutional rather than technological: Their economic viability depends on
the ability of the polygenerator to sell the electricity coproduct into the
electricity grid at a fair market price. Reforms to promote more competition in
power markets will be helpful in nurturing the development of syngas-based
synthetic fuels technology.
Hydrogen and the quest for near-zero emissions. The
strategic importance of having an energy system for the long term in which
H2 is a major clean energy carrier has been noted (see box 8.1). No
CO2 or air pollutants are emitted during use when H2 is
consumed in fuel cells. If H2 is burned in gas-turbine-based power
plants, the only air pollutant is NOx (formed by oxidation of N2
in air); but these NOx emissions can be controlled to very low
levels by lean combustion strategies or by injecting steam or water into the
combustor or compressor air stream of suitably designed power
plants.41
When H2 is made electrolytically by decomposing water
from renewable or nuclear electric sources, CO2 and pollutant
emissions associated with H2 manufacture and thus life-cycle CO2
emissions are also zero or near zero. When H2 is made from a
fossil fuel, life-cycle pollutant emissions are also very low,42
although CO2 emissions from H2 manufacture can be high.
However, for large, centralised H2 production facilities, CO2
can be generated as a nearly pure by-product that can be disposed of (for
example, in a geological reservoir) at modest cost. Even if this CO2
had to be disposed of in aquifers (where there is no credit for enhanced
resource recovery) that are as far away as 500 kilometres from production sites,
the cost of disposal based on current technology would be less than $50 a tonne
of carbon (Williams, 1999b). If the H2 so produced were a competitive
energy carrier (which is not the case today), the cost of CO2
emissions avoided would approach this disposal cost - which is less than
the least avoided cost for the coal electric generation technologies described
in table 8.9.
Concerns are often raised about H2 safety. In this
regard, H2 is better than other fuels in some ways, worse in other
ways, and in still other ways just different (Ringland, 1994). However, H2
can be used safely if procedures are followed that respect its physical
and chemical properties (box 8.3). Such theoretical considerations are
buttressed by extensive experience with residential town gas (typically 50
percent H2), which was widely used in the United States until the
1940s and in Europe until the 1960s, and is still used in China and South
Africa.
The manufacture of H2 from a fossil fuel begins with
syngas production - the mostly costly step in the overall process. Thus, if the
world pursues the syngas-based energy technologies described in previous
sections, it would be embarked on a path that would facilitate a transition to
H2.
The dominant commercial H2 production technology is
reforming of natural gas. H2 can also be made through gasification of
any carbonaceous feedstock (Williams and others, 1995), including coal, heavy
oils, biomass, or municipal solid waste (Larson, Worrell, and Chen, 1996), or
through electrolysis of water using renewables (for example, hydropower, wind,
or solar; Ogden and Williams, 1989), nuclear energy, or other power sources.
Until fossil fuel prices are far higher than at present, electrolytic approaches
for producing H2, now and in the future, will tend to be much more
costly than making H2 from natural gas, coal, or other fossil fuels -
even when the added costs of CO2 sequestration are taken into account
(Williams, 1998; IPCC, 1996a).43
Technology for producing H2 from fossil fuels is well
established commercially. Although H2 is currently used only in niche
applications as an energy carrier (for example, for the U.S. National
Aeronautics and Space Administration’s space shuttle launches), it is
widely used in oil refining and the chemical process industries. H2
is produced commercially in the United States at a rate of 8.5 million
tonnes a year (Moore and Raman, 1998) or 1.2 exajoules a year (1.25 percent of
U.S. energy consumption). Several large-scale polygeneration plants have been or
are being built around the world for the coproduction of H2 and
electricity from petroleum residues through gasification (see table 8.6).
Such projects reflect the rapid growth (10 percent a year) in
demand for H2 at refineries, as a result of cleaner transportation
fuel mandates and requirements for processing heavier crudes. The major obstacle
to widespread deployment of H2 as an energy carrier is the fact that
H2 is not competitive in energy markets. There are two ways this
situation might change: the emergence of H2-using technologies that
put a high market value on H2, and H2 production
technologies that reduce its cost - the prospects for which are reviewed in the
next two sub-sections.
Enhancing the prospects for H2 with fuel cell
vehicle technology. Successful commercialisation of fuel cell vehicles would
give H2 a high market price, because H2 fuel cell vehicles
would typically be much more fuel efficient that internal combustion engine
vehicles with the same performance and would offer substantial air quality
benefits.44 Although H2 storage onboard vehicles is
challenging, problems seem to be surmountable with existing technologies, and
some promising advanced options could plausibly make H2 storage no
more challenging for fuel cell vehicles than gasoline storage is today for
internal combustion engine vehicles (box 8.4).
|
BOX 8.3. HYDROGEN SAFETY
Hydrogen is widely perceived to be an unsafe fuel, because it
burns or detonates over a wider range of mixture with air than other fuels, and
very little energy is required to ignite H2 mixed with the minimum
amount of air needed to completely burn it. Although H2 is flammable
in air over a wide range of mixtures, when used in unconfined spaces (as will be
typical in transport applications), the lower limits for flammability and
detonability matter most. In this regard, H2 is comparable to or
better than gasoline. Gasoline and natural gas can also be easily ignited with
low-energy ignition sources such as electrostatic discharges - like those that
result from a person walking across a rug. Moreover, in dilute mixtures with
air, the ignition energy for H2 is essentially the same as for
methane. In another regard, H2 has an advantage over gasoline: In
case of a leak in an unconfined space, H2 will disperse quickly in
the air because of its buoyancy, whereas gasoline will puddle.
An important safety issue for H2 is leaks -
prevention, detection, and management, particularly in confined spaces. Areas
where H2 is stored and dispensed have to be well ventilated; because
of H2’s buoyancy, this means providing vents at the highest
points in ceilings. Considering all these issues, a major study of H2
safety (Ringland, 1994) concluded that "H2 can be handled
safely, if its unique properties - sometimes better, sometimes worse, and
sometimes just different from other fuels - are respected." |
|
BOX 8.4. HYDROGEN STORAGE FOR MOTOR VEHICLES
Storing H2 onboard motor vehicles is challenging
because of H2’s low volumetric energy density. With current
technology, the least costly option is compressed gas (typically at 350
atmospheres; James and others, 1996), for which the storage density is less than
one-tenth gasoline’s.
Volumetric storage densities do not have to equal that of
gasoline to make H2 storage manageable - in part because of the high
fuel economies of fuel cell vehicles. An H2 fuel cell car that meets
the PNGV fuel economy goal (2.94 litres per 100 kilometres or 80 miles a gallon,
gasoline-equivalent) would require 240 litres of compressed H2
storage capacity for a 680-kilometre (425-mile) range between refuellings,
compared to 64 litres for a typical gasoline ICE car (9.4 litres per 100
kilometres, or 25 miles a gallon fuel economy). A prototype H2 fuel
cell van introduced in 1997 by Daimler Benz involved storing H2
cylinders in an under-the-roof compartment; a car with a PNGV fuel economy
and a 680-kilometre range might use three such cylinders, each 110 centimetres
long and 32 centimetres in diameter.
In comparison with gaseous storage, storage volumes could be
reduced by half with metal hydrides, but storage system weight would increase
several times, and costs would be much higher. H2 liquefaction could
reduce storage volumes to a third of those for compressed H2 but
would require consuming electricity equivalent to a third of the H2
(higher heating value basis), and boil-off (typically 1.5 - 2 percent a
day) makes this option wasteful for private cars that are typically used an hour
a day or less.
H2 storage using carbon nanofibres is under
development through alternative approaches (Chambers and others, 1998; Chen and
others, 1999; Liu and others, 1999; Dresselhaus, Williams, and Ecklund, 1999).
It offers the potential for dramatically improving performance - some options
are even able to store H2 at relatively high energy densities near
atmospheric pressure and ambient temperatures. Successful development of one or
more of these technologies might make storing H2 in fuel cell
vehicles no more difficult than storing gasoline in gasoline internal combustion
engine cars. |
A fierce global competition is under way to accelerate the
development of fuel cell vehicles (Steinbugler and Williams, 1998; Appleby,
1999). Nearly all major auto manufacturers have produced test vehicles (table
8.14). Several automakers have set goals to introduce fuel cells into the
automotive market during 2003 - 10. Developmental efforts are focused on PEM
fuel cells. Industrial interest is motivated largely by the prospect that fuel
cell vehicles will have zero or near-zero emissions, without tailpipe emission
controls. The air quality benefits provide a powerful rationale for developing
fuel cells for a wide range of vehicles, including buses, trucks, locomotives,
and small two-and three-wheeled vehicles (which account for much of the air
pollution in cities of the developing world; PCAST Panel on ICERD3,
1999), as well as cars - the focus of fuel cell vehicle development in
industrialised countries.
Under a zero-emission-vehicle (ZEV) technology-forcing policy to
meet its air quality goals, the state of California has mandated that 10 percent
of new cars sold in the state be ZEVs by 2003. Initially, the battery-powered
electric vehicle (BPEV) was the focus of efforts to meet the mandate. Although
there have been some significant advances (for example, in electric drive-train
technology), the BPEV is no longer the only focus of ZEV developmental efforts;
the technological challenges of overcoming the problems of long battery
recharging times, modest vehicle ranges between rechargings, and high costs have
proven formidable. The ZEV mandate has also been catalytic in stimulating
industrial interest in fuel cell vehicles as an alternative technology that
offers good prospects for addressing the shortcomings of the BPEV.
Although the natural fuel for fuel cell vehicles is
H2, many efforts aimed at commercialising fuel cell vehicles are
emphasising H2 production onboard the car from either MeOH or
gasoline, because an H2 refuelling infrastructure is not yet in
place. MeOH and gasoline are liquid fuels that are easily stored and
transported. Processing MeOH onboard cars is easier and has been successfully
demonstrated. Processing gasoline is more difficult, requiring higher
temperatures, but gasoline offers the clear advantage that no new fuel
infrastructure is needed. Detailed modelling has shown that MeOH and gasoline
fuel cell vehicles would be a third less fuel efficient than H2 fuel
cell vehicles but still more fuel efficient than gasoline-fuelled internal
combustion engine vehicles (Ogden, Kreutz, and Steinbugler, 1998).
Although fuel cell vehicles might be launched on the market
using MeOH or gasoline, an H2 fuel cell vehicle would be less costly
to own and operate - largely because of expected lower capital and maintenance
requirements. Even if fuel cell vehicles are launched with gasoline or MeOH, an
internal market pressure subsequently would develop that would encourage a shift
to H2 as soon as an H2 infrastructure could be put in
place (Steinbugler and Williams, 1998; Ogden, Kreutz, and Steinbugler, 1998). By
the time fuel cell vehicles account for a large enough fraction of the market to
justify the infrastructure investments, a plausible scenario for supplying the
needed H2 would be to establish near each major city one or more
large facilities for making H2 from some mix of natural gas, refinery
residues, coal, municipal solid waste, and biomass. These facilities should be
large enough to justify economically sequestration of the separated CO2
but sufficiently close to vehicle refuelling stations that only relatively
modest-scale H2 pipeline networks would be needed to distribute the
H2 to users (Williams, 1999b).
With such an infrastructure in place, fuel cell vehicles could
then offer transportation services with zero or near-zero emissions of CO2
(as well as air pollutants). The added cost to consumers for sequestering
the separated CO2 would amount to less than $0.002 per kilometre of
driving (less than 1 percent of the cost of owning and operating a car),
assuming current H2 production technology for coal and natural gas
(Kaarstad and Audus, 1997) and fuel cell vehicles having the target
gasoline-equivalent fuel economy for the U.S. PNGV (80 mpg, or 2.94 litres per
100 kilometres).
The potential for reducing CO2 emissions with H2
fuel cell vehicles depends on how fast the technology penetrates the
market. Even the most optimistic scenarios project capturing a fourth of the new
car market by 2025 - which implies displacing only a tenth of all cars by that
time. If all fuel cell cars were fuelled with H2, and the separated
CO2 were sequestered, global CO2 emissions would be only
0.1 GtC less than under business-as-usual conditions. Such considerations
illustrate the long periods required for new technologies to have major impacts
- and underscore the importance of launching accelerated development initiatives
for technologies that offer major public benefits, so that they can have
significant impacts 25 years in the future.
Can fuel cell vehicles compete? The leading North American
developer of PEM fuel cell fuels has said in press releases that PEM fuel cells
will be competitive in transport applications when production volumes reach
250,000 - 300,000 fuel cell vehicle engines a year, which the company expects
well before 2010. Some studies in the public domain also project that
mass-produced fuel cell vehicles can be competitive (Thomas and others, 1998a,
b). Although the economics of fuel cell vehicle technology are still very
uncertain, no intrinsic costs of PEM fuel cell materials or fabrication are so
obviously high as to preclude mass-produced fuel cell vehicles from being
competitive. The fuel cell’s inherent simplicity (for example, no moving
parts) and mild operating conditions (80 degrees Celsius) relative to internal
combustion engine vehicles also suggest substantial cost reduction
opportunities.
It will not be easy for the fuel cell vehicle to displace the
internal combustion engine vehicle, an entrenched, mature technology. Moreover,
as noted, internal combustion engine technology is still being improved.
Japanese automakers have already introduced clean spark-ignited internal
combustion - electric hybrids that offer twice the fuel economy of conventional
internal combustion engine vehicles. It will be difficult for gasoline fuel cell
vehicles to compete with these hybrids, because the two sets of vehicles will
have comparable efficiencies, and it is always difficult for a new technology to
displace an old one - unless it offers enormous advantages.
The air pollution issue will be centre stage during the
competition between fuel cell and hybrid internal combustion engine vehicles to
be car of the future. Meeting air quality goals will be especially challenging
for hybrids involving compression-ignition engines (NRG, 1998). Moreover, Ross
and others (1995) estimate that there will be a growing gap between actual
life-cycle emissions and regulated emissions for internal combustion engine
vehicles with spark-ignited engines (see table 8.3).
Hybrids fueled with H2 would pose significant
competition for H2 fuel cell vehicles in the race to zero emissions.
NOx would be the only significant pollutant emission for H2
hybrids; because ultra-lean combustion is feasible with H2
fueling, NOx emissions of hybrids can be controlled to low
levels. However, such hybrids would be less fuel efficient than H2
fuel cell vehicles and thus more costlyto operate. The economic winner of
this race to zero emissions depends on what relative vehicle costs turn out to
be when vehicles are mass produced.
TABLE 8.14. FUEL CELL TEST VEHICLES AROUND THE WORLD
|
Year |
Company |
Fuel storage |
Fuel cell power system |
Range (kilometres) |
|
|
|
Power output (kilowatts) |
Auxiliary power |
Vehicle type |
|
|
1993 |
Ballard |
Pressurised H2 |
120 |
No |
Bus |
160 |
|
1994 |
DaimlerChrysler |
Pressurised H2 |
54 net |
No |
Necar I (van) |
130 |
|
1996 |
DaimlerChrysler |
Pressurised H2 |
50 net |
No |
Necar II (van) |
250 |
|
1996 |
Toyota |
Metal hydride |
20 |
Pb battery |
Car |
250 |
|
1997 |
Ballard |
Pressurised H2 |
205 net |
No |
Bus |
400 |
|
1997 |
DaimlerChrysler |
MeOH (onboard reformer) |
50 |
No |
Necar III (car) |
Greater than 400 |
|
1997 |
Mazda |
Metal hydride |
20 |
Ultra-capacitor |
Car |
170 |
|
1997 |
DaimlerChrysler |
Pressurised H2 |
190 net |
No |
Nebus (bus) |
250 |
|
1998 |
Renault |
Liquid H2 |
30 |
Ni-MH battery |
Station wagon |
400 |
|
1998 |
Opel |
MeOH (onboard reformer) |
50 (motor) |
Ni-MH battery |
Minivan |
- |
|
1999 |
DaimlerChrysler |
Liquid H2 |
70 |
No |
Necar IV (car) |
400 |
|
1999 |
Ford |
Pressurised H2 |
75 |
No |
Car |
96 |
|
1999 |
Nissan |
MeOH (onboard reformer) |
10 |
Li-ion battery |
Station wagon |
- |
|
1999 |
Honda |
Metal hydride |
60 |
Ni-MH battery |
Car |
- |
|
1999 |
Honda |
MeOH (onboard reformer) |
60 |
Ni-MH battery |
Station wagon |
- |
|
2000 |
General Motors |
Chemical hydride |
75 |
Ni-MH battery |
Car |
800 |
Source: Various fuel cell vehicle
newsletters.
Despite the many uncertainties, there is growing private sector
confidence in the prospects for making fuel cell vehicle technology competitive,
as indicated by substantial auto industry investment levels and growing
attention being paid to the technology also by the oil industry (API,
1999).45 Making fuel cell vehicles competitive in the near term
requires accelerated commercialisation, because current costs are high, and
large production volumes are needed to bring costs down quickly. (Fuel cells -
like many other new technologies - are expected to be well described by learning
curves for which costs decline 10 - 30 percent for each cumulative doubling of
production; Rogner, 1998; Lipman and Sperling, 1999.) Recognising this, one
industrial consortium for fuel cell vehicle development - automakers
DaimlerChrysler, Ford, and Mazda, and fuel cell developer Ballard Power Systems
- has bullishly set an ambitious goal of selling 40,000 fuel cell cars a year by
2004.
Enhancing prospects for hydrogen with advanced hydrogen
production technologies. H2 might eventually be able to compete
in fuel cell vehicle markets using current H2 production
technologies. But new H2 production technologies are needed to enable
H2 to compete in applications such as stationary power generation,
for which H2 fuels cells do not offer major efficiency advantages
over conventional fossil energy technologies. There are many opportunities.
One set of opportunities involves integrating CO2
removal into production processes in creative ways - for example,
coproduction of H2 and F-T liquids from natural gas to reduce costs
by avoiding the need for a costly air separation plant.46 Advanced
gas separation technologies warrant focussed attention, especially for
separating CO2 and H2.47 One innovative technology
receiving development support from the U.S. Department of Energy involves
cooling the pressurised gaseous mixture (mainly CO2 and
H2) exiting the water-gas shift reactors to less than 10 degrees
Celsius, then bubbling the gases through a water column. Under appropriate
conditions the H2 passes through but the CO2 is converted
into a CO2 clathrate hydrate that is heavier than water and easily
removed. With this technology it might be possible to substantially reduce the
energy and capital costs of CO2 removal and disposal (Spenser, 1999;
Spencer and Tam, 1999).
Another promising set of options involves using inorganic
membrane reactors to simultaneously drive the water-gas shift reaction towards
maximum H2 yield and separate the H2 and CO2.
Williams (1999b) points out that using such reactors offers the potential for
making H2 from coal (without CO2 sequestration) at costs
that approach typical natural gas prices for electricity producers in the United
States, with CO2 sequestration costs adding $1.00 - 1.50 a gigajoule.
At such costs, coal-derived H2 with sequestration of the separated
CO2 could be an economically attractive option even for
central-station power generation in a greenhouse gas emissions-constrained
world.
In one variant of this concept, the Parsons Group has proposed a
plant design to make H2 from coal that involves separating H2
from CO2 at high temperatures using porous ceramic membranes.
Substantial cost reductions are projected relative to conventional methods for
making H2 from coal (Parsons Infrastructure and Technology Group,
1998; Badin and others, 1999). But Williams (1999b) suggests that attention be
given instead to carrying out the gas separations at much lower temperatures
than proposed by the Parsons Group, to avoid the formidable technological
difficulties of high-temperature processes. Operation of membrane reactors at
lower temperatures increases the number of technological options for gas
separation, including especially promising non-porous composite metal membrane
technologies that can provide H2 of high purity - important for
applications involving PEM fuel cells, which are poisoned by CO at low (10 parts
per million by volume) concentrations.
If methane hydrates could be exploited at large scales (chapter
5), ways would eventually be needed to extract the energy without releasing the
separated CO2 into the atmosphere, to prevent a greenhouse
disaster.48 One way this might be accomplished is to make H2
from the methane using steam reforming and leave behind in nearby
reservoirs the by-product CO2 as CO2 clathrate hydrates
(PCAST Energy Research and Development Panel, 1997), which are stable under
pressure and temperature conditions similar to those for methane hydrates.
Indeed, sub-seabed disposal of CO2 in the form of clathrate hydrates
has been proposed as a major option for effectively disposing of CO2
generated in fossil energy systems (Koide and others, 1997).
Alternatively, H2 could be extracted through methane
thermal decomposition to produce H2 and carbon black (Steinberg and
Cheng, 1989), an endothermic process. If some of the produced H2 is
burned to provide the needed heat, the process would be CO2-emissions
free, and the net H2 energy yield would still be more than 50 percent
of the energy content of the original methane. Although this conversion would
have much less than the 80 - 85 percent efficiency that can be achieved with
conventional reforming technologies, methane thermal decomposition might prove
interesting if there are unforeseen obstacles (political or technical) to
large-scale CO2 sequestration (carbon black is easier to store than
CO2).
Other near-term advanced fossil energy technologies
Besides the advanced technologies described above that are
consistent with all sustainable development goals, other near-term advanced
fossil energy technologies - for both power generation and synthetic fuels
production - offer improved performance relative to today’s technologies
but would not be consistent with all sustainable development goals. In
particular, they would not provide a good basis for moving over the longer term
towards near-zero pollutant and CO2 emissions. Yet some of them might
become important in limited applications.
Power generation
Other candidate advanced coal-based power-generating
technologies include ultrasupercritical coal steam-electric plants, IGCC plants
that employ air-blown gasifiers, and pressurised fluidised-bed combustion
(PFBC).
Ultrasupercritical coal steam-electric plants. A typical
modern coal steam-electric plant with flue gas desulphurisation has 35.5 percent
efficiency (see table 8.4), a level that has changed little since the 1950s.
Attention has recently been given to opportunities to achieve higher
efficiencies by using advanced alloys that make it possible to increase peak
steam temperatures and pressures to ultrasupercritical steam conditions and by
deploying efficiency-boosting cycle configurations (for example, double
reheating, which increases efficiency by increasing the average temperature at
which heat is added to the cycle). For example, ELSAM of Denmark has built a
400-megawatt-electric ultrasupercritical, coal steam-electric plant with an
announced efficiency of 47 percent (Kjaer, 1993).49 This project
should be watched closely to see if operators can avoid the high forced outage
rates that plagued earlier attempts to operate steam-electric plants under
ultrasupercritical conditions. Increased forced outage risk will be more
important under future competitive market conditions than in the past, when most
electric companies had a guaranteed rate of return on investment.
One limitation of the technology is that it is not nearly as
well suited as the IGCC for cogeneration. The low electricity-heat output ratio
characteristic of steam cycles using back-pressure turbines (see figure 8.1)
limits the overall cost reduction potential, as well as the overall
power-generating and fuel-saving potentials from cogeneration based on this
technology (compare tables 8.7 and 8.8). In addition, the cogeneration operating
mode is typically not cost-effective for systems that involve steam
reheating.50
Achieving ultra-low air pollutant emissions will be much harder
than for IGCC plants with O2-blown gasifiers, because contaminants to
be removed are in flue gas volumes 40 - 60 times larger than for the pressurised
fuel gases from which pollutants are removed in IGCC plants. In addition,
although ultrasupercritical steam plants release a fifth less CO2 per
kilowatt-hour than conventional steam-electric plants, achieving deep reductions
in CO2 emissions requires approaches that involve removing CO2
from flue gases, which is much more costly than for IGCC plants with fuel
gas decarbonisation equipment (see table 8.9).
Coal IGCC technology based on air-blown gasification.
Although commercial coal IGCC technology is based on O2-blown
gasifiers, the research and development community is interested in developing
systems based on air-blown gasifiers - motivated largely by a desire to
eliminate the air separation plant.51 Interest in air-blown
gasification in turn has driven interest in research and development on warm gas
clean-up technologies that could reduce the thermal losses from cooling down the
gas exiting the gasifier for clean-up and heating it up again for
combustion.52
|
Government support for innovation
is needed - particularly
for long-
term research, and for early
deployment of new
technologies.
|
Development of warm gas clean-up is proving to be
difficult.53 But even if these difficulties were eventually overcome,
broadly based comparisons of O2- and air-blown gasifier-based systems
(Simbeck, 1995) show that O2-blown gasifiers are usually preferred
for coal.54 The advantage of avoiding the need for O2 is
offset by disadvantages of air-blown gasifier systems, considering only direct
costs. First, because of the lower heating value of the gas, an air-blown
gasifier requires twice the gasifier volume as does an O2-blown
gasifier - important in light of the capital intensity of gasifiers. Second, for
gasifiers operated at comparable temperatures, the sensible heat of the raw gas
leaving an air-blown unit is typically 50 - 60 percent more than for an
O2-blown gasifier, which implies a significant increase in the duty
of the raw gas cooler - one of a gasification plant’s more costly items.
In addition, seven strategic considerations amplify the relative
benefits of O2-blown systems. First, O2-blown gasification
facilitates an evolutionary strategy in which gas turbines and combined cycles
are fired first with natural gas and converted later to coal as natural gas
prices rise - a difficult option for air-blown gasifiers without major system
modifications and technical risk. Second, air-blown units are less able to
exploit advances in gas turbine technology that enable higher turbine inlet
temperatures and higher efficiencies.55 Third, with air-blown
gasification, polygeneration strategies (see above) other than cogeneration of
process heat and electricity are not practical. Fourth, warm-gas clean-up is
essential for favourable system economics with air-blown gasifiers, but merely
an option that offers higher efficiency for systems with O2-blown
gasifiers - the benefit of which must be traded off against capital cost,
reliability, and environmental considerations. Fifth, if warm-gas clean-up can
be made commercially viable, environmental benefits would be less for air-blown
systems, because dilution of the contaminants with N2 makes achieving
the same levels of air pollutant emissions reduction more costly than for
O2-blown systems. Sixth, achieving deep reductions in CO2
emissions with IGCCs equipped with air-blown gasifiers would require flue
gas CO2 recovery approaches that are much more costly than are fuel
gas recovery approaches for O2-blown systems (see table 8.9).
Seventh, successful development of air-blown gasifier-based systems would not
make a major contribution in moving towards near-zero emissions in the long
term, while the O2-blown gasifier is the key near-term technology
that would enable this evolutionary strategy.
Pressurised fluidised-bed combustion. PFBC is an advanced
technology evolved from atmospheric pressure fluidised-bed combustion (AFBC)
technology, which is already on the market (with both bubbling- and
circulating-bed variants).56
A review of AFBC technology is helpful in understanding PFBC.
Although not more energy-efficient than pulverised coal plants, AFBC plants make
it possible to use a wide range of coals and other fuels in a single combustor.
One manifestation of this fuel flexibility is the ability to cofire coal units
with biomass, a common practice in Scandinavia (Saviharju, 1995). This practice
makes it possible both to realise the economies of larger-scale conversion for
biomass than are typically feasible with dedicated biomass units and to reduce
the AFBC unit’s air pollutant and greenhouse gas emissions (as a result of
the typically low sulphur and nitrogen contents of biomass feedstocks and their
CO2 emissions neutrality). (This flexibility to accommodate biomass
is also provided by fluidised-bed gasification technologies.)
At the low operating temperatures of AFBC plants, thermal
NOx emissions are considerably less than for pulverised coal plants,
although about 10 percent of nitrogen in coal can be converted to NOx
(Pillai, 1989). For some coals and in areas with tight regulations on
emissions, NOx control equipment is needed. Up to 90 percent sulphur
removal can be accomplished by adding limestone or dolomite to the bed; higher
removal rates are theoretically possible but impractical because of the large
quantities of limestone and dolomite needed and consequent high solid waste
disposal rates. AFBC sulphur removal technology is practically restricted to use
with relatively low-sulphur coals and for meeting regulatory requirements
calling for relatively modest sulphur removal. The high pH of the waste (because
of free lime, accounting for a third of limestone-related wastes) might cause
the waste to be classified as hazardous in some areas and thus be subject to
especially stringent disposal regulations. Moreover, waste utilisation
strategies are difficult because potentially useful products (such as gypsum)
are intimately mixed with other wastes.
When a fluidised-bed combustor is pressurised to 10 - 15
atmospheres, electricity can be produced by feeding the combustion-product gases
to a gas turbine after clean-up and using the turbine exhaust gases to produce
steam in a heat recovery boiler that drives a steam turbine. Such PFBC
technology thus makes higher efficiency possible with a combined cycle, while
reducing boiler size. Early PFBC units have 37 - 40 percent efficiencies.
Improved designs, such as ABB Carbon’s design with an ultrasupercritical
double-reheating PFBC boiler and steam turbine, can achieve 43 percent
efficiency.
PFBC and IGCC based on O2-blown gasifiers are the
leading competing advanced coal power technologies. The main PFBC advantages are
fuel flexibility (as for AFBC) and simplicity - because PFBC uses one reactor
(combustor) relative to two (gasifier and combustor) for IGCC - which might give
PFBC a near-term cost advantage. A major PFBC limitation is that, unlike the
IGCC, it cannot take advantage of continuing advances in gas turbine technology,
because the turbine inlet temperature is fixed at the bed temperature, which is
far below the state of the art for modern gas turbines. Future systems might be
able to exploit gas turbine technology advances,57 although they
would not be simpler than IGCC systems and thus would lose the original appeal
of the PFBC concept and current designs. Efficiencies of 45 - 48 percent are
being targeted. As in the case of air-blown IGCC technology, successful
development of warm gas clean-up technology is key to achieving high performance
with future PFBC systems. Like AFBC, PFBC is limited mainly to use with
low-sulphur coals, because of solid waste disposal issues; PFBC typically
generates more solid waste per unit of fuel consumed than AFBC.
|
Energy research
and development is cheap
insurance for
addressing
the climate change
challenge. |
The higher efficiencies offered by PFBC can lead to reduced
CO2 emissions - for example, a 43 percent efficient unit equipped
with an ultrasupercritical double-reheat PFBC boiler and steam turbine would
have a fifth less CO2 emissions than a typical new 35.5 percent
efficient pulverised coal plant. But achieving deep reductions in CO2
emissions would require approaches that involve removing CO2
from flue gases, which are more costly than for IGCC plants with fuel gas
decarbonisation equipment (see table 8.9). In addition, unlike most combustion
systems, greenhouse gas emissions from fluidised-bed combustion units can be
significantly greater than emissions from fuel carbon. A powerful additional
greenhouse gas is nitrous oxide (N2O), which is produced efficiently
from nitrogen in coal at the low operating temperatures of fluidised
beds.58
Measurements of N2O in AFBC exhaust gases (de Soete,
1993) correspond to a 5 - 25 percent increase in CO2-equivalent
greenhouse gas emissions relative to CO2 emissions from coal burning.
Sub-bituminous coals and lignite generally produce less N2O than
bituminous coals, and circulating fluidised beds tend to produce more
N2O than bubbling beds, possibly because of the longer residence
times for the former (de Soete, 1993). Reducing N2O emissions from
AFBC units will be technologically challenging. For PFBC systems, N2O
emission data are relatively scant. Measurements at the Swedish V�rtan PFBC
cogeneration plant (Dahl, 1993) show that emissions vary markedly with operating
conditions. From these measurements, it is estimated that when NOx
control technologies are not deployed, the CO2-equivalent
emissions of N2O emissions are 3 - 10 percent of CO2
emissions from coal burning. In addition, when NH3 injection is
used for NOx control, the CO2-equivalent emissions are 5 -
18 percent of CO2 emissions from coal burning.
Although it is a significant improvement over conventional
pulverised coal and AFBC technologies, PFBC technology is limited for the longer
term by constraints similar to those for ultrasupercritical pulverised coal
steam plants and IGCCs using air-blown gasifiers. For applications involving
cogeneration of process heat and electricity, characteristic PFBC
electricity-heat output ratios are much less than those for IGCC technologies
(because of the relatively minor role played by the gas turbine in PFBC units),
so that cogeneration economics would tend to be less favourable than for IGCC
systems. And, as for conventional ultrasupercritical pulverised coal
steam-electric plants, energy-efficient PFBC designs that employ steam reheat
cycles are generally poor candidates for cogeneration. Moreover, PFBC systems
cannot exploit the syngas-based polygeneration opportunities feasible with
O2-blown gasification.
Whether PFBC can meet its long-term goals depends critically on
success with warm-gas cleanup; comments relating to warm-gas clean-up for PFBC
versus IGCC with O2-blown gasifiers would be similar to those
presented above for warm-gas clean-up for IGCC with air-blown gasifiers versus
IGCC with O2-blown gasifiers. Perhaps the most fundamental
shortcoming of PFBC technology is that, as for ultrasupercritical steam
technology and IGCC technology with air-blown gasifiers, it is not a stepping
stone along the path to near-zero emissions for coal.
Liquid fuels production through direct liquefaction of
low-quality feedstocks
An alternative to the indirect liquefaction technology that
provides syngas-derived synthetic fuels from carbonaceous feedstocks (see above)
is direct coal liquefaction, which involves adding H2 to coal in a
solvent slurry at elevated temperatures and pressures. Direct liquefaction was
commercialised in Germany and Japan to provide liquid fuels during World War II,
when coal-derived gasoline levels reached 75,000 barrels a day (Simbeck,
Dickenson, and Moll, 1981). Interest in the technology virtually disappeared
when low-cost Middle Eastern oil became available in the 1950s but was revived
during the oil crises of the 1970s, when several pilot and demonstration
projects were carried out. Interest almost disappeared again with the collapse
of the world oil price in the mid-1980s. Today the technology is again being
considered as an option for making synthetic fuels in natural-gas-poor regions
such as China.59
An advantage often claimed for direct liquefaction is that
overall conversion efficiencies are higher than for indirect liquefaction
(Stiegel, 1994). However, to the extent that potential efficiency gains relative
to indirect liquefaction can be realised, this is largely due to the fact that
direct liquefaction plants produce liquids that are aromatic-rich and thus
require less H2 than typical fuels derived through indirect processes
(Simbeck, Dickenson, and Moll, 1981). But here an improvement in efficiency
would represent a step backwards for environmental management, because new
environmental regulations aim to propel a shift to inherently cleaner fuels -
for example, recent U.S. regulations limit aromatic contents of transport fuels.
A review of direct coal liquefaction technology by a panel
convened by U.S. President Bill Clinton to advise him on energy research and
development needs (PCAST Energy Research and Development Panel, 1997) found that
the technology:
· Offered no
advantages relative to indirect liquefaction.
· Would lead to liquid fuels
that generate twice as much CO2 as petroleum-based fuels.
· Would provide no obvious path
to achieving deep reductions in CO2 emissions over the long term at
low cost - in contrast to syn-gas-based strategies, which can evolve to the
point where H2 is a major energy carrier with low-cost sequestration
of the separated CO2.
Because of such considerations, the panel recommended that the
U.S. Department of Energy terminate federal research and development funding for
direct coal liquefaction. The panel also recommended that the freed-up resources
be used to support research and development on syngas-based technologies that
are consistent with a technological evolution over the longer term to near-zero
emissions for fossil fuels.
The arguments set forth here favouring indirect over direct
liquefaction apply to other low-quality feedstocks as well as coal - for
example, tar sands and heavy crudes, which are far more abundant than
conventional oil and natural gas resources (chapter 5). Such feedstocks could be
used to produce cleaner fuels through indirect liquefaction, and ultimately
H2 with sequestration of the separated CO2, thereby
helping to realise the long-term goal of near-zero emissions for fossil
fuels.
Conclusion
The fossil energy system can evolve in ways consistent with
sustainable development objectives if public policies guide a high rate of
innovation toward super-clean fossil energy technologies. On the basis of
present knowledge, it is possible to identify and describe advanced fossil
energy technologiesthat meet sustainable development objectives at reasonable
cost.
The trend towards the growing use of natural gas is making clean
energy more widely available at attractive prices. But the move to gas in the
context of an increasingly competitive energy industry is also making innovation
difficult. To stimulate the needed innovation, policy-makers could set long-term
goals for advanced fossil energy technologies, including near-zero emissions of
both air pollutants and greenhouse gases. They could also enact policies with
incentives to motivate the private sector to develop and deploy technologies
that would lead the fossil energy system towards a future consistent with
sustainable development objectives.
Key technologies needed to bring about such a fossil energy
future are advanced gas turbines, fuel cells, advanced syngas production
technologies, and inorganic membranes for gaseous separations. The private
sector is fully capable of carrying out most of the needed research and
development for all such technologies. But government support for innovation is
needed - particularly for long-term research, for which private sector
incentives are especially weak, and for early deployment of new technologies
that offer major public benefits related to sustainable development (PCAST Panel
on ICERD3, 1999).
Major roles for developing countries (where most fossil energy
demand growth will take place) in the innovation process are also needed to
ensure that innovations are tailored to developing country needs (PCAST Panel on
ICERD3, 1999). Government also could play a role in guiding and
facilitating new infrastructure development - for example, for natural gas
delivery systems in the near term and H2 delivery systems in the long
term. Both the energy innovation process and infrastructure-building activities
have strong international dimensions and highlight the importance of fostering
international collaborations - for example, through industrial joint ventures
(PCAST Panel on ICERD3, 1999).
Reforms that encourage competitive power markets could help put
industry on a path to fossil energy with near-zero emissions by helping launch
syngas-based polygeneration activities that provide clean synthetic fuels for
transportation, cooking, and other applications, along with electricity and
process steam.
Two sets of research and development issues stand out for a
long-term fossil energy strategy. One concerns the effectiveness, safety, and
capacity for CO2 disposal. A better scientific and technical
understanding of these issues, on a region-by-region basis, would help
policy-makers decide how much climate-change mitigation resources to commit to
this strategy relative to other options, such as renewable or nuclear energy.
The other concerns the prospects for energy recovery from methane hydrates. A
better scientific and technical understanding of this resource, on a
region-by-region basis, would help policy-makers decide how to allocate
resources for long-term fossil energy research and development (for example, how
to allocate between coal and methane hydrate options). Getting answers to both
sets of questions would require expenditures of public resources, because
private sector interest is weak as a result of the long-term nature of the
questions. But in both cases, the required expenditures are likely to be modest.
An uncertainty regarding the strategy outlined here - guiding
the fossil energy system towards widespread fuel decarbonisation with CO2
sequestration - is whether the public will find large-scale sequestration
acceptable. The public has to be convinced that sequestration will be safe and
effective. Broad public participation in activities related to decarbonisation
and sequestration should be encouraged - for example, a wide range of
stakeholder groups should have roles in reviewing scientific studies,
demonstration projects, and planning activities. The fact that the least costly
technologies for CO2 disposal also offer near-zero emissions of air
pollutants should help gain public confidence. The public will want to know the
trade-offs, in relative costs and side effects, among fossil, renewable, and
nuclear options for realising the goal of near-zero emissions, and also the
trade-offs between pursuing near-zero emissions and not doing
so.
Advanced nuclear energy technologies
Nuclear power dominates electricity production in several
countries60 and is making substantial contributions to global energy:
At the 1998 level of installed nuclear capacity of 349 gigawatts-electric,
nuclear power provided 16 percent of world-wide electricity (IAEA, 1999).
Although there is likely to be modest expansion until 2010, most projections are
that the nuclear share of electricity generation will be less in 2020 than
today. And many projections envisage that nuclear power’s absolute
contribution in electricity will be no more than today and might even be
less.61
The regional outlook has more contrasts.62 For
industrialised countries, which accounted for 81 percent of nuclear generating
capacity in 1997, the U.S. Energy Information Administration (EIA) projects that
nuclear capacity in 2020 will be 44, 75, and 100 percent of the capacity in 1997
for its low-growth, reference, and high-growth scenarios. The projected
reductions in capacity in industrialised countries reflect the expectation that
nuclear plants retired at the ends of their useful lives will not be replaced,
although utilities in several countries are considering plant life extensions.
For Eastern Europe and the countries of the former Soviet Union (which accounted
for 13 percent of global nuclear capacity in 1997), the EIA projects that, for
these same scenarios, capacity in 2020 will be 26 gigawatts-electric less, 6
less, and 24 more than in 1997. For developing countries (which accounted for 6
percent of global nuclear capacity in 1997), the EIA projects capacity increases
for the respective scenarios of 10, 34, and 67 gigawatts-electric, with most of
the expansion in Asia.
There is a nuclear power stalemate in many regions, in part
because the technology is much more costly than was originally projected - a
problem exacerbated by low fossil fuel prices, growing numbers of new competing
technologies, and increasingly competitive market conditions world-wide in the
electric power industry. In addition, the prospects for continuing and expanding
the contribution of nuclear power to the world energy supply have been clouded
by concerns related to safety, radioactive waste management, and nuclear weapons
proliferation and diversion. All these issues have led to a loss of public
confidence in nuclear
technology.
Rationale for reconsidering the nuclear option
If ways can be found to make nuclear power widely acceptable, it
could help address problems posed by conventional fossil energy technologies -
especially health impacts of air pollution and climate change arising from
CO2 build-up in the atmosphere. Considering the chain of activities
for nuclear power production (including mining operations, nuclear fuel
conversion, nuclear power plant operation, decommissioning, transportation, and
waste disposal), recent analysis carried out under the European
Commission’s ExternE Program estimated that the total cost of environmental
damage (local, regional, and global impacts integrated during a period of up to
100,000 years) is about $0.003 per kilowatt-hour when evaluating future impacts
with a zero discount rate (Rabl and Spadaro, 2000).63 This is far
less than the environmental damage costs of coal steam-electric plants with the
best available control technologies, but (considering the margin of error in
these estimates) is comparable to damage costs of modern natural gas combined
cycle and coal IGCC plants (see table 8.1).
These externality cost comparisons for nuclear and fossil energy
systems are incomplete, however. The calculations do not take into account costs
associated with the potential diversion of nuclear materials to weapons purposes
or wars triggered by concerns about access to energy or water supplies, which
are inherently difficult to quantify in economic terms. For nuclear power,
greenhouse gas emissions are zero, a benefit (also inherently difficult to
quantify) that must also be taken into account in comparing nuclear and fossil
energy technologies.
As an aid in thinking about potential roles for nuclear energy
in mitigating climate change, consider two alternative scenarios:
· A high-growth
scenario that extrapolates the EIA’s high-growth scenario to 2100, with
nuclear capacity increasing to 1,000 gigawatts-electric by 2050, 3,000 by 2075,
and 6,500 by 2100.64
· A low-growth scenario that
extrapolates the EIA’s low growth scenario to zero nuclear capacity by
2050.
The greenhouse gas mitigation benefit of the high-growth
relative to the low-growth scenario would be reductions in CO2
emissions of 225 GtC during the next 100 years if coal power were
displaced and 110 GtC if natural gas power were displaced65 -
reductions equivalent to 16 percent and 8 percent of emissions during the period
under a business-as-usual future.66 This calculation shows that, for
nuclear energy to make a significant contribution to coping with climate change,
nuclear capacity must be increased by at least an order of magnitude during the
next 100
years.
The need for advanced technologies
It is desirable to see if acceptable solutions can be found to
the economic, safety, proliferation and diversion, and waste management concerns
that presently constrain the prospects for further nuclear deployment.67
Solutions are desirable both because nuclear energy can potentially
contribute to solving the major problems posed by conventional fossil energy
technologies and because of uncertainties associated with the prospects of other
advanced energy-supply options (both the advanced fossil technologies described
above and the renewable technologies described in chapter 7). Emphasis here is
on technological strategies and the kinds of research and development that offer
promise in making the nuclear option more attractive. However, socio-political
considerations are also discussed.
The sociopolitical context
Identification of promising technologies for future nuclear
power is complicated by the lack of consensus in the broader community of
stakeholders (utilities, governments, publics, scientists, engineers) on goals
for nuclear energy innovation and ways to address the goals. At the root of
these difficulties is the fact that the issues cannot be resolved in narrow
technical and economic terms. Perceptions of costs, safety, proliferation and
diversion impacts, and risks in waste management matter as much as
engineers’ calculations.
To illustrate, consider that although most experts believe waste
disposal is the least challenging problem facing nuclear energy and is soluble,
many in the general public regard waste disposal the most daunting challenge.
Public concerns about managing wastes for the very long term thus have focused
attention in the technical community on waste mitigation strategies that could
radically shorten the time required to keep waste under surveillance (for
example, nuclear waste separation and transmutation proposals) - relatively
costly strategies that some experts believe would exacerbate proliferation and
diversion concerns without gaining many benefits. As long as there are such
seemingly fundamental disagreements, nuclear energy innovation efforts will
remain unfocused.
|
Most projections are
that the nuclear share
of
electricity generation
will be less in 2020
than today. |
The analysis of technologies and strategies that follows is
based largely on technical considerations. But the reader should bear in mind
that bringing about a ‘nuclear renaissance’ would require more than
just doing the right research and development. Because - after an ambitious
start - nuclear power has lost its lustre, the barriers to its revival are
probably higher than if the technology were entirely new. Nuclear power may
never again be seen as "a welcome sign that the modern age is dawning; it can at
best hope to be tolerated. Therefore, nuclear power must have a substantial
advantage if it is to be used" (Lidsky, 1991). And new nuclear technology must
appeal not only to experts but also to the public.
Nuclear electricity costs
Nuclear fuel costs are low relative to fossil fuel costs. For
example, in 1998 the average fuel cost for nuclear power in the United States
was $0.0054 per kilowatt-hour (Ryan, 1999) - a third that for coal
steam-electric power and a fourth that for natural gas combined cycles in Europe
(see table 8.4). But operation and maintenance costs and capital costs have been
high for nuclear plants. Operation and maintenance costs have been declining
somewhat in recent years as a result of competitive pressures but are high
relative to operation and maintenance costs for fossil fuel plants. For example,
in 1998 operation and maintenance costs for U.S. nuclear plants averaged $0.014
per kilowatt-hour (Ryan, 1999) - more than three times the operation and
maintenance cost for U.S. coal or natural gas plants (see table 8.4). Operation
and maintenance costs have been high for nuclear plants largely because of the
large operating staff - typically 800 - 900 for a large 1,100-megawatt-electric
power station. Staffing requirements are high, to a large degree because of the
need to operate the plants within current regulatory guidelines designed to
ensure safety.
A recent survey of electricity generation costs in 18 countries
found that installed capital costs for new nuclear power plants around the world
are $1,700 - 3,100 per kilowatt-electric (Paffenbarger and Bertel, 1998),68
much higher than for typical new fossil energy plants. Despite such high
capital costs, the study found that, for new plants, nuclear power would be less
costly than coal- or natural-gas-based power in two countries - China and
France.
The costs of alternatives to nuclear power are fast-moving
targets in many regions. Privatisation is taking place in many countries where
the power sector was once dominated by parastatal energy companies, and the
trend is towards more competition in power markets, where competitive new
smaller-scale technologies have ended the historical natural monopoly status of
electricity generation. As noted, the natural gas combined cycle has become the
technology of choice for thermal power generation where natural gas is readily
available. Where competitive conditions are strong, costs have been coming down,
even for mature technologies such as pulverised coal steam-electric plants - for
example, by a fourth in the United States from 1992 - 95 (Stoll and Todd, 1996).
Moreover, since the early 1980s the average price of coal for
electric companies in the United States has fallen by a factor of 2 in real
(inflation-adjusted) terms, and the average coal price is expected to fall a
further 30 percent by 2020, to $0.90 a gigajoule (EIA, 1999a). In Europe fossil
energy prices are not as low as in the United States, but even there prices have
been falling; from 1983 - 95 the average prices for coal and natural gas
imported into the European Union fell from 55 to 65 percent (Decker, 1999). Such
intensifying competition from fossil fuels can be expected to spread to more and
more regions undergoing electric industry restructuring.
Quantification of the external costs of today’s fossil
energy plants would improve the economics of nuclear power. But these benefits
will not be so great with various advanced fossil energy technologies: Fossil
energy technologies now coming onto the market can provide electricity with very
low emissions of local and regional air pollutants. Moreover, as discussed
above, even the climate change benefits offered by nuclear power likely will
face stiff competition from advanced coal systems that involve fuel
decarbonisation and CO2 sequestration. Thus direct economic costs
will continue to be important in determining the future of nuclear power. If
nuclear power is to become economically viable once again, innovations will be
needed that can provide electricity at costs competitive with other future
near-zero-emission energy technologies. Moreover, this has to be done in ways
that are consistent with meeting concerns about nuclear safety, proliferation
and diversion, and radioactive waste disposal.
Nuclear safety
If substantial quantities of the radionuclides produced in
nuclear reactors are released to the environment, the result can be considerable
damage - not just the direct impacts on people and the environment but also the
indirect impacts on the viability of the industry itself. The loss-of-coolant
accident at Three Mile Island shook investor confidence in nuclear power, even
though radioactive material releases to the environment were minimal. As a
result of the Chernobyl accident, the public has little confidence that nuclear
power is safe.
|
For nuclear energy to qualify as a sustainable
energy
option, concerns regarding safety,
waste disposal, and proliferation
must
be addressed in ways that enable
it to compete on an
economic
basis. |
Unlike Chernobyl-type reactors, the light water reactors (LWRs)
that dominate nuclear power around the world have had a remarkably good safety
record. But LWR accidents can happen. The Three Mile Island accident stimulated
numerous improvements in reactor safety. Detailed calculations indicate that,
for current U.S. reactors, the probability of core damage is less than 10-4
per reactor per year, and the probability of significant radioactive
releases is a tenth as large (Fetter, 1999). But this record has been achieved
at a high cost for a complex technology to minimise serious accident risk, and
the technology is unforgiving of error.69
Advanced reactors are likely to be significantly safer. Two
approaches to safety are used in advanced reactor designs. One is aimed at
improving the technology in an evolutionary manner with the present
defence-in-depth approach to safety, which provides redundancy or multiple
levels of active interventions by equipment and operators to prevent fuel damage
- and, even if fuel is damaged, to prevent the release of significant quantities
of radioactivity to the environment. Although enough redundancy can reduce the
probability of failure to arbitrarily small values, sceptics can always claim
that not all events leading to accidents can be imagined, so that the
probabilities used in probabilistic risk assessment are not accurate (Spiewak
and Weinberg, 1985). Such systems depend on proper operation and maintenance of
reactors, which cannot always be assured.70
The complexity of active safety systems also can tempt workers
to ignore regulations they believe to be overly conservative (as was the case at
Chernobyl). And finally, complex systems can make it difficult to achieve the
goal of reducing capital and operation and maintenance costs. An alternative
approach to safety is to identify and develop technologies that offer a high
inherent degree of safety without the need for complicated, capital-intensive
safety controls - often called passive safety systems. If passive systems can be
developed and made to work effectively, they offer the potential to address
safety and cost challenges simultaneously. Lidsky (1991) argues that new reactor
technologies have to be not only safe but demonstrably safe, because "the public
has lost faith in all experts and has little trust in probabilistic risk
assessments".
Nuclear proliferation and diversion
The knowledge needed to design and fabricate fission bombs is
available to almost every nation. For many years, lack of access to nuclear
explosive materials,71 not lack of knowledge, has been the main
technical barrier to the spread of nuclear weapons capability. The essence of
the potential nuclear weapons link to fission power (box 8.5) is that this
technology provides the possibility of obtaining this missing ingredient, in the
form of either uranium-enrichment capability or plutonium extractable from spent
reactor fuel through chemical reprocessing. Access to such materials makes it
easier for additional countries to acquire nuclear weapons (Holdren, 1989). In
the future, as sub-national criminal groups become more sophisticated, the
related threat that these too might acquire nuclear bombs or radiological
weapons by misusing nuclear energy technologies may grow in importance (Willrich
and Taylor, 1974; Leventhal and Alexander, 1987; LLNL, 1998).
Are proliferation and diversion resistant technologies
needed? A multifaceted effort is required to minimise the motivations for
proliferation: control commerce in sensitive facilities, equipment, and
materials; detect any misuse of such facilities or equipment or diversion of
materials; and intervene where necessary to prevent an errant nation or
sub-national criminal group from acquiring nuclear weapons. The main approach to
addressing these challenges has been the Nuclear Non-Proliferation Treaty and
associated international safeguards and nuclear supplier agreements (box 8.6).
These deterrents are more significant than ever before: A nation-state deciding
to launch a nuclear weapons programme today would need to find motivation
sufficient to offset the penalties of discovery, the possibilities that the
enterprise might not succeed, and costs that might be prohibitive.
The issue of how to deal in the future with the risk that
nuclear materials in civilian nuclear power programmes will be used for weapons
purposes is a focus of debate. One view is that this risk can be adequately
addressed by a system of institutional controls, building on the historical
success of the Nuclear Non-Proliferation Treaty (Walker, 1999). Others argue
that if the role of nuclear energy were to expand substantially (for example, to
the extent that nuclear power could have a significant role in mitigating
climate change risks), the requirements imposed on institutional measures such
as safeguards would increase significantly. Thus, it is argued, research and
development is needed to see if the inherent resistance of nuclear energy
systems to proliferation can be increased, thereby lessening the intensity of
reliance on institutional measures alone to reduce proliferation risks (Bunn,
1999; Feiveson, 1999; Williams and Feiveson, 1990; PCAST Energy Research and
Development Panel, 1997; PCAST Panel on ICERD3, 1999).72
Clearly, additional countries can acquire nuclear weapons if
they want them badly enough to openly abrogate the Nuclear NonProliferation
Treaty or to take their chances that a clandestine weapons programme will not be
detected. And such countries can do this whether or not civilian nuclear energy
technology is available to them as a partial basis for their weapons effort. It
appears that the steps taken to strengthen the non-proliferation regime in
recent years have significantly increased the difficulty, cost, and
detectability of such efforts to produce nuclear weapons.
Looking to the future, the key proliferation and diversion issue
is how to minimise the temptations and advantages that nuclear programmes may
offer potential proliferator states and sub-national groups - that is, how to
minimise any contribution of nuclear energy to the rate at which additional
states or groups seek to acquire and succeed in acquiring nuclear weapons.
The sections below explore the prospects for reducing
proliferation and diversion risks with advanced technologies, which could be
especially important in a world where nuclear power is developed on a scale far
larger than at present.73 Two approaches to proliferation and
diversion resistance are considered. One involves systems in which plutonium and
other weapons-usable materials are never separated from spent fuel, the
radioactivity of which deters proliferation and diversion efforts. These systems
build on the fact that contemporary light-water reactors using low-enriched
uranium in a once-through fuel cycle that leaves the plutonium mixed with
fission products in spent fuel are the most prominent operational example of a
relatively proliferation-and-diversion-resistant fuel cycle. An improved variant
of this approach is advanced once-through reactor and fuel cycle technologies
for which the quantities of weapons-usable materials available in spent fuel are
reduced - thereby reducing incentives to mine spent fuel for weapons-usable
materials. A completely different approach is to convert nuclear energy to
electricity and hydrogen in large international energy parks at which
weapons-usable materials are maintained under tight international control and to
distribute these carriers to distant consumers. The next subsection discusses
proliferation and diversion issues associated with nuclear fuel reprocessing and
plutonium recycling for today’s civilian nuclear power technology.
|
BOX 8.5. NUCLEAR WEAPONS PROLIFERATION RISKS POSED BY
NUCLEAR ENERGY TECHNOLOGIES
Nuclear explosives can be made both from highly enriched uranium
and plutonium, including plutonium produced in civilian nuclear power plants.
Although there are complications in weapon design, fabrication, and maintenance
when reactor-grade instead of weapons-grade plutonium is used, these do not add
substantially to those that must be faced when using any nuclear-explosive
material for making weapons, according to individuals and groups with
authoritative knowledge of nuclear weapons technology (Holdren, 1989; Mark,
1993; CISAC, 1994, 1995). Reactor-grade plutonium can be used to construct
devastating nuclear weapons at all levels of technical sophistication (DOE,
1997). So that the dangers of reactor-grade plutonium will not continue to be
misunderstood, in recent years the U.S. Department of Energy (custodian of the
world’s most sophisticated knowledge base on the subject) has made this
point clear in unclassified reports and has allowed those with DOE
nuclear-weapon security clearances to make explicit statements about it in other
forums. Especially relevant points are made in the following quotations:
The difficulties of developing an effective design
of the most straight forward type are not appreciably greater with reactor-grade
plutonium than those that have to be met for the use of weapons-grade plutonium.
(Mark, 1993)
Using reactor-grade rather than weapons-grade plutonium would
present some complications. But even with relatively simple designs such as that
used in the Nagasaki weapon - which are within the capabilities of many nations
and possibly some subnational groups - nuclear explosives could be constructed
that would be assured of having yields of at least 1 to 2 kilotons. With more
sophisticated designs, reactor-grade plutonium could be used for weapons having
considerably higher minimum yields. (CISAC, 1994)
At the other end of the spectrum, advanced nuclear weapon states
such as the United States and Russia, using modern designs, could produce
weapons from reactor-grade plutonium having reliable explosive yields, weight,
and other characteristics generally comparable to those of weapons made from
weapons-grade plutonium. (DOE, 1997)
Although there are more direct ways for a country to acquire
nuclear bombs than from its commercial nuclear energy facilities (for example,
centrifuges for uranium enrichment and special reactors dedicated to plutonium
production), the acquisition of nuclear explosive materials is made easier if
the requisite technical skills and infrastructure are already in place through a
nuclear power programme. The existence or prospect of commercial nuclear power
in a country, moreover, provides a legitimating cover for nuclear activities
that, without electricity generation as their manifest purpose, would be
considered unambiguously weapons-oriented and thus potentially subject both to
internal dissent and external sanctions and counter-measures. Feiveson (1978)
points out that even countries that initially have no intention of acquiring
nuclear weapons might later be more likely to acquire them, under altered
internal or external political circumstances, because their having a nuclear
power programme has made it easier to do so. |
|
BOX 8.6. INSTITUTIONAL MECHANISMS ADDRESSING PROLIFERATION
RISKS OF NUCLEAR ENERGY
International efforts to stem the spread of nuclear weapon
capabilities have been more successful than almost anyone at the beginning of
the nuclear era dared to hope. Rather than the dozens of nuclear weapon states
once predicted, today only eight states are believed to have nuclear weapons
capabilities, a number that has not increased for more than 10 years. Indeed,
South Africa has provided the first case of genuine nuclear disarmament - a
state that had full control over its own arsenal of nuclear weapons and agreed
to give them up entirely. The international regime that has achieved this result
includes both political elements designed to convince states that acquiring
nuclear weapons is not in their interest, and technical elements designed to
increase the detectability, difficulty, and cost of nuclear weapons acquisition.
The foundation of this regime is the Nuclear Non-Proliferation Treaty, which now
has 187 parties - more than the United Nations Charter. The civilian nuclear
energy programmes of all of these besides the five nuclear-weapon states
recognised by the treaty are subject to ‘full scope’ IAEA
(International Atomic Energy Agency) safeguards designed to verify their
commitments not to acquire nuclear weapons.
Several parts of the non-proliferation regime are designed to
address the nuclear weapons proliferation risks posed by civilian nuclear energy
programmes. The most fundamental part is IAEA safeguards, which allow
international verification of the peaceful use of all nuclear materials in
non-nuclear-weapons states (OTA, 1995). In the aftermath of the post - Gulf War
revelation of Iraq’s large-scale clandestine nuclear weapons programme, and
the failure of previous IAEA monitoring and inspections to detect it, IAEA
safeguards are being substantially strengthened, with new measures designed not
only to verify that nuclear material at declared sites is not misused, but also
to help ferret out activities that may be taking place at secret sites (Hooper
1997). Other critically important institutional measures to reduce the risk of
proliferation include the international system of controls on exports of
technologies that could be used for nuclear weapons programmes, as well as
programmes to ensure that all potentially weapons-usable nuclear material is
secure and accounted for - and so cannot be stolen for use in nuclear weapons by
proliferating states or terrorist groups.
But confidence in the future effectiveness of the
non-proliferation regime in general, and the barriers to use of nuclear-energy
technologies for proliferation in particular, cannot be unconditional or
complete. The non-proliferation regime itself is imperilled by the recent
efforts in this direction by Iraq and the Democratic People’s Republic of
Korea, and by the failure of the recognised nuclear-weapons states (above all,
Russia and the United States) to move more decisively, in the aftermath of the
cold war, towards fulfilling their legal obligation under Article VI of the
Nuclear Non-Proliferation Treaty to negotiate in good faith towards nuclear
disarmament (Barletta and Sands, 1999). The extensively documented case of Iraq,
in particular, demonstrates that eternal vigilance is required to prevent states
from clandestinely acquiring critical technologies despite the existence of
export controls on them.
Moreover, the safeguards implemented by the IAEA - which include
monitoring of records and on-site inspections at reactors and fuel-cycle
facilities, along with the broader measures beginning to be implemented in the
aftermath of the Gulf War - at best only provide assurance that diversion of
nuclear materials to weaponry will be detected. These safeguards are not
intended to prevent such diversion, or to prevent theft of these materials by
sub-national groups. (Protection against theft is the province of individual
states; there are no binding international standards governing the adequacy of
such protection, and levels of protection vary world-wide from excellent to
grossly inadequate.) Even detection of diversion or theft is not completely
assured, both because of limitations on the resources being provided to the IAEA
and because of the intrinsic difficulty of the task of safeguarding nuclear
materials, particularly when large quantities of weapons-usable nuclear material
are being processed in bulk.
This difficulty has been recognised since the dawn of the
nuclear era. Addressing the adequacy of international inspections for the
purpose of preventing nuclear proliferation, the Acheson-Lillienthal Report that
formed the basis of the Baruch Plan for international control of nuclear weapons
(submitted to the UN by the United States in 1946) stated that "there is no
prospect of security against atomic warfare in a system of international
agreements to outlaw such weapons controlled only by a system which relies on
inspection and similar police-like methods. The reasons supporting this
conclusion are not merely technical but primarily the inseparable political,
social, and organizational problems involved in enforcing agreements between
nations, each free to develop atomic energy but only pledged not to use
bombs...So long as intrinsically dangerous activities may be carried on by
nations, rivalries are inevitable and fears are engendered that place so great a
pressure on a systems of international enforcement by police methods that no
degree of ingenuity or technical competence could possibly cope with them"
(Lillienthal and others, 1946). |
Nuclear fuel reprocessing and plutonium recycling.
Several countries have begun commercial-scale reprocessing to recover plutonium
along with unused uranium from spent fuel (with intentions to dispose of the
separated radioactive wastes in geologic repositories at a future date) and to
recycle plutonium in mixed-oxide uranium-plutonium (MOX) fuel for LWRs. These
activities make the nuclear weapons proliferation risk a more serious concern
than when LWRs fuelled with low-enriched uranium are operated on once-through
fuel cycles.
Commercial LWR fuel-reprocessing systems have been established
in France (at La Hague), Russia (Chelyabinsk-Ozersk), and the United Kingdom
(Windscale-Sellafield).74 These facilities are nodes of a global
nuclear fuel management system in which spent fuel is sent from reactors to
reprocessing plants, and the separated constituents (uranium, plutonium,
radioactive wastes) are to be returned (eventually) to the fuel owners.75
These three sites are reprocessing fuel from about 150 reactors operating
in nine countries (Berkhout, 1998).
Reprocessing facilities now handle a fourth of the spent fuel
discharged from power reactors. The rest is in interim storage, either targeted
for eventual geological disposal in canisters designed for direct disposal
without reprocessing, or (for the majority of the material outside Canada and
the United States) pending a decision on whether to go to geological storage or
reprocessing. Today 20 tonnes of plutonium is being separated from spent fuel
annually world-wide; by the end of 1995, 180 tonnes had been separated from
civilian nuclear reactor spent fuel - 18 percent of the total plutonium
discharged from these reactors (Albright, Berkhout, and Walker, 1997). Some of
the recovered plutonium and uranium mixed with fresh uranium (MOX fuel) is being
used as fuel for LWRs. The challenge of managing the growing stockpile of
separated civilian plutonium (the total quantity separated less the amount used
as fuel in plutonium recycling, about 180 tonnes world-wide as of 2000)
parallels the problem of managing the growing quantity of separated surplus
military plutonium produced by dismantling excess nuclear weapons in the
aftermath of the cold war, now approaching 100 tonnes in Russia and the United
States combined (PCAST Panel on ICERD3, 1999).
Although it reduces uranium requirements for power generation,
the reprocessing-recycling option does not compete in economic terms with
once-through use of low-enriched uranium fuel in LWRs,76 reflecting
the fact that it has become clear that the world has large, low-cost reserves of
uranium (chapter 5). Yet reprocessing and recycling activities continue for a
number of reasons: sunk capital costs, government subsidies, long-term contracts
signed when uranium seemed scarcer and costlier, reluctance to throw away the
energy content of unrecycled plutonium and uranium, perceptions that reprocessed
wastes are easier to manage than spent fuel, and lack of alternatives to
reprocessing as a means of removing spent fuel from reactor sites in the short
term (PCAST Panel on ICERD3, 1999).
Nuclear waste disposal
The radioactive by-products of fission must be isolated from the
human environment to the extent that they can never return in concentrations
that could cause significant harm. Spent fuel removed from a reactor is first
stored for at least a few years in cooling pools at the reactor site. After the
very short-lived fission products have decayed, the fuel can:
· Remain in the
pools (if they have sufficient capacity).
· Be stored on-site in dry casks
(which provide a safe and economic alternative for storage for several decades).
· Be transported to an
away-from-reactor storage site (either pools or dry casks).
· Be transported to a
reprocessing plant or a geologic disposal facility.
In many cases efforts to expand long-term storage capacity
on-site or particularly to establish large away-from-reactor stores not
associated with reprocessing or disposal sites have encountered public
opposition, leaving some utilities in doubt as to where to put their spent fuel
as their cooling ponds fill up.
Eventually, the spent fuel will either be reprocessed, and the
high-level wastes sent to a long-term storage site, or it will be encapsulated
in suitable canisters and sent directly to a long-term disposal site. Safe ways
of storing wastes for periods up to 1 million years may be required. For the
first hundred years of the required isolation period, the radioactivity and heat
of these wastes are dominated by fission products. After several hundred years,
the major concerns are the very-long-lived transuranics (various isotopes of
plutonium, neptunium, and Americium) and long-lived iodine and technetium
fission products.
There is a consensus among states using nuclear energy that deep
geologic disposal in mined repositories is the best currently available approach
for disposal of nuclear wastes.77 And most experts believe that
geologic repositories can be designed to be safe (NEA, 1999). However, to date,
no country has yet disposed of any spent fuel or high-level waste in such a
repository.
Because wastes are concentrated, disposal cost is not a
significant issue. In the United States, for example, utilities are charged only
$0.001 per kilowatt-hour for management and disposal of their spent fuel (2 - 3
percent of generation cost). Detailed calculations suggest that this will be
fully adequate to finance that portion of the cost of the nuclear waste disposal
programme attributable to civilian spent fuel (DOE, 1998). Costs would be higher
for small countries if repositories were established there to accommodate only
their own wastes.
Public and political opposition to waste disposal has delayed
efforts to open targeted repositories in some countries. There have also been
technical problems. But long-term waste disposal should not be an intractable
problem from a technical perspective. Even if some wastes eventually leak from
repositories, problems would be manageable because of the small storage space
required.
For example, storage density limits for spent LWR fuel at Yucca
Mountain, Nevada, are 41 square metres per megawatt-electric of nuclear
generating capacity for a power plant operated for 30 years (Kadak, 1999). At
this storage density, the area required for storing all radioactive waste
generated during the 21st century for the global high-nuclear-growth scenario
above is 270 square kilometres. Suppose that a waste-isolation land area 10
times as large is purchased at a cost of $100,000 per hectare to be maintained
in perpetuity with no human intrusion. The required land area is 0.003 percent
of the continental land areas. The cost of the land would be $0.0009 per
kilowatt-hour generated (2 percent of generation cost) for a 10 percent discount
rate, or $0.00002 per kilowatt-hour (0.05 percent of generation cost) for a 0
percent discount rate, assuming in both cases that the land is paid for in 2000.
Because the areas required are modest, it is not necessary for
every country to develop its own repository. Globally, only a small number of
sites is needed. Restricting storage to a small number of favourable sites
around the world would be attractive for various reasons (McCombie, 1999a, b;
McCombie and others, 1999; Miller and others, 1999), including realisation of
scale economies, the potential for optimising the prospects for achieving
demonstrable safety, and various additional reasons discussed below.
Although coping with the radioactive waste problem seems
manageable from a technical perspective, a technical fix by itself is not a
solution: A real solution has many non-technical features as well (see below).
Must spent fuel be reprocessed for radioactive waste
disposal? At one time, it was thought by some that reprocessing is needed to
safely dispose of radioactive wastes. However, the International Fuel Cycle
Evaluation, carried out from 1977 - 79 to consider the commercial use of
plutonium, concluded that spent fuel itself could be safely disposed of in a
waste repository (STATS, 1996). This conclusion has been strengthened by
subsequent intensive investigations of spent fuel disposal in several countries
(for example, Finland, Sweden, and the United States).
Nevertheless, both public opposition to interim
away-from-reactor storage sites and delays in opening long-term waste
repositories are causing great difficulties for utilities, because storage pools
at reactor sites are fast approaching capacity. In some countries (not the
United States, which has abandoned civilian reactor fuel repossessing), nuclear
utilities have been forced into reprocessing as a de facto interim waste
management strategy. But reprocessing does not solve the waste disposal problem
- it merely buys time and transforms the spent fuel management problem into
several other problems associated with plutonium disposition: management of
high-, medium-, and low-level wastes at reprocessing plants; management of
transuranic wastes at plutonium fuel fabrication plants; and, eventually,
decommissioning wastes from these plants (plus residual spent-fuel disposal, if
plutonium is not recycled indefinitely).
Should long-lived wastes be separated and transmuted? The
challenge of storing the very-long-lived components of radioactive wastes has
led to various separations and transmutation (S&T) proposals for separating
out the hazardous, long-lived components and transmuting them by neutron
bombardment to form nuclides that would be either stable or radioactive with
much shorter half-lives. The Committee on Separations Technology and
Transmutation Systems (STATS) was formed by the U.S. National Research Council
at the request of the U.S. Department of Energy to evaluate alternative S&T
options for addressing such issues and assess their implications for nuclear
waste management.
The STATS committee investigated several alternative reactor and
particle accelerator systems. It found that, although S&T might be
technically feasible for some of the options studied, the need for permanent
long-term storage would remain. Many decades to centuries would be required to
reduce the radioactivity to the low levels specified by S&T proponents as
their objective, and disposal costs would increase substantially (STATS,
1996).78 Moreover, it is unlikely that the modest reduction in
waste-disposal risk for the long term (which is already very small) would
outweigh the high costs and increased near-term accident and proliferation risks
that would be associated with S&T (Fetter, 1999). The most active programmes
in this area are those of France, Japan, Russia, Sweden, and the United States.
Towards geological disposal. As noted, the focus
world-wide for long-term disposal is on geologic repositories. All concepts rely
on multiple barriers provided by the storage canisters, the backfill material
used to surround the canisters in the storage rock, and the rock itself. Test
results suggest that corrosion-resistant containers may be able to keep nearly
all the waste contained for thousands of years.
|
Effectively addressing nuclear
concerns probably
requires
advanced technologies as well
as improved institutional
risk
management
strategies. |
There have been setbacks, though not always for scientific and
technical reasons; public and political opposition has sometimes slowed
technical progress. In the United States, public acceptability considerations
led Congress to choose the Yucca Mountain site in sparsely populated Nevada,
even though technically it may not be an especially good site (Fetter,
1999).79
Advances in waste disposal science and technology have been
rapid in Sweden, where the decision to phase out nuclear power facilitated a
societal consensus on a waste disposal programme (Gillena, 1994). Swedish
researchers are developing a scheme to put spent fuel in copper-clad steel
canisters to be embedded in bentonite clay in a granite monolith 600 metres
underground at a site near the sea; they anticipate a million-year canister
lifetime for the site’s reducing conditions (Whipple, 1996). Should the
storage canisters eventually leak, surrounding backfill material and rock would
inhibit movement of leaked wastes to the surface.
The widely shared judgement of the technical community that
long-term storage can be made safe is based on careful assessments of safety and
environmental impacts that take into account both waste characteristics and the
properties of all barriers involved. Several extensive safety assessments have
been carried out in OECD countries. Potential radiation exposures have been
calculated to be close to zero for periods of 100,000 years for all scenarios
and sites considered; for longer periods, the risks are so small as to impose
very small additional externality costs, even if there is no discounting for
these uncertain remote future events.80
Technical uncertainties need further study.81 But
none is likely to be a show-stopper. Moreover, there is time to resolve
technical issues because, from a technical perspective, there is no urgency to
move wastes from interim to permanent long-term storage sites. In fact, delay
for a period of 50 years would not only buy time to improve scientific
understanding of long-term storage issues and storage technology, but would also
facilitate waste disposal by reducing required heat removal rates as a result of
radioactive decay of fission products. Delaying long-term waste disposal would
probably require establishing secure storage sites (which might be the same as
the long-term disposal sites) for spent fuel for part of this cooling off
period; but, as recent experience has shown, this will not be easily
accomplished in the political arena.
Will spent fuel repositories become plutonium mines? A
final technical waste disposal issue relates to the concern that, if radioactive
wastes are stored as spent fuel rather than reprocessed wastes, repositories
might one day be mined as sources of low-cost plutonium for nuclear weapons. The
Committee on International Security and Arms Control of the U.S. National
Academy of Sciences has identified general proliferation hazards associated with
spent fuel management, including the issue of mining waste repositories for
plutonium recovery, as an area warranting continued research "at the conceptual
level" (CISAC, 1994).
Peterson (1996) has argued that, after a hundred years or so,
the costs of clandestine tunnelling into spent fuel repositories to recover
plutonium would be less than the costs for conventional dedicated facilities to
acquire plutonium. In examining this issue, Lyman and Feiveson (1998) found that
the range of conditions under which repository mining would look attractive
relative to other means of acquiring plutonium is narrow. Although safeguards
would be needed in perpetuity, the measures needed to deter mining need not
involve expensive and intrusive inspections but could focus on containment and
surveillance procedures, including remote monitoring by satellites. And the
safeguard management challenge would be greatly facilitated if there were only a
small number of repositories around the world.
Perspective on radioactive waste disposal. The most
important unresolved issues relating to radioactive waste disposal are political
rather than technical. Providing adequate disposal capacity for nuclear wastes
has been and is likely to continue to be fraught with political controversy.
The world would be better off if secure, internationally
managed, interim, away-from-reactor storage sites could be set up for spent
fuel, even for periods of 50 years before activating any permanent repository.
If such interim storage capacity were to become available, fewer and fewer
utilities would be willing to pay the extra near-term costs of reprocessing, and
the reprocessing industry would slowly be competed out of business. Yet the
world is not moving in this direction. As noted by H�ckel (1997):
The historical record of the past decades is
littered with the acronyms of defunct proposals for an internationalised back
end fuel cycle... Not only have these not materialised; it appears that at the
back end of the fuel cycle internationalisation is actually on the retreat...
Stalemate and procrastination seem to be a general phenomenon of fuel cycle
policy everywhere.
O’Neill (1998) identifies several factors as inhibiting the
development of an international spent fuel management regime or regimes:
widespread political and public opposition to siting of storage facilities
(which would be heightened in a country faced with the prospect of becoming the
world’s nuclear dumping ground) and to transport radioactive substances
within countries and across borders; differences in national interests and
practices (for example, it is unlikely that most states with existing
reprocessing capacity will give it up); sovereignty concerns; compliance,
information gathering, and dissemination issues (states need assurances that if
they comply, others will too, with appropriate verification provisions); and the
long time horizons involved (for example, even interim storage sites would have
to outlast not only political lives but the actual lifetimes of most political
leaders).
O’Neill offers no easy answers to this stalemate but
suggests an evolutionary strategy focussing initially on regional rather than
global arrangements, because states in a geographic region are more likely to
share common norms (although, of course, animosities can also be intense at the
regional level). And although both interim and permanent disposal face political
opposition, there are probably fewer obstacles to the
former.
Advanced nuclear generating options for the immediate future
In what follows, near-term advanced nuclear generating
technology options are described, focussing on advanced LWR and fuel cycle
technologies, and the pebble bed modular reactor. No attempt is made to be
comprehensive; rather, the intent is to use these examples to illustrate what
advanced technologies offer to address the challenges posed by current nuclear
technologies.
Advanced light water reactors
Can LWR technology improvements help in addressing the
challenges facing current technologies? Simpler plant designs and shorter plant
construction periods would help bring down costs. Improved safety designs could
help restore public confidence in nuclear power. And more
proliferation-resistant designs would reduce proliferation and diversion risks.
Evolutionary advanced light water reactors. In recent
years the main nuclear reactor vendors have developed modified LWRs that offer
both improved safety and lower cost than LWRs now in use (NRC, 1992; CISAC,
1995; Kupitz and Cleveland, 1999).82 These modified LWRs build on
more than 40 years of experience with LWR technology to provide technological
improvements in standardised designs, for which there can be a high degree of
confidence that performance and cost targets will be met. All of the modified
LWRs use active but simplified safety systems, and some have some passive safety
features.
One reactor in this category is the Westinghouse AP600, a
600-megawatt-electric pressurised water reactor (PWR). The design is simpler
than existing PWRs; and it is modular, with about half the capacity of most
existing PWRs - which allows some components to be factory-built and assembled
faster on-site at lower cost than for plants that are entirely
field-constructed. The AP600 is expected to be safer than existing PWRs, able to
be constructed in 3 years, and cost about 15 percent less than existing PWRs of
the same capacity (NPDP, 1998). In late 1999 the AP600 received design
certification from the U.S. Nuclear Regulation Commission.
Also in this category are the ABB/Combustion Engineering System
80+ and the GE Advanced Boiling Water Reactor (ABWR); both received design
certification from the U.S. Nuclear Regulatory Commission in 1997. The System
80+ is a large (1,350-megawatt-electric) unit, for which the estimated core
damage frequency is 2.7 times 10-6, two orders of magnitude lower
than for its predecessor. The ABWR has as a design objective a core damage
frequency of less than 10-6 and a target capital cost that is 20
percent less than for BWRs previously built in Japan (NPDP, 1998). Two ABWRs are
now operating in Japan. Two more are under construction in Japan and also in
Taiwan (China).
In Europe a Framatome-Siemens joint venture and a group of
‘nuclear’ German utilities have developed the European pressurised
water reactor (EPR), a 1,750-megawatt-electric system designed to specifications
endorsed by utilities in Europe - with hoped-for economies of scale at this
large unit size. The EPR is being offered on the international market.
Shifting light water reactors to a denatured uranium-thorium
fuel cycle. If the advanced LWRs described above were operated on
low-enriched uranium in once-through fuel cycles, they would be as proliferation
and diversion resistant as existing LWRs, with fission products in spent fuel
deterring plutonium removal by would-be proliferators and diverters. But because
plutonium inventories build up quickly (200 kilograms a gigawatt-electric per
year) - posing a significant proliferation hazard if the plutonium is separated
by reprocessing, and conceivably making spent fuel at reactors or in off-site
storage potential targets for proliferation and diversion - attention has been
given recently to LWRs operated on a denatured uranium-thorium once-through fuel
cycle that is more proliferation-diversion-resistant even than current LWRs
operated on a once-through fuel cycle (Gasperin, Reichert, and Radkowsky, 1997;
Herring and MacDonald, 1998).
Although it would not differ markedly from current LWR
technology with regard to capital cost and safety, the LWR operated on a
denatured uranium-thorium once-through fuel cycle would produce less transuranic
wastes than current LWRs. Most important, it would have proliferation and
diversion resistant features relating to both plutonium and uranium. Only a
fifth as much plutonium would be generated in spent fuel as in an LWR fuelled
with low-enriched uranium. Moreover, the plutonium would contain a significant
amount of Pu-238, which generates heat that makes weapon manufacture more
difficult. In this cycle the U-233 is bred from thorium denatured by the U-238,
at enrichment levels such that this uranium cannot be used to make weapons
without further enrichment; moreover, the uranium contains gamma-emitting
daughters of U-232, which makes weapon manufacture more difficult.83
The technology is not diversion-proof. Reliable nuclear weapons
could be made by many nations from both plutonium and uranium that could be
recovered from spent fuel by relatively straightforward chemical means.84
In the hands of terrorists or an unsophisticated country, the recovered
plutonium could be used to make weapons with yields of 1 or 2 kilotons. These
reservations notwithstanding, this system would be more proliferation-resistant
than a conventional LWR operated on slightly enriched uranium, because
incentives for recovering weapons-usable material from spent fuel would be less.
Yet discussion of the specifics of this particular technology
shows that setting goals for proliferation and diversion resistance will not be
easily accomplished. This is because trade-offs must be taken into account in
considering the weapons potential of the plutonium and uranium materials
involved.
|
There seem to be reasonably
good prospects for
making
reactors demonstrably safe
while simultaneously
reducing costs.
|
The pebble bed modular reactor. For decades, a different
approach to nuclear fission based on moderating the reactor with graphite and
cooling it with helium (rather than using water for both purposes in LWRs) has
been under development in several countries. These high-temperature gas-cooled
reactors (HTGRs) typically involve large numbers of tiny uranium fuel pellets
encased in layers of carbon, silica, or both (designed to contain the fission
products from the reaction). These pellets are generally pressed into larger
fuel elements, which are either encased in solid graphite blocks or circulate
through the reactor core in a so-called pebble bed system.85
Modern HTGRs are designed to be passively safe, offering the
potential to avoid many of the complex, expensive safety systems used in LWRs.
Moreover, HTGR concepts are being explored that would have lifetime cores - that
is, they would be installed, switched on, and the operators would not have to do
anything about fuelling or de-fuelling for the life of the reactor. In
combination, it is hoped that such features could lead to lower costs and
improved safety. In what follows, design and performance issues for the pebble
bed modular reactor (PBMR) are discussed to illustrate the possibilities that
might be offered by HTGR technology.
The key to enhanced safety for the PBMR is a design that ensures
that the highest temperature in the reactor core - under any conceivable
operating or accident condition - never exceeds the 1,600 degrees Celsius
operating limit of the fuel. This requirement limits the thermal output for a
single module to 250 megawatts-thermal and the electrical output to 100
megawatts-electric - a factor of 10 smaller than for a typical LWR. The
viability of the technology depends, among other things, on being routinely able
to produce high-quality fuel particles and pebbles. There have been problems in
the past in particle design and manufacturing, leading to release of
radioactivity from the particles (NRC, 1992). In addition, the direct helium gas
turbine cycle required with the PBMR is undemonstrated for a nuclear plant and
requires substantial engineering (CISAC, 1995).
The spent fuel of the PBMR would be high-burn-up material in
many tiny spheres, making it a comparatively unattractive source from which to
recover weapons-usable material. Moreover, the PBMR and other HTGR variants
could be operated on a denatured uranium-thorium once-through fuel cycle that
would have the same proliferation and diversion resistance features as an LWR
operated on this fuel cycle (Feiveson, von Hippel, and Williams, 1979).
The PBMR’s extraordinarily low power density86
(a key safety feature) and modest scale will tend to drive up its specific
cost (dollars per kilowatt-electric). But developers hope that these
diseconomies will be offset at least partially by cost-saving opportunities -
including design simplicity and system modularity that facilitate
standardisation and realisation of mass production economies with a high
fraction of the construction taking place in factories. Use of a closed-cycle
helium gas turbine instead of a steam turbine for energy conversion assists in
this objective, because this turbine’s specific cost is lower and less
scale-sensitive than the LWR’s steam turbine.
Eskom, the South African utility attempting to develop the
technology (Nicholls, 1998), is targeting a capital cost of $1,000 per
kilowatt-electric under mass production conditions for a power plant made up of
a block of 10 100 MWe modules. This is far less than the costs of
$1,700 - 3,100 per kilowatt-electric that characterise today’s LWRs
(Paffenbarger and Bertel, 1998). Despite the good prospects for cost cutting as
a result of the PBMR’s attractive features (such as passive safety,
modularity, and the relative scale insensitivity of the helium turbine’s
capital cost), this is an aggressive cost target, considering the high capital
cost for the reactor itself that is inherent in its low power density - which
requires, for example, very large and costly reactor vessels that can withstand
high operating pressures. An MIT group investigating the PBMR estimates a
capital cost about twice that estimated by Eskom (NPPDP, 1998). Earlier
independent estimates of the capital cost of other HTGR systems, such as the
General Atomics system developed in the United States, tended to be consistently
higher than the costs of LWRs, because of the low power density of the HTGR
concept (NRC, 1992).
The technology is at too early a developmental stage to
ascertain which of these estimates is closer to what can be expected in a
commercial product. If the MIT estimate turns out to be close to the mark, the
cost of electricity from this plant (table 8.15) would be about the same as for
an coal integrated gasifier - solid oxide fuel cell - steam turbine power plant
with CO2 separation and sequestration (see table 8.9). If the cost
turns out to be closer to the Eskom estimate, the direct economic balance would
tip in favour of the PBMR. In such circumstances, other factors such as public
attitudes towards waste disposal could be important determinants in the race
between nuclear and fossil technologies to near-zero emissions.
In contrast to the approach being taken for advanced LWR
development - an activity that is well advanced; involves making only
incremental, evolutionary changes relative to existing LWRs; and can build on a
well-established industrial base - industrial activity relating to HTGRs is
embryonic. No HTGR has yet been economically competitive. Nevertheless, the
concept illustrates reasonable prospects for achieving at least the goal of
demonstrable
safety.
Nuclear energy for the long term
Uranium resource constraints might someday become important
determinants of nuclear technology development. For the global
high-nuclear-growth scenario discussed above, cumulative uranium requirements to
2050 with current technology are 3 million tonnes - less than reasonably assured
resources recoverable at less than $130 a kilogram, so that resource constraints
are not important in this period. But cumulative uranium requirements to 2100
for this scenario are close to the estimated 20 million tonnes of conventional
uranium resources (including 12 million of speculative resources; chapter 5).
Thus, sometime after 2050, technology that can address the
resource constraint challenge might have to become available under
high-nuclear-growth conditions. Can advanced technologies address this potential
constraint while simultaneously satisfying cost, safety, and proliferation and
diversion concerns? In light of prospective long research and development
gestation times and the need to make rational near-term research and development
resource allocation decisions regarding post-2050 deployment options, it is
important for this report to address this question. Five options are considered:
conventional plutonium fast breeder reactors; alternative breeder concepts;
extracting uranium from seawater; large-scale, interna-tionalised nuclear energy
parks; and thermonuclear fusion.
Conventional plutonium fast breeder reactors
Until the mid-1970s, it was thought that uranium was scarce.
Therefore, it was expected that the LWR would be a stop-gap technology to
provide start-up fuel for the fast breeder reactor (FBR), which by 1990 would
overtake the LWR as the technology of choice for new plants (Lidsky and Miller,
1998).87
The LWR makes use of only 0.5 percent of the fission energy
stored in natural uranium - primarily that in the fissile (chain-reacting)
isotope U-235, which accounts for only 0.7 percent of natural uranium. The FBR
would alleviate this constraint by transmuting a large fraction of the abundant
fertile isotope U-238 through neutron capture into fissile isotopes of plutonium
- making it possible to extract 50 - 100 times as much energy from a kilogram of
uranium as the LWR. Among FBR options, particular attention was given to the
liquid-metal (sodium) cooled fast breeder reactor (LMFBR), which offered the
potential of being an effective fuel factory that could produce excess plutonium
- adequate not only to sustain itself but also to serve as seed stock for a
rapidly growing fleet of similar reactors.
The LWR-FBR vision has not materialised, and the prospects that
it ever will are not bright. Although a few countries have FBR development
programmes (China, France, India, Japan, Russia), these programmes are in
virtual stasis. Most countries have abandoned once-ambitious programmes as a
result of unpromising economics and a much brighter global outlook for uranium
supplies (chapter 5) than when FBR programmes were originally put in
place.88 By the late 1970s it had become clear that FBR unit capital
costs (dollars per kilowatt) would be much higher than for LWRs and that costs
for fabricating MOX LWR fuel and FBR fuel would be far higher than previously
projected. Life-cycle cost comparisons made at that time showed that the FBR
could not compete with the LWR at then-projected uranium prices (Feiveson, von
Hippel, and Williams, 1979). And now, with expectations that relatively low-cost
uranium resources are far more abundant than was thought 20 years ago, it
appears that the need for an FBR or alternative uranium-saving technology will
not materialise before 2050, and possibly long after that (STATS, 1996).
TABLE 8.15. TWO ESTIMATES OF THE ELECTRICITY GENERATION
COST FOR THE PEBBLE BED MODULAR REACTOR (DOLLARS PER THOUSAND
KILOWATT-HOURS)
|
Cost component |
Estimate based on
Eskom
parametersa |
Estimate based on
MIT parametersb
|
|
Capitalc |
16.4 |
34.2 |
|
Operation and maintenanced |
4.1 |
4.1+0.6e |
|
Fuel |
3.8 |
3.8 |
|
Total |
24.3 |
42.7 |
Note: Estimates are for a 1,000 megawatt-electric
plant made up of 10 100-megawatt-electric modules.
a. Data are from Nicholls,
1998. b. Data are from Kadak, 1999. c. For an annual capital charge rate of 11.5
percent and an 80 percent capacity factor. The unit capital cost estimated by
Eskom and MIT analysts are $1,000 and $2,090 per kilowatt-electric,
respectively. d. The staffing requirement for the plant is estimated to be 80
persons by Eskom (Nicholls, 1998) and 150 persons by MIT analysts (Andy Kadak,
private communication, 8 September 1999). e. The $0.6 per thousand
kilowatt-hours component of the cost is for decommissioning (Kadak,
1999).
Alternative breeder concepts
If uranium scarcity concerns should one day force a shift to
breeder reactors, it would be desirable to have technologies that are
simultaneously demonstrably safe and cost competitive and much more
proliferation and diversion resistant than conventional liquid-sodium-cooled
plutonium fast breeder reactors, which involve reprocessing spent fuel and
recycling recovered plutonium in fresh reactor fuel.89
One set of such technologies is metal-cooled fast reactors, for
which plutonium is never separated from fission products. One variant of the
concept under investigation is a metal-cooled fast reactor using lead or a
lead-bismuth eutectic instead of sodium as the liquid metal coolant (Filin and
others, 1999, Hill and others, 1999; Lopatkin and Orlov, 1999; Orlov and others,
1999; Zrodnikov and others, 1999), building on Russian work carried out on
lead-bismuth-cooled reactors for submarine applications.90 Spent fuel
reprocessing technology for these reactors would be designed to extract most
fission products for waste disposal but leave 1 - 10 percent of the fission
products plus plutonium and most transuranics in the reprocessed fuel that is
returned to the reactor. The radiation hazard from residual fission products and
transuranics would deter would-be proliferators and diverters.
Some natural or U-235-depleted uranium would be added to
reprocessed fuel as source material to generate more plutonium in the reactor;
the reactor would be designed to produce from uranium as much plutonium as it
consumes.91 A high level of burn-up of transuranics and long-lived
fission products in the spent fuel could be achieved with repeated recycling and
appropriate reprocessing technology - without the need for separate burners for
transuranics and long-lived fission-products. Moreover, reprocessing plants
might be co-sited with reactors, to eliminate proliferation and diversion risks
associated with the transport of spent and reprocessed fuel. A modest-scale
(100-megawatt-electric) version with a lifetime (15-year) sealed core has been
proposed for developing country applications (Hill and others,
1999).92
Although this liquid metal reactor technology would deal
effectively with the uranium supply constraint challenge and be more
proliferation and diversion resistant than conventional plutonium breeder
reactors, the reactors would have very large plutonium inventories - for
example, 8 - 9 tonnes for a large 1,200-megawatt-electric design (Filin and
others, 1999) and 2.5 tonnes for a small 100-megawatt-electric unit with a
lifetime reactor core (Hill and others, 1999).93 Although the system
would be designed so that plutonium would never be fully separated from spent
fuel, such systems would provide their operators with extensive knowledge of,
experience with, and facilities for chemical processing of intensely radioactive
spent fuel, which could provide the basis for moving quickly to separating
plutonium for a weapons programme should a decision be made to do so.
Moreover, for safeguards, either new measurement technologies
would have to be developed to allow accurate material accounting for the
intensely radioactive material involved in these fuel cycles, or almost complete
reliance would have to be placed on containment and surveillance measures rather
than material accounting. Hence, although such systems would certainly have
higher inherent proliferation resistance than traditional reprocessing and
recycling approaches involving fully separated, weapons-usable plutonium, the
overall proliferation risks that might result from widespread deployment of
these technologies across the globe are likely to be the focus of considerable
debate in the technical community, should large-scale deployment ever seem a
realistic possibility.94
Other alternative breeder concepts include molten salt thermal
breeder reactors that would integrate continuous reprocessing for removal of
fission products with reactor operations (Tinturier, Est�ve, and Mouney, 1999)
and various particle-accelerator-based reactor concepts. Each seems to have one
or more attractive features relative to conventional breeder reactor concepts,
but all are technologies whose relative merits regarding cost, safety,
proliferation-diversion risk, and waste disposal are the subject of intense
debate in the technical community (NRC, 1992; CISAC, 1995).
Extracting uranium from seawater
If low-cost uranium resources are much more abundant than
indicated by conventional uranium resource estimates (chapter 5), even high
nuclear growth to 2100 and beyond could be realised with proliferation and
diversion resistant once-through fuel cycles. The recovery of uranium from
seawater is one promising option for extending uranium resources; preliminary
estimates of recovery costs are $100 - 300 per kilogram (chapter 5). Although
the high estimated recovery cost is more than 10 times the current uranium
price, it would contribute just $0.004 per kilowatt-hour to the cost of
electricity for an HTGR operated on a once-through denatured uranium-thorium
fuel cycle95 - equivalent to the fuel cost for an oil-fired power
plant burning oil priced at $2.50 a barrel!
Recovery of 15 percent of the uranium in seawater could support
the year 2100 nuclear capacity level (6,500 gigawatts-electric) in the
high-growth scenario (discussed above) for 1,000 years using such once-through
reactor-fuel-cycle technologies. The key unresolved question is whether
production of uranium from seawater could be carried out at acceptable cost at
scales large enough to support a significant fraction of the world’s
nuclear capacity.
Large-scale, internationalised nuclear energy parks
If development of advanced proliferation- and
diversion-resistant nuclear energy systems proves to be an elusive goal and the
world opts for large-scale use of reprocessing and recycling technologies with
substantial proliferation and diversion vulnerabilities, it might become
necessary to cluster all the sensitive facilities - enrichment plants, reactors,
reprocessing plants, fuel fabrication plants - in large, heavily guarded nuclear
parks under international control to reduce the proliferation and diversion
risks of nuclear fission. Electricity produced in such parks could be made
available even to remote users through direct-current transmission lines. In
addition, with reactors operated at suitably high temperatures (for example,
high-temperature, gas-cooled reactors), hydrogen might also be produced as an
energy carrier for world-wide energy commerce - initially perhaps by
steam-reforming natural gas and ultimately with advanced thermal cycles that
would use nuclear heat to extract hydrogen from water (Marchetti, 1976; Miyamoto
and others, 1999; Scott and Hafele, 1990; Wade and Hill, 1999).
There is no doubt that this is technically feasible and would
reduce proliferation and diversion dangers substantially. Much more
questionable, however, is whether it is politically realistic to expect all the
world’s countries to place major components of their electricity supplies
under international control - and to agree on the administrative arrangements
for doing so.
Thermonuclear fusion
Another nuclear energy option for the very long term is
thermonuclear fusion, based on exploiting the energy recovered in fusing light
elements (for example, deuterium and tritium) rather than fissioning uranium or
plutonium. The resources upon which fusion would depend - lithium and deuterium
in seawater - are virtually inexhaustible.
How fusion compares with fission with regard to reactor safety,
radioactive waste management, and proliferation and diversion risks depends on
how the technology is developed. But relative to today’s LWRs, it offers
considerable promise, for three reasons (PCAST Fusion Review Panel, 1995).
First, with regard to safety, population exposures to radiation from worst-case
accidents are 100 times smaller than those from worst-case fission accidents.
Second, with respect to radioactive waste hazards, those from fusion (on the
basis of the most meaningful of indices combining volume, radiotoxicity, and
longevity) can be expected to be at least 100 times and perhaps 10,000 or more
times smaller than those from fission. Third, with regard to nuclear weaponry,
electricity supply systems based on fusion would be less likely than fission
systems to contribute to nuclear weapons capabilities acquisition by
sub-national groups and, if designed appropriately, could be easier to safeguard
against clandestine fissile material production by governments.
|
The essence of the potential
nuclear weapons link to
fission power is
that this technology provides the
possibility of
obtaining access
to nuclear explosive
materials. |
Despite these advantages, it is still unclear whether fusion
will eventually become a commercial energy technology. Even if technical goals
can be realised, fusion is not expected to become an option for commercial
energy applications before 2050 (PCAST Fusion Review Panel,
1995).
The outlook for addressing the challenges
Can the challenges related to nuclear power - cost, safety,
proliferation and diversion, and waste management - all be adequately addressed
with advanced technologies to make it widely acceptable? This question cannot be
fully answered at this time - in part because consensus has not been reached on
goals for technological innovation, and in part because the answer does not
depend only on technical considerations.
Clarification of goals is needed to facilitate the development
of a focussed nuclear energy innovation effort. The market, ideally with
external costs internalised, will determine the competitiveness of future
nuclear technologies, so that cost goals for the technology will have to be
adjusted over time to respond to the changing competition. Although this
uncertainty is common to all technologies, the intrinsic high investment cost
required to bring new nuclear technologies to market makes this a continuing
difficult challenge for nuclear power. Among externality concerns, consensus
might converge on a goal of demonstrable safety (Lidsky, 1991).
However, goals relating to proliferation and diversion
resistance and waste management require considerable clarification. There is a
strong technical case that LWRs operated on once-through fuel cycles are more
proliferation and diversion resistant than today’s reprocess-recycle
technologies, but beyond that there is little agreement in the technical
community as to the relative merits of alternative advanced concepts. For waste
management, goals need to be better defined, not only to include various
non-technical considerations but also to ensure that proliferation and diversion
resistance goals are not compromised.
There seem to be reasonably good prospects for making reactors
demonstrably safe while simultaneously also reducing cost - although this must
be demonstrated, through appropriate research, development, and dissemination.
This leaves proliferation and diversion and waste management - issues that also
involve cost considerations. How much more proliferation and diversion resistant
advanced nuclear technologies can be made relative to LWRs operated on
once-through fuel cycles is unclear - as is the potential for maintaining even
this degree of resistance in the future, when uranium might be much scarcer than
it is today. But at least for the immediately future, there are no economic
obstacles to making reactors at least as resistant to proliferation and
diversion as LWRs operated on once-through fuel cycles.
A promising option for sustaining the proliferation and
diversion resistance of reactors operated on once-through fuel cycles seems to
be extraction of uranium from seawater. Because the technology probably will not
be needed at least until sometime after 2050, there is no urgency to develop the
technology. However, a critical near-term need is assessment of the feasibility
of the concept at large scale to provide a more informed basis for prioritising
research and development on alternative nuclear technologies for the long term.
Waste management is probably a technically soluble problem, but
it is unclear whether promising technical fixes can be made broadly acceptable
to the public. S&T technologies for burning transuranics and long-lived
fission products will probably get considerable research and development support
as an option for addressing the waste disposal challenge - in large part because
many people have little confidence in human capabilities to adequately manage
waste risks for the long periods required (O’Neill, 1998) - even though
S&T technologies are probably not necessary to adequately protect the public
in the very long term. In a world where overall research and development
investment funds are limited, such investments could limit funds available for
other needed nuclear research and development activities.
In summary, for nuclear energy to qualify as a sustainable
energy option, concerns regarding safety, waste disposal, and proliferation and
diversion must be addressed in ways that enable nuclear energy to compete on an
economic basis. Effectively addressing these concerns to enable a large
expansion of nuclear power probably requires advanced technologies, as well as
improved institutional risk management strategies.
Although it is possible to envision sets of nuclear technologies
and management strategies that might fulfil the requirements for sustainability,
decisions on future nuclear power will be made largely at the political level
rather than on narrow technical and economic grounds. Gaining broad public
support for nuclear power is not simply a matter of better educating the public
on the issues, which is what many in the nuclear industry believe is needed
most. The industry should also seek to better understand public concerns.96
The industry must recognise that a stable political consensus on nuclear
goals and strategies is needed to bring about a nuclear-intensive energy future.
The industry should also consider opening up the nuclear decision-making process
to diverse interest groups, so that a well-informed public could ensure that its
concerns are addressed every step of the way (Bunn, 1999).
During the next 20 years there might be enough nuclear plant
orders (mainly in Asia) and business opportunities associated with maintaining
existing plants to keep the nuclear industry from collapsing. But taking into
account expected plant retirements, this period will probably be characterised
by little if any net nuclear power expansion world-wide. The industry might
consider this de facto moratorium on net expansion as a window of opportunity
for confidence-building, through which it could seek to convince the public and
investors that concerns about cost, safety, proliferation and diversion, and
waste disposal can be dealt with effectively.
|
Although coping with the
radioactive waste problem
seems
manageable from a technical
perspective, a technical
fix by
itself is not
a solution. |
The number one priority on the confidence-building agenda is to
reach a broad consensus on waste disposal policy. To get this consensus requires
that industry engage effectively all stakeholder groups, including those
ideologically opposed to nuclear power. Whether the needed deal-making is
feasible or not is unknowable at this time, but not implausible. For example, as
a strategy to deal with its strongest critics, industry leaders might consider
becoming vocal supporters of public-sector-supported renewable energy and energy
efficiency programmes in exchange for broad support for sensible nuclear waste
management strategies and policies - in effect, giving the renewable and energy
efficiency communities the opportunity (during the moratorium) to show whether
they can deliver on what they hope for.97
If the energy innovation effort in the near term emphasises
improved energy efficiency, renewables, and decarbonised fossil energy
strategies,98 the world community should know by 2020 or before much
better than now if nuclear power will be needed on a large scale to meet
sustainable energy goals. With broad support for a sensible waste management
strategy, the nuclear industry would be far better positioned to take off again
at that time than if it were to continue dealing with its critics in a more
confrontational manner.
In parallel with such confidence-building, the industry might
consider strategies to prioritise the nuclear energy innovation effort. The
first steps might include exploratory research and development (which is quite
inexpensive relative to building large-scale demonstration projects) aimed at
better clarifying the options.99 These steps could be followed by
efforts to reach consensus within the technical community regarding priorities,
so that the industry would be well prepared to move ahead if the world community
eventually decides that large-scale nuclear power is needed to meet sustainable
energy goals.
Notes
1. Major reviewers for this chapter were Harry Audus (United
Kingdom), Tim Brennand (United Kingdom), Ramon Espino (United States), Richard
Garwin (United States), Chris Hendriks (Netherlands), Olav Kaarstad (Norway),
Larry Lidsky (United States), Marvin Miller (United States), Larry Papay (United
States), Jefferson Tester (United States), and Maarten van der Burgt
(Netherlands).
2. Because methane is a powerful greenhouse gas (chapter 3),
getting climate change benefits from shifting to natural gas requires minimising
gas leakage from the entire gas system.
3. The Convention on Climate Change seeks to "achieve
stabilisation of the greenhouse gas concentration in the atmosphere at a level
that would prevent dangerous anthropogenic interference with the climate system.
Such a level should be achieved within a time frame sufficient to allow economic
systems to adapt naturally to climate change, to ensure that food production is
not threatened, and to enable economic development to proceed in a sustainable
manner" (UNFCC, 1992).
4. For example, the World Bank (World Bank, 1997) has estimated
that in 1995 air pollution damages in China cost $48 billion, or 7 percent of
GDP; see chapter 3.
5. In a study carried out under the auspices of the European
Commission’s ExternE Programme, Krewitt and others (1999) estimated that
for the European Union (EU-15) the total cost of environmental damages arising
from air pollutant emissions of fossil fuel power plants in 1990 was $70
billion, or more than $0.06 per kilowatt-hour of electricity generated; 97
percent of this cost is related to health - mostly fine-particle air pollution.
6. Uncontrolled emissions increase roughly in proportion to oil
plus coal consumption, which in turn grows roughly in proportion to GDP.
Assuming, as economists often do, that the willingness to pay to avoid health
damages from air pollution increases as (GDP/P), it follows that the cost of
health damages from uncontrolled emissions increases roughly as P·(GDP/P)2, where P = population.
7. The cost estimates presented in tables 8.1 and 8.2, like the
estimates in Krewitt and others (1999), were developed under the ExternE
Programme of the European Commission.
8. This gap exists for a variety of reasons - for example,
regulated emission levels are for well-maintained cars, and regulations tend to
be for driving cycles that often do not adequately reflect the way people
actually drive cars (Ross, Goodwin, and Watkins, 1995).
9. To illustrate the challenge of addressing air quality goals
as economies evolve, consider a simple model of a hypothetical average
developing country that grows from its 1990 state, in which per capita GDP
(GDP/P) = $2,300 (1990 dollars, purchasing power parity basis - the average for
all developing countries in 1990) and there are no air pollutant emission
controls in place, to a future state where per capita GDP is 7.2 times higher
(GDP/P = $16,400, the average for countries belonging to the Organisation for
Economic Co-operation and Development, or OECD, in 1990 - a level that could be
realised in 100 years with a sustained 2 percent per year GDP/P growth rate).
Suppose also that in this period per capita consumption of coal plus oil also
increases 7.3 times, from the actual average level in 1990 for developing
countries to the 1990 level for OECD countries, and that without controls
pollutant emissions increase in proportion to coal plus oil consumption levels.
Without pollution controls and taking into account an expected doubling of
population in this period, health damage costs would increase about 100 times (2
x 7.2 x 7.3; assuming, as most economists do, that the willingness to pay to
avoid pollution damages increases in proportion to per capita GDP). Thus
end-of-pipe controls that reduce emissions by 99 percent would be required to
keep damage costs in dollar terms to a level no greater than in 1990.
10. For example, the U.S. Department of Energy’s Vision 21
Program (Clean Energy Plants for the 21st Century) seeks - in addition to
achieving near-zero pollution emissions with advanced technology - reduced
CO2 emissions through both efficiency improvements and development of
the capability to reduce CO2 emissions to zero or near zero by means
of CO2 capture and sequestration. A complementary new DOE programme
is carbon sequestration - a research and development effort aimed at developing
carbon sequestration technologies to the point of deployment, so that these
sequestration technologies will be ready to be deployed (if and when needed).
11. Efficiencies have been rising continually in conjunction
with increasing turbine inlet temperatures, which have been rising at an average
rate of 13 degrees Celsius a year for the past 30 years (Chiesa and others,
1993), as a result of more heat-resistant materials being used for turbine
blades and improved turbine blade cooling technologies.
12. On a lower heating value (LHV) basis, the efficiencies of
the Frame 7F and Frame 7H are 56 and 60 percent, respectively.
13. Some regulations require controlling NOx
emissions to less than 10 parts per million, dry volume basis (at 15
percent O2) - relative to typical uncontrolled emissions for
natural-gas-fired systems of 125 parts per million.
14. In a typical gas turbine, two-thirds of the output of the
turbine is needed to drive the compressor.
15. Spray intercooling has been applied to an existing gas
turbine (without major modification) in a commercial product (McNeely, 1998).
But this unit involves only 1 - 3 percent of the maximum feasible water
injection rate.
16. The electricity generating potential through combined heat
and power in a particular industry is the heat load times the characteristic
output ratio of electricity to heat for the cogenerating technology.
17. These large syngas projects that involve electricity as a
product or coproduct are part of a recent global inventory of syngas projected
compiled by Simbeck and Johnson (1999) that involves 161 real and planned
commercial-scale projects with a combined syngas production capacity of 60,880
megawatts-thermal. Many of these are polygeneration projects that involve the
coproduction of various combinations of products - for example, electricity,
steam for process, chemicals, town gas; and many of the projects are in the
petroleum refining and chemical industries. About 44 percent of the productive
capacity is based on coal; much of the rest is based on the use of low-cost
petroleum refinery residues.
18. As an IGCC-based power industry grows, the benefit of
by-product sulphur sales per kilowatt-hour will eventually decline when the
sulphur supplies exceed demand, so that sulphur prices will fall.
19. For the cogeneration systems described in tables 8.7 and
8.8, condensing and extraction turbines rather than back-pressure turbines are
needed; otherwise the ratio of electricity to heat production would be less than
1 to 1. (In condensing and extraction systems, some of the steam is bled from
the turbine at the pressure appropriate for the process, and the rest of the
steam is used to produce more power and then condensed; for the steam that is
condensed, there is no cogeneration fuel-saving benefit.) The fraction of the
steam that must be condensed is much greater in the steam turbine case than in
the IGCC case, because of the much lower electricity-heat output ratios for
steam turbines relative to combined cycles (see figure 8.1).
20. At present, gases exiting the gasifier at temperatures of
1,000 degrees Celsius or more are cooled to about 100 degrees Celsius to
facilitate cleaning the gas of particulates and sulphur and nitrogen compounds.
Then the cleaned gas is heated up to the turbine inlet temperature of 1,300
degrees Celsius or more.
21. Most of the rest will be used for standby service.
22. Because the temperature of the turbine exhaust is higher
than that of the air exiting the compressor, the turbine exhaust heat is often
recovered to preheat the air exiting the compressor before it is delivered to
the combustor, so that moderate efficiencies are achievable despite the low
pressure ratio.
23. Less than 0.24 grams per kilowatt-hour (9 parts per million
by volume at 15 percent O2) for the 28-kilowatt-electric Capstone
Model 330 using a non-catalytic staged combustion system.
24. Ballard is a joint venture involving Ballard Power Systems,
General Public Utilities International, and GEC Alsthom. Plug Power is a joint
venture involving Mechanical Technologies, Inc., Detroit Edison, and General
Electric.
25. An operating temperature in the range 700 - 800 degrees
Celsius enables an efficiency increase of about 10 percent without compromising
fuel flexibility and the process advantages offered by SOFCs operated at 1,000
degrees Celsius. A reduced operating temperature also leads to greater choice of
electrode materials and reductions in system cost and complexity (Goldstein,
1992).
26. Oxygen would be needed for coal gasification, in any case.
27. Shell intends to use the technology in conjunction with its
own oil and gas operations - including use of the separated CO2 for
enhanced oil recovery (SIEP, 1998).
28. To be effective in sequestering CO2, aquifers
need not be leak free. Lindeberg (1997) modelled CO2 sequestration
for injection during a 25-year period into aquifers for which there is an open
boundary or fracture 8,000 metres from the injection well and showed that, if
such aquifers have high permeability, some of the injected CO2 would
eventually escape. Assuming all CO2 associated with future fossil
fuel consumption (7,000 GtC) as projected in the IPCC's IS92a scenario (IPCC,
1995) is injected into such aquifers, Lindeberg estimated for the worst
(leakiest) case that a fifth of the injected CO2 would eventually
leak out but would do so slowly over many centuries at climatically
inconsequential rates - with leakage peaking in 3100 at 2 GtC per year; in
contrast, if the same amount of CO2 were released to the atmosphere
during fossil fuel combustion, emissions would increase until they peak at 30
GtC a year in about 2150 and subsequently decline as fossil fuel resources are
depleted.
29. All cases include costs to pressurise CO2 to 135
bar plus a CO2 disposal cost of $18 per tonne of carbon (equivalent
to $5 per tonne of CO2).
30. The calculation presented is an updated calculation for this
decar-bonisation of fuel gas strategy originally advanced by Blok, Hendriks, and
Turkenburg (1989) and van der Burgt, Cantle, and Boutkan (1992); also see Chiesa
and Consonni (1998).
31. This is for disposal near the CO2 separation site
or for disposal with some credit for enhanced resource recovery. If the
separated CO2 had to be transported 500 kilometres to a remote
aquifer for disposal, with no credit for enhanced resource recovery, the avoided
cost would increase about another $10 per tonne of carbon (Williams, 1999b).
32. The system described in table 8.10 (based on Simbeck, 1999c)
involves an autothermal reformer that uses steam and O2 for reforming
natural gas. Audus, Kaarstad, and Singer (1999) describe a system that instead
uses steam and air for reforming, thereby avoiding the cost for air separation;
their estimate of the CO2 recovery cost penalty is less than
two-thirds of the estimate in table 8.10. Simbeck (1999c) also estimates costs
for autothermal reforming with steam and air but finds the cost to be higher
than for reforming with steam and O2, because savings from avoiding
the cost of an air separation unit are more than offset by higher costs for
downstream components that arise because the fuel gas is diluted with nitrogen
from air.
33. For the advanced technology (2012) cases considered by
Herzog (1999a), the lower heating value (LHV) efficiencies with CO2
recovery and disposal are 55.6 percent for the NGCC case and 42.4 percent
for the coal IGCC case, compared to 50.8 percent and 37.2 percent for the
corresponding cases presented in table 8.10. The corresponding busbar costs in
the Herzog analysis with 2020 U.S. fuel prices are $0.045 per kilowatt-hour for
the NGCC case and $0.044 per kilowatt-hour for the coal IGCC case. (To put the
Herzog analysis on the same basis as the present analysis, Herzog’s annual
capital charge rate was changed from 15 to 11.5 percent, the capacity factor was
increased from 75 to 80 percent, and a CO2 transport-and-disposal
cost - not taken into account by Herzog - of $5 per tonne of CO2 was
included.)
34. A litre of water contaminated with MeOH would contain a
fatal dose if it were 2 - 7 percent MeOH by weight.
35. The cetane number is a measure of a fuel's ability to
auto-ignite. A high cetane number is desirable for candidate fuels for
compression-ignition engines because it shortens ignition delay, lowering
premixed burning and resultant NOx emissions and noise. High octane
fuels have low cetane numbers, and fuels with high cetane numbers have low
octane ratings.
36. This plant commenced operations in 1993 but was shut down in
late 1997 by an explosion at the air separation plant (from the build-up of
small particles taken in from the air - apparently as a result of the prolonged
haze that had blanketed the entire South Asian region in late 1997). The plant
is scheduled to reopen in 2000, after repairs are completed.
37. These increased emissions of especially small particles
appear to arise as a result of controlling soot particle emissions - which
dominate the mass of particulate emissions - using current technology. Removing
soot particles thereby removes nucleating agents on which these tiny particles
would otherwise condense or adsorb; these very small particles seem to come from
ash in the lubricating oil (Abdul-Khalek and others, 1998).
38. The calculations presented in tables 8.11 and 8.12 are based
on well-established cost estimates and cost-scaling exponents for each of the
many components of these systems. However, it is assumed in these calculations
that each component (for example, the coal gasifier) can be built in a single
train to the required capacity. The maximum sizes of single-train components
that are commercially available today are less than the capacities associated
with many of the components for the polygeneration systems presented in these
tables. To the extent that multiple trains instead of single trains would have
to be used for practical systems, the cost savings would be less than indicated
in tables 8.11 and 8.12. But these tables illustrate the value of evolving
towards systems based on large single-train systems and thus represent good
targets for development.
39. Air Products and Eastman Chemicals tested liquid-phase MeOH
production technology in a process development unit at LaPorte, Texas, which was
designed to produce 6,900 litres per day and which operated for 7,400 hours.
Following this, a commercial-scale plant (designed to produce 288,000 litres per
day) went into operation in January 1997, at Kingport, Tennessee, under the U.S.
Department of Energy’s Clean Coal Technology Program, to demonstrate the
technology during a period of 4 years of expected plant operation.
40. In China more than 20 Texaco gasifiers are operating, under
construction, or on order for the production of chemical fertiliser, MeOH, town
gas, or oxochemicals. In addition, 6 Shell gasifiers and at least 1 Lurgi
gasifier are being used to produce ammonia (NH3) from coal.
41. Water or steam injection would probably not be pursued for
gas turbine and steam turbine combined cycles because these options would reduce
efficiency. However, the technique would be appropriate for low-capital-cost
systems that use steam or water injection for efficiency augmentation - such as
intercooled steam-injected gas turbines (Williams and Larson, 1989) or, for
water injection, Tophat® cycles (van Liere, 1998).
42. Consider H2 manufacture from coal - a process
that begins with O2-blown coal gasification, which is also
the first step in processing coal for IGCC plants. Just as pollutant emissions
from coal IGCC plants are almost as low as from NGCC plants (see table 8.1),
pollutant emissions from H2 production plants are expected to be very
low. Pollutant emissions per unit of coal consumed would tend to be lower than
for IGCC plants, because gases exiting the gasifier must be cleaned to a higher
degree to protect catalysts in downstream processing equipment from damage by
contaminants such as sulphur. Catalyst protection requirements are often more
stringent than regulatory requirements for air pollutant emissions.
43. For example, it is estimated that at a future (optimistic
but plausible) photovoltaic electricity price of $0.027 per kilowatt-hour, the
cost of photovoltaic-derived H2 would be $17 per gigajoule (IPCC,
1996a). For comparison, the cost of making H2 from natural gas and
coal today, including the cost of storing the separated CO2
underground, is $6 per gigajoule for natural gas and $11 per gigajoule for
coal (Kaarstad and Audus, 1997). With advanced fossil-energy conversion
technologies that are likely to be available by the time a photovoltaic
electricity price of $0.027 per kilowatt-hour is reached, fossil-energy-derived
H2 costs with CO2 sequestration would be less (Williams,
1999b). (Even credit for the by-product O2 generated in electrolytic
processes would not help much; such a credit would amount to only about $0.60
per gigajoule of electrolytic H2 ($20 per tonne of O2)
assuming an installed cost of $21.60 per tonne of O2 per day for an
air liquefaction plant).
44. An H2 fuel cell car would typically be three
times more fuel-efficient than a conventional gasoline internal combustion
engine car of comparable performance. This efficiency gain arises because, while
the efficiency of an internal combustion engine declines with decreasing load
(so that the efficiency of driving a car, averaged over all driving conditions,
is a modest 15 percent), the efficiency of a fuel cell increases as the load
decreases (so that the efficiency at average part-load conditions is a high 50
percent).
45. Some indicators of the level of industrial effort to develop
fuel cell vehicles: by the end of 1999 the four largest Japanese manufacturers
had spent $546 million on fuel cell development. Honda has announced plans to
spend up to $500 million on fuel cell research and development during the next
five years. DaimlerChrysler has spent $300 million on fuel cells and expects
that it will have spent $1.4 billion by 2004, when it starts producing engines
for fuel cell vehicles.
46. For F-T liquids production, syngas with an H2 to
CO ratio of 2 is needed. Because steam reforming instead gives a ratio of 3
(CH4 + H2O ® CO +
3H2), syngas is typically made through partial oxidation (CH4
+ 1/2 O2 ® CO +
2H2), which gives the right ratio but requires an expensive air
separation plant. When some CH4 is instead used to produce
H2, the CO2 by-product can be used for doing some CO2
reforming (CH4 + CO2 ® 2CO + 2H2), along with steam reforming, to
get the right overall ratio, thereby avoiding the need for an air separation
plant.
47. The process of making H2 from syngas (mainly CO
and H2) involves reacting the CO with steam (in water-gas shift
reactors) to produce H2 and CO2. With current technology,
this is followed by the use of capital-and energy-intensive equipment to
separate the H2 and CO2.
48. As indicated in chapter 5, global methane clathrate hydrate
occurrences have an energy content of 780,000 exajoules (table 5.7) and a carbon
content of 12,000 GtC (table 5.8). If half of this resource could ultimately be
recovered and burned along with 5,000 GtC of fossil energy reserves and
resources (table 5.8), and if half the released CO2 stayed in the
atmosphere, the atmospheric CO2 level would be eight times higher
than at present.
49. The announced efficiency is on an LHV basis, and the design
is for once-through processes using cold seawater under wintertime conditions
for northern Europe and does not include energy penalties for pollution control.
Correcting to the norm of 40 millibar (29 degrees Celsius) of the International
Standards Organization for once-through cooling with steam condensation,
accounting for fuel consumption requirements for air pollution control equipment
that would lead to low levels of SO2 and NOx emissions,
and converting to a higher heating value basis (the norm for this report), the
efficiency would be about 43 percent (see entry in the first row of table 8.9).
50. Because cogeneration systems involving condensing heat
transfer are less costly than those requiring steam cooling, reheat steam cycles
(which deliver superheated steam) are typically not attractive (Kovacik, 1996).
51. The air separation plant contributes $150 per
kilowatt-electric to the capital cost of an IGCC plant and requires 12 percent
of gross power output for operations (Simbeck, 1999a).
52. Advanced clean-up technologies being pursued operate at 500
- 600 degrees Celsius, well below the temperatures of gases exiting the
gasifiers - so that the process is described as warm rather than hot.
53. The U.S. Department of Energy - supported demonstration
project aimed at proving warm gas clean-up for IGCCs with air-blown gasification
(a 100-megawatt-electric Pinon Pine IGCC Power Project in Nevada that was put
into service in early 1997) had sustained operating runs of less than 13 hours
as of June 1999 (Motter, 1999).
54. But air-blown gasifiers are well-suited for biomass IGCCs
(Simbeck and Karp, 1995; Williams and Larson, 1993); low sulphur and nitrogen
contents of typical feedstocks make biomass a good candidate for warm-gas
cleanup. In addition, scale economies make air separation costly at the
relatively small scales of most biomass power applications.
55. Heating up the extra mass of N2 in combustion
leads to lower peak flame temperatures for air-blown units.
56. In fluidised-bed combustion, fuel is burned in a bed of fuel
and other materials that behaves like a fluid, as a result of a gas passing
upwards through the bed fast enough to support fuel and other particles but not
so fast as to transport particles out of the bed. Typically 2 - 3 percent of the
weight of the bed material is coal.
57. Second-generation technology, which is entering the pilot
and demonstration phases, will employ a coal pyrolyser to produce, from some of
the coal input, fuel gas that is burned in a gas turbine combustor so as to
increase the turbine inlet temperature of the gases delivered to the gas
turbine.
58. Still another source of greenhouse gas emissions arises
because all carbon in the limestone added to an AFBC unit for sulphur removal
(limestone is typically added at two or more times the rate theoretically
required for sulphur removal) is released as CO2 at levels that could
be significant for high-sulphur coals. The problem is less for PFBC units, which
can be designed to suppress CO2 emissions from the quantities of
limestone present in the bed at levels in excess of the theoretical amounts
needed for sulphur removal. In both cases these extra CO2 emissions
are not significant in practice because the use of high-sulphur coals is not
practical for fluidised-bed combustion units.
59. The need for H2 arises from the H-C ratio of 2
for today’s hydrocarbon fuels, relative to 0.8 for coal.
60. In 1996, more than 75 percent in France and Lithuania, and
more than 50 percent in Belgium and Sweden.
61. The reference scenario of the Energy Information
Administration (EIA) of the U.S. Department of Energy is that nuclear capacity
will be 311 gigawatts-electric in 2020; the low-growth and high-growth EIA
scenarios for 2020 project 179 and 442 gigawatts-electric of nuclear capacity,
respectively (EIA, 1999a). The most recent forecast of the International Atomic
Energy Agency (IAEA) is that nuclear capacity in 2020 will be 305 - 582
gigawatts-electric, with its share in total power generation falling by then to
10 - 14 percent (IAEA, 1999).
62. There is a considerable range in nuclear forecasts for
individual countries. For Japan in 2010, the EIA (1999) projects 39.6 - 54.8
gigawatts-electric, with a reference value of 47.5 gigawatts-electric - relative
to 43.9 in 1997. In contrast, the official (Ministry of Trade and Industry)
projection for Japan in 2010 is 70 gigawatts-electric (Matsuoka and Hiranuma,
1998); others project 55 - 60 gigawatts-electric or less (Hard, 1997; Hagen,
1998). For China in 2010, the EIA (1999a) projects 8.7 - 11.5
gigawatts-electric, with a reference value of 11.5 gigawatts-electric - up from
2.2 in 1997. The Chinese National Nuclear Corporation has projected a total
installed capacity of 20 gigawatts-electric by 2010; however, this might not be
achieved, as a result of both overall excess electric generating capacity and
the high costs of nuclear expansion.
63. The Rabl and Spadaro damage cost estimates include
consideration of severe reactor accidents, for which they assumed a reactor core
melt probability of 10-5 per year with a release of 1 percent of the
radioactivity in the core in an accident - corresponding to the reference
accident scenario used by French national safety authorities. According to the
authors, the calculations assume "a mature and stable political system, with
strict verification of compliance with all regulations."
64. This scenario involves net new nuclear generating capacity
being added at an average rate of 62 gigawatts-electric per year during the next
100 years, and, if nuclear plants last 40 years, a corresponding average rate of
nuclear plant construction (including replacement capacity) of 115
gigawatts-electric per year. For comparison, the nuclear capacity in the most
nuclear-intensive IIASA-WEC scenario (A3) is 6,000 gigawatts-electric in 2100
(chapter 9).
65. Assuming 50 percent efficient coal plants and 60 percent
efficient natural gas plants.
66. Cumulative CO2 emissions for the IPCC’s
IS92a scenario are 1,500 GtC, 1990 - 2100; or 1,420 GtC, 2000 - 2100 (IPCC,
1995).
67. This gloom-hope perspective on the prospects for nuclear
power is widely shared by governments. In the text agreed to by government
delegations at the final plenary session for Working Group II of the IPCC’s
second assessment report, it is stated that "nuclear energy could replace
baseload fossil fuel electricity generation in many parts of the world if
generally acceptable responses can be found to concerns such as reactor safety,
radioactive waste transport and disposal, and nuclear proliferation" (IPCC,
1996b). Similarly, the Energy Research and Development Panel of U.S. President
Clinton’s Committee of Advisors on Science and Technology concluded:
"Several problems cloud fission’s potential as an acceptable power source
today and into the future: disposal of radioactive waste; concern about nuclear
weapons proliferation; concern about safe operation of plants; and
noncompetitive economics...Given the projected growth in global energy
demand...and the need to stabilize and then reduce GHG emissions, it is
important to establish fission energy as an acceptable and viable option, if at
all possible...Therefore, R&D is needed to solve the problems" (PCAST Energy
Research and Development Panel, 1997).
68. Assuming a 10 percent discount rate, the value assumed in
assessing all technologies in chapter 8. For a 5 percent discount rate, this
report projected costs of $1,400 - 2,800 per kilowatt-electric (Paffenbarger and
Bertel, 1998).
69. The high cost and complexity of the LWR are related in part
to its high power density - ironically the reason it was originally chosen for
submarine use!
70. For example, the former chairman of the Atomic Energy Board
of India was warned that the safety status of nuclear energy installations in
India is far below international standards, and that in the absence of an
independent regulatory body this has serious implications for public safety
(Gopalakrishnan, 1999).
71. Nuclear-explosive materials are those that can sustain a
fission chain reaction based on fast neutrons, which is the requirement for
making a nuclear bomb. The two principal nuclear-explosive materials are
mixtures of uranium isotopes that contain more than 20 percent of the fissile
isotopes U-233 and U-235; and all mixtures of plutonium isotopes, except those
containing a high proportion of Pu-238 (see CISAC, 1995).
72. The importance of complementing institutional measures with
technological strategies was underscored recently by Evgeniy Adamov, the Russian
minister of atomic energy, who has expressed the view that the risk of diversion
of nuclear material is one of the key problems of the nonproliferation regime,
and therefore, "no matter how efficient the inspection and safety regime in
different countries may be, it is necessary to pass on to a different kind of
technological cycle in nuclear energy that has built into it a mechanism to
prevent the development of weapons-grade materials" (press conference
transcript, 25 November 1998).
73. On the institutional side, continuing efforts are under way
to strengthen the international safeguard system, export controls over key
technologies, and security systems designed to prevent the theft of
weapons-usable nuclear materials. Much more remains to be done in each of these
areas, however - particularly because the collapse of the Soviet Union has
greatly weakened controls over technologies, information, and materials in the
former Soviet states. In the case of the international safeguards regime, the
IAEA is critically in need of more resources, having been on a
near-zero-real-growth budget even while taking on substantial new
responsibilities, and the IAEA also requires strong political support to
effectively implement the new safeguard measures agreed to in recent years.
R&D is also needed to improve safeguard technologies, including those
designed to detect clandestine nuclear activities from kilometres away and those
to account more accurately for plutonium in spent fuel and in bulk processing
(as occurs during reprocessing and plutonium fuel fabrication), as well as
highly enriched uranium in bulkpro-cessing. For a detailed discussion of
institutional strategies for reducing proliferation risks associated with
nuclear power, see Walker (1999).
74. In addition, India has a small pilot reprocessing plant at
Tarapur and has recently put into operation a second reprocessing plant at
Kalpakkam. And Japan has a small reprocessing plant at Tokai Mura (currently
shut down). Under the Carter administration, the United States abandoned plans
for fuel reprocessing and plutonium recycling as a result of both nuclear
proliferation concerns and poor prospective economics. Since 1990 the Russian
reprocessing plant has been running at a modest fraction of its rated capacity;
some of its non-Russian clients have shifted from a spent fuel reprocessing
strategy to a direct spent fuel disposal strategy, and Russian reactor operators
are failing to pay their bills (Berkhout, 1998).
75. For the Russian Federation’s reprocessing plants, the
situation is somewhat more complex. There does not appear to be a requirement
for plutonium return. Older contracts do not appear to require return of
high-level wastes; high-level waste return appears to be required by at least
some interpretations of Russian law, but the law is being ignored.
76. At today’s low uranium market price of $25 per kilogram
(equivalent to an oil price of less than $0.30 per barrel), the purchase of
uranium contributes to the cost of nuclear electricity less than $0.0005 per
kilowatt-hour. A 1994 study estimated that the levelised fuel cost for the
once-through LWR fuel cycle is 14 percent less than for the reprocessing cycle
(NEA, 1994). A more recent analysis found reprocessing and plutonium recycling
to be much less attractive economically and estimated that uranium prices would
have to increase by six times before reprocessing and recycling would be
economic (Fetter, Bunn, and Holdren, 1999).
77. A variety of other possibilities have been considered over
the years and might still be pursued someday as alternatives to repositories,
including disposal in the seabed, in miles-deep drilled boreholes, in space, and
the like.
78. This cost assessment is consistent with a Framatome
assessment that a particle-accelerator-based system that would transmute minor
transuranics and long-lived fission products would not be competitive in
electricity generation with LWRs (Val�e, 1999).
79. For example, it has been recently discovered that water
moves through the mountain much faster than had been thought, and thermal
inclusions have been identified that may (or may not) suggest upwellings of
water in the not very distant past.
80. During a period of 500,000 to 1 million years, the most
exposed community 30 kilometres from Yucca Mountain (if that site becomes a U.S.
nuclear waste repository) may have exposure from groundwater that is comparable
to background radiation. However, only a tiny fraction of the population would
be so exposed.
81. For example, recent measurements challenge the widely held
technical view that the greatest long-term waste disposal hazards arise not from
transuranics but from long-lived fission products. The relative lack of concern
about transuranics arises from the belief that even if storage canisters
eventually lose their integrity, the transuranics will not dissolve readily in
reservoir groundwater because they are quite insoluble relative to long-lived
fission products under both oxidising and reducing conditions. Thus, except
where there would be human intrusion into the repository, the main doses to
humans after long periods would be from the long-lived fission products Tc-99
and I-129, which are soluble and thus can move through groundwater pathways
(STATS Committee, 1996). But recently, trace plutonium contamination was
discovered in sub-surface waters in Nevada that can be unambiguously identified
as having come from a nuclear weapons test 30 years earlier at the Nevada test
site 1.3 kilometres from the point where the plutonium contamination was found.
This measurement (Kersting, 1999) and related tracer experiments (McCarthy,
Sanford, and Stafford, 1998) suggest that sub-micron-scale colloidal particles
are the carriers of plutonium through groundwater. In addition, it has recently
been shown that water, even at ambient temperatures, can further oxidise
PuO2 into forms for which more than 25 percent of the Pu ions exist
in states that are far more soluble (Haschke, Allen, and Morales, 2000).
Although these findings do not prove that such mechanisms will provide
significant exposure pathways from nuclear weapons test sites or radioactive
waste disposal sites, they do show that concerns about long-term waste disposal
are made up of technical as well as political elements (Honeyman, 1999; Madic,
2000).
82. Vendors of heavy water reactors are also developing
evolutionary advanced designs, with features similar to those being incorporated
into evolutionary advanced light water reactor designs.
83. U-233, like U-233 and Pu-239, is a fissile material from
which nuclear weapons can be readily made.
84. Relatively pure U-233 might be obtained by extracting
chemically from spent fuel the Pa-233 precursor of U-233 before the Pa-233 (with
a 27-day half-life) has a chance to decay (Glaser, 1998). Glaser (1998) also
points out that if a would-be had access to relatively modest-scale uranium
enrichment capacity, weapons-grade uranium could be produced from both the U-233
and the U-235 in the denatured fuel, because most of the separative work
required to produce weapons-grade uranium from natural uranium has already been
carried out.
85. The type of HTGR involving fixed graphite blocks has been
the focus of considerable effort in several countries (including construction
and operation of prototype reactors with varying degrees of success); an
international consortium including France, Japan, the Russian Federation, and
the United States is developing a next-generation modular design of such a
system, with the idea of possibly constructing a prototype in the Russian
federation. The pebble bed variant of the HTGR has been the focus of development
in several countries (including construction and operation of an early prototype
in Germany some years ago), and a pebble bed modular reactor is now the focus of
an embryonic international effort led by Eskom, the electric utility of South
Africa, with particiaption from German experts and MIT, among others.
86. Less than 4.5 megawatts per cubic metre, relative to 100
megawatts per cubic metre for an LWR.
87. The nuclear LWR-FBR nuclear vision was epitomised by the US
Atomic Energy Commissions’ 1973 projection that by 2000 the United States
would get half its electric power from 400 FPRs and 600 LWRs.
88. The United States abandoned the 300-megawatt-electric Clinch
River Breeder Reactor demonstration project in 1983, after spending $7 billion,
and cancelled the follow-on Integral Fast Reactorin 1994. The United Kingdom
completed an FBR prototype in 1974 but shut it down in 1994, after abandoning
plans for construction of a follow-up full-scale demonstration project. France
completed the 300-megawatt-electric Phenix prototype FBR in 1973 and $5 billion
full-sized, 1,200-megawatt-electirc Super Phenix in 1985. Although the Phenix
has been relatively trouble free, the Super Phenix has been shut down for long
periods as a result of sodium leaks and related safety issues, and the French
government recently announced that the Super Phenix will be dismantled. Germany
completed an FBR progamme; a sodium coolant accident at the Monju prototype FBR
in 1995 has put the Japanese FBR programme largely on hold, although some
variant of the plutonium FBR remains a major objective of Japanese nuclear
energy policy (Hori and others, 1999). The Russian Federation operates the
world’s only remaining commercial-scale breeder (the BN-600 at Beloyarsk)
and has the world’s only remaining plans for near-term construction of
additional commercial breeders (the BN-800), but construction of these has been
stopped for many years for lack of funds. The BN-350 breeder reactor in
Kazakhstan was recently closed, with no plans for replacement.
89. Consider implications for plutonium management if the world
nuclear industry evolves according to the high-nuclear-growth scenario given
above, with 6,500 gigawatts-electric of installed nuclear capacity in 2100.
Suppose also that, by that time, uranium resource constraints will have led to a
decision to introduce conventional plutonium recycling. Each
one-gigawatt-electric power plant under such circumstances would discharge in
its spent fuel 103 kilograms of plutonium each year that would be
recovered via reprocessing and used in fresh fuel. The amount of plutonium
circulating in global commerce would be 6.5 million kilograms per year. The
amount of plutonium needed to make a nuclear weapon is less than 10 kilograms.
Because of the daunting institutional challenges associated with preventing
significant quantities of this plutonium from being diverted to weapons
purposes, it would be desirable to have available more proliferation-and
diversion-resistant nuclear technologies that would not be so difficult to
manage institutionally.
90. Two ground-based reactor test facilities were constructed,
and eight nuclear submarines powered with lead-bismuth-cooled reactors were
built (Crodnikov and others, 1999).
91. In constrast to conventional plutonium breeders, for which
plutonium production targets are greater than plutonium consumption rates.
92. The reactor for the proposed system would be compact (with a
core volume of 6.8 cubic metres). The reactor core would be sealed so that
individual fuel assemblies could not be removed. The entire sealed core could be
delivered as a unit to the power plant site and returned to the factory at the
end of its useful life.
93. High security would have to be provided to deter theft of
sealed reactor cores during transport to (as well as from) deployment sites.
94. It would take 10 - 15 years to develop and build an
experimental reactor and 20 years before a demonstration unit could be put into
operation (Orlov and others, 1999). Thus, even with a dedicated effort,
deployment could not take place for decades.
95. Assuming a 1970s-vintage version of this technology, for
which the uranium fuelling requirements (with a tails assay of 0.1 percent U-235
at the uranium enrichment plant) are estimated to be 13.5 times 10-6
kilograms per kilowatt-hour, which is 64 percent of the uranium fuelling
required for an LWR (Feiveson, von Hippel, and Williams, 1979).
96. To this end, Bunn (1999) sees the need for independent
research by social and political scientists on the roots of public attitudes on
nuclear technology.
97. Such a strategy was suggested by Lidsky and Cohn (1993).
98. In contrast to the situation for the renewables and energy
efficiency communities, those seeking expanded roles for fossil fuels in a
greenhouse-gas-constrained world probably do not need political support from the
nuclear industry to get a fair chance to prove whether or not decarbonised
fossil energy strategies are viable.
99. This strategy was also suggested by Lidsky and Cohn (1993).
References
Abdul-Khalek, I.S., D.B. Kittelson, B.R. Graskow, and Q. Wei.
1998. "Diesel Exhaust Particle Size: Issues and Trends." SAE Technical Paper
980525. Prepared for Society of Automotive Engineers International Congress and
Exposition, 23 - 26 February, Detroit, Mich.
Albright, D., F. Berkhout, and W. Walker. 1997. Plutonium,
Highly Enriched Uranium 1996: World Inventories, Capabilities, and Policies.
Oxford: Oxford University Press for Stockholm International Peace Research
Institute.
Appleby, A.J. 1999. "The Electrochemical Engine for Vehicles."
Scientific American 280 (7): 74 - 79.
API (American Petroleum Institute). 1999. Fuel Choices for
Fuel Cell Powered Vehicles. Washington, D.C.
Audus, H., O. Kaarstad, and G. Skinner. 1999. "CO2
Capture by Pre-Combustion Decarbonization of Natural Gas." In B. Eliasson,
P. Riemer, and A. Wokaun, eds., Greenhouse Gas Control Technologies:
Proceedings of the 4th International Conference on GHG Control Technologies.
Amsterdam: Pergamon.
Bachu, S., and W.D. Gunter. 1999. "Storage Capacity of
CO2 in Geological Media in Sedimentary Basins with Application to the
Alberta Basin." In B. Eliasson, P. Riemer, and A. Wokaun, eds., Greenhouse
Gas Control Technologies: Proceedings of the 4th International Conference on GHG
Control Technologies. Amsterdam: Pergamon.
Bachu, S., W.D. Gunter, and E.H. Perkins. 1994. "Aquifer
Disposal of CO2: Hydrodynamic and Mineral Trapping." Energy
Conversion and Management 35: 269 - 79.
Badin, J.S., M.R. DeLallo, M.G. Klett, M.D. Rutkowski, and J.R.
Temchin. 1999. "Decarbonized Fuel Production Facility: A Technical Strategy for
Coal in the Next Century." Paper presented at Gasification Technologies
Conference, 17 - 20 October, San Francisco, Calif.
Bagley, S.T., K.J. Baumgard, L.D. Gratz, J.H. Johnson, and D.G.
Leddy. 1996. "Characterization of Fuel and Aftertreatment Device Effects on
Diesel Emissions." Research Report 76. Health Effects Institute, Cambridge,
Mass.
Bakker, W. 1996. "Advances in Solid-Oxide Fuel Cells." EPRI
Journal 21 (5): 42 - 45.
Bannister, R.L., D.J. Huber, R.A. Newby, and J.A. Pattenbarger.
1996. "Hydrogen-Fueled Combustion Turbine Cycles." ASME Paper 96-GT-247.
Presented at the International Gas Turbine and Aeroengine Congress and
Exhibition, 10 - 13 June, Birmingham, U.K.
Bannister, R.L., R.A. Newby, and W.-C. Yang. 1997. "Development
of a Hydrogen-Fueled Combustion Turbine Cycle for Power Generation." ASME Paper
97-GT-14. Presented at the International Gas Turbine and Aeroengine Congress and
Exhibition, 2 - 5 June, Orlando, Fla.
Bannister, R.L., R.A. Newby, and W.-C. Yang. 1998. "Final Report
on the Development of a Hydrogen-Fueled Combustion Turbine Cycle for Power
Generation." ASME Paper 98-GT-21. Presented at International Gas Turbine and
Aeroengine Congress and Exhibition, 2 - 5 June, Stockholm.
Barletta, M., and A. Sands, eds. 1999. Nonproliferation
Regimes at Risk. Monterey, Calif.: Monterey Institute for International
Studies, Center for Nonproliferation Studies.
Berkhout, F. 1998. "The International Civilian Reprocessing
Business." University of Sussex, Science Policy Research Unit, Brighton, UK.
Berkhout, F., A. Diakov, H. Feiveson, H. Hunt, E. Lyman, M.
Miller, and F. von Hippel. 1993. "Disposition of Separated Plutonium."
Science and Global Security 3: 161 - 213.
Blok, K., C. Hendriks, and W. Turkenburg. 1989. "The Role of
Carbon Dioxide Removal in the Reduction of the Greenhouse Effect." Paper
presented at the International Energy Agency - Organisation for Economic
Co-operation and Development Expert Seminar on Energy Technologies for Reducing
Emissions of Greenhouse Gases, 12 - 14 April, Paris.
Blok, K., R.H. Williams, R.E. Katofsky, and C.A. Hendriks. 1997.
"Hydrogen Production from Natural Gas, Sequestration of Recovered CO2
in Depleted Gas Wells and Enhanced Natural Gas Recovery." Energy 22
(2 - 3): 161 - 68.
Blunt, M., F.J. Fayers, and F.M. Orr Jr. 1993. "Carbon Dioxide
in Enhanced Oil Recovery." Energy Conversion and Management 34 (9 - 11):
1197 - 1204.
Brewer, P.G., G. Friederich, E.T. Peltzer, and F.M. Orr Jr.
1999. "Direct Experiments on the Ocean Disposal of Fossil Fuel CO2."
Science 284: 943 - 45.
Bunn, M. 1999. "Enabling a Significant Future for Nuclear Power:
Avoiding Catastrophes, Developing New Technologies, and Democratizing Decisions
- and Staying away from Separated Plutonium." Paper presented at Global
’99: Nuclear Technology - Bridging the Millennia, International Conference
on Future Nuclear Systems, 29 August - 3 September, Jackson Hole, Wyo.
Byrer, C.W., and H.D. Guthrie. 1999. "Coal Deposits: Potential
Geological Sink for Sequestering Carbon Dioxide Emissions from Power Plants." In
B. Eliasson, P. Riemer, and A. Wokaun, eds., Greenhouse Gas Control
Technologies: Proceedings of the 4th International Conference on GHG Control
Technologies. Amsterdam: Pergamon.
Calvert, J.G., J.B. Heywood, R.F. Sawyer, and J.H. Seinfeld.
1993. "Achieving Acceptable Air Quality: Some Reflections on Controlling Vehicle
Emissions." Science 261: 37 - 45.
Campanari, S. 1999. "Full Load and Part-Load Performance
Prediction for Integrated SOFC and Microturbine Systems." Paper presented at
International Gas Turbine and Aeroengine Congress and Exhibition, 7 - 10 June,
Indianapolis, Ind.
Chambers, A., C. Park, R.T.K. Baker, and N.M. Rodriguez. 1998.
"Hydrogen Storage in Graphite Nanofibers." Journal of Physical Chemistry
B 102: 4253 - 56.
Chen, P., X. Wu, J. Lin, and K.L. Tan. 1999. "High H2
Uptake by Alkali-Doped Carbon Nanotubes under Ambient Pressure and
Mode-rate Temperatures." Science 285: 91 - 93.
Chen, T.-P., J.D. Wright, and K. Krist. 1997. "SOFC System
Analysis." Paper presented at the Fuel Cells Review Meeting, 26 - 28 August,
Morgantown, W.Va.
Chen, Z.H., and Y.Q. Niu. 1995. Mei Hua Gong 2: 31.
Chiesa, P., and S. Consonni. 1998. "Shift Reactors and Physical
Absorption for Low CO2 Emission IGCCs." Paper presented at ASME Turbo
Expo 98, June, Stockholm, Sweden.
Chiesa, P., S. Consonni, G. Lozza, and E. Macchi. 1993.
"Predicting the Ultimate Performance of Advanced Power Cycles Based on Very High
Temperature Gas Turbine Engines." ASME Paper 93-GT-223. Presented at the
International Gas Turbine and Aeroengine Congress and Exposition, 24 - 27 May,
Cincinnati, Ohio.
Choi, G.N., S.J. Kramer, S.S. Tam, J.M. Fox, N.L. Carr, and G.R.
Wilson. 1997. "Design/Economics of a Once-Through Fischer-Tropsch plant with
Power Co-Production." Paper presented at the Coal Liquefaction and Solid Fuels
Contractors Review Conference, 3 - 4 September, Pittsburgh, Penn.
CISAC (Committee on International Security and Arms Control of
the National Academy of Sciences). 1994. Management and Disposition of Excess
Weapons Plutonium. Washington, D.C.: National Academy of Sciences.
CISAC (Committee on International Security and Arms Control of
the National Academy of Sciences). 1995. Management and Disposition of Excess
Weapons Plutonium: Reactor-Related Options. Washington, D.C.: National
Academy of Sciences.
Collett, T., and V. Kuuskraa. 1998. "Hydrates Contain Vast Store
of World Gas Resources." Oil and Gas Journal, 11 May.
Corzine, R. 1997. "Gas into Liquid Gold." Financial Times,
4 July, p. 17.
Craig, P. 1997. "The Capstone Turbogenerator as an Alternative
Power Source." ASME Paper 97092. American Society of Automotive Engineers,
Warrendale, Pa.
CTOFM (Committee on Tropospheric Ozone Formation and
Measurement, National Research Council). 1991. Rethinking the Ozone Problem
in Local and Regional Air Pollution. Washington, D.C.: National Academy of
Sciences.
Dahl, Anders. 1993. "Operation Experience of the PFBC Plant in
V�rtan, Stockholm." In Lynn Rubow, ed., Proceedings of the 1993 International
Conference on Fluidized Bed Combustion, vol. 2. New York: American Society
of Mechanical Engineers.
Decker, Manfred. 1999. Personal communication. European
Commission, 9 September.
de Soete, G. 1993. "Nitrous Oxide Emissions from Combustion and
Industry; Chemistry, Emissions, and Control [in French]." Revue de
L’Institut Fran�ais du Petrole 48 (4).
DOE (U.S. Department of Energy). 1997. "Nonproliferation and
Arms Control Assessment of Weapons-Usable Fissile Material Storage and Excess
Plutonium Disposition Alternatives." Report DOE/NN-007. Washington, D.C.
DOE (U.S. Department of Energy). 1998. "Nuclear Waste Fund Fee
Adequacy: An Assessment." Report DOE/RW-0509. Office of Civilian Radioactive
Waste Management, Washington, D.C.
DOE (U.S. Department of Energy). 1999. "Carbon Sequestration
R&D Program Plan: FY 1999 - FY 2000." Washington, D.C.
Dresselhaus, M.S., K.A. Williams, and P.C. Eklund. 1999.
"Hydrogen Adsorption in Carbon Materials." MRS Bulletin 24 (11): 45 - 50.
Drown, D.P., E.C. Heydorn, R.B. Moore, E.S. Schaub, D.M. Brown,
W.C. Jones, and R.M. Kornosky. 1997. "The Liquid Phase Methanol (LPMEOHTM)
Process Demonstration at Kingsport." Paper presented at the Fifth Annual DOE
Clean Coal Technology Conference, 7 - 9 January, Tampa, Fla.
Dunnison, D.S., and J. Wilson. 1994. "PEM Fuel Cells: A
Commercial Reality." In A Collection of Technical Papers: Part 3, 29th
Intersociety Energy Conversion Engineering Conference. Washington, D.C.:
American Institute of Aeronautics and Astronautics.
EIA (U.S. Energy Information Administration). 1998a. Annual
Energy Outlook 1999, with Projections Through 2020. DOE/EIA-0383(99).
Washington, D.C.: U.S. Department of Energy.
EIA (U.S. Energy Information Administration). 1998b. Electric
Power Annual 1997, Volume II. DOE/EIA-0348(97)/2. Washington, D.C.: U.S.
Department of Energy.
EIA (U.S. Energy Information Administration). 1999a.
International Energy Outlook 1999, with Projections through 2020.
DOE/EIA-0484(99). Washington, D.C.: U.S. Department of Energy.
EIA (U.S. Energy Information Administration). 1999b. Monthly
Energy Review. DOE/EIA-0035(99/04). Washington, D.C.: U.S. Department of
Energy.
Feiveson, H.A. 1978. "Proliferation-Resistant Nuclear Fuel
Cycles." Annual Review of Energy 3: 357 - 94.
Feiveson, H.A. 1999. "Expanding Nuclear Power in a Greenhouse
World." Paper presented at Global ’99: Nuclear Technology - Bridging the
Millennia, International Conference on Future Nuclear Systems, 29 August - 3
September, Jackson Hole, Wyo.
Feiveson, H.A., F. von Hippel, and R.H. Williams. 1979. "Fission
Power: An Evolutionary Strategy." Science 203: 330 - 37.
Fetter, S. 1999. "Climate Change and the Transformation of World
Energy Supply." Stanford University, Center for International Security and
Cooperation, Stanford, Calif.
Fetter, S., M. Bunn, and J.P. Holdren. 1999. "The Economics of
Reprocessing versus Direct Disposal of Spent Nuclear Fuel: Short-Term and
Long-Term Prospects." Paper presented at Global ’99: Nuclear Technology -
Bridging the Millennia, International Conference on Future Nuclear Systems, 29
August - 3 September, Jackson Hole, Wyo.
Filin, A.I., V.V. Orlov, V.N. Leonov, A.G. Sila-Novitskij, V.S.
Smirnov, and V.S. Tsikunov. 1999. "Design Features of BREST Reactors;
Experimental Work to Advance the Concept of BREST Reactors; Results and Plans."
Paper presented at Global ’99: Nuclear Technology - Bridging the Millennia,
International Conference on Future Nuclear Systems, 29 August - 3 September,
Jackson Hole, Wyo.
Fleisch, T.H., and P.C. Meurer. 1995. "DME: The Diesel Fuel for
the 21st Century?" Paper presented at the AVL Conference on Engine and
Environment 1995, Graz, Austria.
Fritsch, P. 1996. "Exxon Project to Expand Use of Natural Gas."
Wall Street Journal, 30 October, p. A3.
Gasperin, A., P. Reichert, and A. Radkowsky. 1997. "Thorium Fuel
for Light Water Reactors - Reducing Proliferation Potential of Nuclear Power
Cycle." Science and Global Security 6: 265 - 90.
Gillena, E. 1994. "Science Friction: How Technology, Time, and
Concilation Could End the Bitter War over Nuclear Waste." Nukem
(November): 4 - 19.
Glaser, A. 1998. "The Thorium Fuel Cycle: A Noteworthy Gain in
Proliferation Resistance?" Paper presented at the Tenth International Summer
Symposium on Science and World Affairs, 14 - 21 July, Boston.
Goldstein, R. 1992. Solid Oxide Fuel Cell Research at EPRI.
Technical Brief. Palo Alto, Calif.: Electric Power Research Institute.
Gopalakrishnan, A. 1999. "Issues of Nuclear Safety."
Frontline, 26 March.
Gunter, W.D. 1999. Personal communication. 5 October.
Gunter, W.D., R.J. Chalaturnyk, and J.D. Scott. 1999.
"Monitoring of Aquifer Disposal of CO2: Experience from Underground
Gas Storage and Enhanced Oil Recovery." In B. Eliasson, P. Riemer, and A.
Wokaun, eds., Greenhouse Gas Control Technologies: Proceedings of the 4th
International Conference on GHG Control Technologies. Amsterdam: Pergamon.
Gunter, W.D., T. Gentzix, B.A. Rottenfusser, and R.J.H.
Richardson. 1997. "Deep Coalbed Methane in Alberta, Canada: A Fuel Resource with
the Potential of Zero Greenhouse Emissions." Energy Conversion and Management
38: S217 - 22.
Gunter, W.D., E.H. Perkins, and T.J. McCann. 1993. "Aquifer
Disposal of CO2-Rich Gases: Reaction Design for Added Capacity."
Energy Conversion and Management 34: 941 - 48.
H�ckel, E. 1997. "Internationalization of the Back End of the
Nuclear Fuel Cycle: Problems and Prospects." Paper resented at the IAEA
Symposium on the Nuclear Fuel Cycle and Reactor Strategies: Adjusting to
Realities, 3 - 6 June, Vienna.
Hagen, R.E., 1998. "Asia’s Nuclear Power Disparity: Glowing
Promises, Dismal Performance." Paper presented at the International Symposium on
Energy Future in the Asia-Pacific Region, 27 - 28 March, Honolulu, Hawaii.
Hansen, J.B., B. Voss, F. Joensen, and I.D. Siguroardottir.
1995. "Large-Scale Manufacture of Dimethyl Ether - A New Alternative Diesel Fuel
from Natural Gas." Paper presented at the International Congress and Exhibition
of Society of Automotive Engineers, 27 February - 2 March, Detroit, Mich.
Hard, R.J. 1997. "Will the Nuclear Scales Balance?" Nukem
Market Report (November): 11.
Haschke, J.M., T.H. Allen, and L.A. Morales. 2000. "Reaction of
Plutonium Dioxide with Water: Formation and Properties of PuO2+x."
Science 287 (5451): 285 - 87.
Health Effects Institute. 1987. Automotive Methanol Vapors
and Human Health. Cambridge, Mass.
Henderick, P. 1999. "An Assessment of Biomass-Powered
Microturbines and the Potential for Applications in Rural China." M.S. thesis.
Princeton University, Department of Mechanical and Aerospace Engineering and
Center for Energy and Environmental Studies, Princeton, N.J.
Henderick, P., and R.H. Williams. 2000. "Trigeneration in a
Northern Chinese Village Using Crop Residues." Energy for Sustainable
Development 4 (3): 12 - 28.
Hendriks, C.A. 1994. "Carbon Dioxide Removal from Coal-Fired
Power Plants." Ph.D. thesis, Utrecht University, Department of Science,
Technology, and Society, Utrecht, Netherlands.
Herring, J.S., and P.E. MacDonald. 1998. "Characteristics of a
Mixed Thorium-Uranium Dioxide High-Burnup Fuel." Idaho National Engineering and
Environmental Laboratory, Idaho Falls, Ida.
Herzog, H., 1999a. "The Economics of CO2: Separation
and Capture." Paper presented at the Second Dixie Lee Ray Memorial Symposium,
August, Washington, D.C. Available at
http://web.mit.edu/energylab/www/hjherzog/publications.html
Herzog, H. 1999b. "Ocean Sequestration of CO2: An
Overview." In B. Eliasson, P. Riemer, and A. Wokaun, eds., Greenhouse Gas
Control Technologies: Proceedings of the 4th International Conference on GHG
Control Technologies. Amsterdam: Pergamon.
Hill, R.N., J.E. Cahalan, H.S. Khalil, and D.C. Wade. 1999.
"Development of Small, Fast Reactor Core Designs Using Lead-Based Coolant."
Paper presented at Global ’99: Nuclear Technology - Bridging the Millennia,
International Conference on Future Nuclear Systems, 29 August - 3 September,
Jackson Hole, Wyo.
Hitchon, B., W.D. Gunter, T. Gentzis, and R. Bailey. 1999.
"Sedimentary Basins and Greenhouse Gases: A Serendipitous Association."
Energy Conversion and Management 40: 825 - 43.
Hoff, T.E., H.J. Wenger, and B.K. Farmer. 1996. "Distributed
Generation: An Alternative to Electricity Investments in System Capacity."
Energy Policy 24 (2): 137 - 47.
Holdren, J. P. 1989. "Civilian Nuclear Technologies and Nuclear
Weapons Proliferation." In C. Schaerf, B. Holden-Reid, and D. Carlton, eds.,
New Technologies and the Arms Race. London: Macmillan.
Holloway, S., ed. 1996. The Underground Storage of Carbon
Dioxide. Report prepared for Joule II Programme of Commission of the
European Communities, Contract JOU2 CT92-0031, Brussels.
Holloway, S., ed. 1997. "Safety of Underground Disposal of
Carbon Dioxide." Energy Conversion and Management 38: S241 - 45.
Holt, N. 1999a. "Comments on the DOE Vision 21 Program with
Particular Reference to Gasification and Associated Technologies." Paper
presented to the Committee on Research and Development Opportunities for
Advanced Fossil-Fueled Energy Complexes of National Research Council, 30 June,
Washington, D.C.
Holt, N. 1999b. "What’s in the Pipeline? New Projects and
Opportunities." Paper presented at the Gasification Technologies Conference, 17
- 20 October, San Francisco, Calif.
Honeyman, B.D. 1999. "Colloidal Culprits in Contamination."
Nature 397: 23 - 24.
Hooper, R. 1997. "Strengthened Safeguards: Insight into the
IAEA’s Strengthened Safeguards System." IAEA Bulletin 39 (4).
IAEA (International Atomic Energy Agency). 1999. Energy,
Electricity, and Nuclear Power Estimates for the Period Up to 2020.
Reference Data Series 1. Vienna.
IEA (International Energy Agency). 1996. "CO2 Capture
and Storage in the Natuna NG Project." Greenhouse Issues 22: 1.
IEA (International Energy Agency). 1998. Carbon Dioxide
Disposal from Power Stations. IEA Greenhouse Gas Programme,
https://www.ieagreeen.org.uk
IPCC (Intergovernmental Panel on Climate Change). 1995. "Climate
Change 1994: Radiative Forcing of Climate Change and an Evaluation of the IPCC
Emissions Scenarios." In J.T. Houghton, L.G. Meira Filho, J. Bruce, Hoesing Lee,
B.A. Callander, E. Haites, N. Harris, and K. Maskell, eds., Reports of
Working Groups I and III of the IPCC, Forming Part of the IPCC Special Report to
the First Session of the Conference of Parties to the UN Framework Convention on
Climate Change. Cambridge: Cambridge University Press.
IPCC (Intergovernmental Panel on Climate Change). 1996a. "Energy
Supply Mitigation Options." In R.T. Watson, M.C. Zinyowera, R.H. Moss, eds.,
Climate Change 1995: Impacts, Adaptations and Mitigation of Climate Change:
Scientific-Technical Analyses. Second Assessment Report of IPCC. Cambridge:
Cambridge University Press.
IPCC (Intergovernmental Panel on Climate Change). 1996b.
"Summary for Policymakers: Scientific-Technical Analyses of Impacts,
Adaptations, and Mitigations of Climate Change." In R.T. Watson, M.C. Zinyowera,
and R.H. Moss, eds., Climate Change 1995: Impacts, Adaptations and Mitigation
of Climate Change: Scientific-Technical Analyses. Second Assessment Report
of IPCC. Cambridge: Cambridge University Press.
James, B.D., G.N. Baum, F.D. Lomax, C.E. Thomas, and I.F. Kuhn.
1996. "Comparison of Onboard Hydrogen Storage for Fuel Cell Vehicles." In
Direct Hydrogen-Fueled Proton-Exchange Membrane (PEM) Fuel Cell
System for Transportation Applications. Final report prepared for Ford Motor
Company under Prime Contract DE-AC02-94CE50389. Washington, D.C.: U.S.
Department of Energy.
Kaarstad, O. 1992. "Emission-Free Fossil Energy from Norway."
Energy Conversion and Management 33 (5 - 8): 781 - 86.
Kaarstad, O., and H. Audus. 1997. "Hydrogen and Electricity from
Decarbonised Fossil Fuels." Energy Conversion and Management 38: S431 -
42.
Kadak, A.C. 1999. "The Politically Correct Reactor."
Massachusetts Institute of Technology, Nuclear Engineering Department,
Cambridge, Mass.
Kartha, S., and P. Grimes. 1994. "Fuel Cells: Energy Conversion
for the Next Century." Physics Today (November): 54 - 61.
Kartha, S., T.G. Kreutz, and R.H. Williams. 1997. "Small-Scale
Biomass Fuel Cell/Gas Turbine Power Systems for Rural Areas." Paper presented at
the Third Biomass Conference of the Americas, 19 - 24 August, Montreal.
Kersting, A.B. 1999. "Migration of Plutonium in Ground Water at
the Nevada Test Site." Nature 39 (7): 56 - 59.
Kittelson, D.B. 1998. "Engines and Nanoparticles." Journal of
Aerosol Science 29 (5 - 6): 575 - 88.
Kjaer, S. 1993. "The Future 400 MW ELSAM Units in Aalborg and
Skaerbaek, Denmark." VGB Kraftwerkstechnik 73 (11): 803 - 10.
Koide, H., J. Shindo, Y. Tazaki, M. Iljima, K. Ito, N. Kimura,
and K. Omata. 1997. "Deep Seabed Disposal of CO2: The Most Protective
Storage." Energy Conversion and Management 38: S253 - 58.
Kovacik, J.M. 1996. "Cogeneration Application Considerations."
GE Power Generation, General Electric Company, Schenectady, N.Y.
Kreutz, T., and J. Ogden. 2000. "Prospective Performance and
Economics of Residential Cogeneration Using Natural Gas-Fueled PEMFC Power
Systems." Presented at the 11th Annual U.S. Hydrogen Meeting, 29 February - 2
March, Vienna, Va.
Krewitt, W., T. Heck, A. Truckenmueller, and R. Friedrich. 1999.
"Environmental Damage Costs from Fossil Electricity Generation in Germany and
Europe." Energy Policy 27: 173 - 83.
Kruger, M., H. Luders, B. Luers, R. Kayfmann, W. Koch, and T.
Kauffeldt. 1997. "Influence of Exhaust Gas Aftertreatment on Particulate
Characteristics of Vehicle Diesel Engines [in German]." Motortechnische
Zeitshrift 58.
Kupitz, J., and J. Cleveland. 1999. "Overview of Global
Development of Advanced Nuclear Power Plants, and the Role of the IAEA."
International Atomic Energy Agency, Vienna.
Larson, E.D., and Jin Haiming. 1999. "A Preliminary Assessment
of Biomass Conversion to Fischer-Tropsch Cooking Fuels for Rural China." Paper
prepared for the Fourth Biomass Conference of the Americas, 29 August - 2
September, Oakland, Calif.
Larson, E.D., E. Worrell, and J.S. Chen. 1996. "Clean Fuels from
Municipal Solid Waste for Fuel Cell Buses in Metropolitan Areas." Resources,
Conservation, and Recycling 17: 273 - 98.
Leventhal, P., and Y. Alexander, eds. 1987. Preventing
Nuclear Terrorism. Lexington, Mass.: Lexington Books.
Lidsky, L. 1991: "Nuclear Power in a World with Options." Paper
presented at Symposium on (R)Evolutionary Reactor Types, Ultra-Centrfuge
Nederland N.V., 29 May, Almelo, Netherlands.
Lidsky, L., and S.M. Cohn. 1993. "What Now? An Examination of
the Impact of the Issues Raised. A Response to the Presentation by R.H.
Williams, ‘The Outlook for Renewable Energy’." In Proceedings of
the 2nd MIT International Conference on the New Generation of Nuclear Power
Technology. Cambridge, Mass.: Massachusetts Institute of Technology.
Lidsky, L., and M.M. Miller. 1998. "Nuclear Power and Energy
Security: A Revised Strategy for Japan." Massachusetts Institute of Technology,
Center for International Studies, Cambridge, Mass.
Lilienthal, D.E., C.I. Barnard, J.R. Oppenheimer, C.A. Thomas,
and H.A. Winne. 1946. A Report on the International Control of Atomic Energy.
Report prepared for Secretary of State’s Committee on Atomic Energy.
Washington, D.C.: U.S. Government Printing Office.
Lindeberg, E. 1997. "Escape of CO2 from Aquifers."
Energy Conversion and Management 38: S235 - 40.
Lipman, T.E., and D. Sperling. 1999. "Forecasting the Costs of
Automotive PEM Fuel Cell Systems Using Bounded Manufacturing Progress
Functions." Paper presented at the IEA International Workshop on Experience
Curves for Policy Making: The Case of Energy Technologies, 10 - 11 May,
Stuttgart.
Little, A.D. 1995. Fuel Cells for Building Cogeneration
Application - Cost/Performance Requirements and Markets. Final report
prepared for Building Equipment Division, Office of Building Technology, U.S.
Department of Energy. Springfield, Va.: National Technical Information Service.
Liu, C., Y.Y. Fan, M. Liu, H.T. Cong, H.M. Cheng, and M.S.
Dresselhaus. 1999. "Hydrogen Storage in Single-Walled Carbon Nanotubes at Room
Temperature." Science 286: 1127 - 29.
LLNL (Lawrence Livermore National Laboratory). 1998.
Comparative Analysis of Approaches to Protection of Fissile Materials.
Proceedings of a Workshop held 28 - 30 July 1997, Stanford, Calif. Document
Conf. 97-0721. Livermore, Calif.: Lawrence Livermore National Laboratory.
Lloyd, A.C. 1999. "The Power Plant in your Basement."
Scientific American 280 (7): 80 - 86.
Lopatkin, A.V., and V.V. Orlov. 1999. "Fuel Cycle of BREST-1200
with Non-Proliferation of Plutonium and Equivalent Disposal of Radioactive
Waste." Paper presented at Global ’99: Nuclear Technology - Bridging the
Millennia, International Conference on Future Nuclear Systems, 29 August - 3
September, Jackson Hole, Wyo.
Lyman, E.S., and H.A. Feiveson. 1998. "The Proliferation Risks
of Plutonium Mines." Science and Global Security 7: 119 - 28.
McCarthy, J.F., W.E. Sanford, and P.L. Stafford. 1998.
"Lanthanide Field Tracers Demonstrate Enhanced Transport of Transuranic
Radionuclides by Natural Organic Matter." Environmental Science and
Technology 32 (24): 3901 - 08.
McCombie, C. 1999a. "Multinational Repositories: A Win-Win
Disposal Strategy." Paper presented at ENS Topseal '99 Conference, October,
Antwerp, Belgium.
McCombie, C. 1999b. "A Prospective Global Solution for the
Disposal of Unwanted Nuclear Materials." Paper presented at the ICEM Conference,
Nagoya, Japan.
McCombie, C., G. Butler, M. Kurzeme, D. Pentz, J. Voss, and P.
Winter. 1999. "The Pangea International Repository: A Technical Overview." Paper
presented at the WM99 Conference, March, Tucson, Ariz.
McNeely, M. 1998. "Intercooling for LM6000 Gas Turbines."
Diesel & Gas Turbine Worldwide (July - August): 42 - 45.
Madic, C. 2000. "Towards the End of PuO2’s
Supremacy." Science 287 (5451): 243 - 44.
Marchetti, C. 1976. "Hydrogen and Energy Systems."
International Journal of Hydrogen Energy 1: 3 - 10.
Mark, J.C. 1993. "Explosive Properties of Reactor-Grade
Plutonium." Science and Global Security 4: 111 - 28.
Masters, C.D., E.D. Attanasi, and D.H. Root. 1994. "World
Petroleum Assessment and Analysis." Paper presented at the Fourteenth World
Petroleum Congress, Stavanger, Norway.
Matsuoka, J., and H. Hiranuma.1998. "Nuclear Industry and Human
Resources in Japan." Paper presented at the International Symposium on Energy
Future in the Asia-Pacific Region, 27 - 28 March, Honolulu, Ha.
Mayer, A., H. Egli, H. Burtscher, J. Czerwinski, and H. Gehrig.
1995. "Particle Size Distribution Downstream Traps of Different Design." SAE
Paper 950373. Society of Automotive Engineers, Warrendale, Pa.
Miller, I., J. Black, C. McCombie, D. Pentz, and P. Zuidema.
1999. "High-Isolation Sites for Radioactive Waste Disposal: A Fresh Look at the
Challenge of Locating Safe Sites for Radioactive Repositories." Paper presented
at the WM99 Conference, March, Tucson, Ariz.
Miyamoto, Y., S. Shizawa, M. Ogawa, and K. Hada. 1999.
"Development Program on Hydrogen Production at JAERI (Japan Atomic Energy
Research Institute)." Paper presented at Global ’99: Nuclear Technology -
Bridging the Millennia, International Conference on Future Nuclear Systems, 29
August - 3 September, Jackson Hole, Wyo.
Moore, R.B., and V. Raman. 1998. "Hydrogen Infrastructure for
Fuel Cell Transportation." International Journal of Hydrogen Energy 23
(7): 617 - 20.
Moritsuka, H. 1999. "Hydrogen Decomposed Turbine Systems for
Carbon Dioxide Recovery." In B. Eliasson, P. Riemer, and A. Wokaun, eds.,
Greenhouse Gas Control Technologies: Proceedings of the 4th International
Conference on GHG Control Technologies. Amsterdam: Pergamon.
Motter, J.W. 1999. "Operational Experience with the 100 MW Pinon
Pine IGCC Project: Lessons Learned, and Outlook for the KRW Air-Blown
Gasification Technology with Hot-Gas Cleanup." Paper presented at the Seventh
Clean Coal Technology Conference - 21st Century Coal Utilization: Prospects for
Economic Viability, Global Prosperity and a Cleaner Environment, 22 - 24 June,
Knoxville, Tenn.
Mukunda, H., S. Dasappa, and U. Srinivasa. 1993. "Wood
Gasification in Open-Top Gasifiers - The Technology and the Economics." In T.B.
Johansson, H. Kelly, A.K.N. Reddy, and R.H. Williams, eds., Renewable Energy:
Sources for Fuel and Electricity. Washington, D.C.: Island Press.
Nakicenovic, N., A. Gr�bler, and A. McDonald, eds. 1998.
Global Energy Perspectives. Cambridge: Cambridge University Press.
NEA (Nuclear Energy Agency of the Organisation for Economic
Cooperation and Development). 1994. The Economics of the Nuclear Fuel Cycle.
Paris.
NEA (Nuclear Energy Agency of the Organisation for Economic
Cooperation and Development). 1999. Progress Towards Geologic Disposal of
Radioactive Waste: Where Do We Stand: An International Assessment.
Issy-les-Moulineaux, France.
Nicholls, D.R. 1998. Status of the Pebble Bed Modular
Reactor. South Africa: Eskom.
Norton, P., K. Vertin, B. Bailey, N.N. Clark, D.W. Lyons, S.
Goguen, and J. Eberhardt. 1998. "Emissions from Trucks Using Fischer-Tropsch
Diesel Fuels." SAE Paper 982526. Society of Automotive Engineers, Warrendale,
Pa.
NPPDP (Nuclear Power Plant Design Project). 1998. "A Response to
the Environmental and Economic Challenge of Global Warming: Phase I: Review of
Options and Selection of Technology of Choice." Massachusetts Institute of
Technology, Cambridge, Mass.
NRC (National Research Council). 1992. Nuclear Power:
Technical and Institutional Options for the Future. Washington, D.C.:
National Academy Press.
NRC (National Research Council). 1998. Review of the
Partnership for a New Generation of Vehicles: Fourth Report. Prepared by the
Standing Committee to Review the Research Program of the Partnership for a New
Generation of Vehicles. Washington, D.C.: National Academy Press.
Ogden, J.M., T.G. Kreutz, and M. Steinbugler. 1998. "Fuels for
Fuel Cell Vehicles: Vehicle Design and Infrastructure Issues." SAE Technical
Paper 982500. Prepared for the International Fall Fuels and Lubricants Meeting
and Exposition, 19 - 22 October, San Francisco, Calif.
Ogden, J.M., and R.H. Williams. 1989. Solar Hydrogen: Moving
Beyond Fossil Fuels. Washington, D.C.: World Resources Institute.
Ormerod, W. 1994. The Disposal of Carbon Dioxide from Fossil
Fuel Power Stations. IEA/GHG/SR3. Cheltenham, U.K.: IEA Greenhouse Gas
Research and Development Programme.
O’Neill, Kate. 1998. (Not) Getting to
‘Go’: Recent Experience in International Cooperation over the
Management of Spent Nuclear Fuel. BCSIA Discussion Paper 98-22. Harvard
University, Kennedy School of Government, Cambridge, Mass.
Orlov, V., V. Leonov, A. Sila-Novitski, V. Smirnov, V. Tsikunov,
and A. Filin. 1999. "Nuclear Power of the Coming Century and Requirements of the
Nuclear Technology." Paper presented at Global ’99: Nuclear Technology -
Bridging the Millennia, International Conference on Future Nuclear Systems, 29
August - 3 September, Jackson Hole, Wyo.
OTA (U.S. Office of Technology Assessment). 1995. Nuclear
Safeguards and the International Atomic Energy Agency. Report OTA-ISS-615.
Washington D.C.: U.S. Congress.
Paffenbarger, J.A., and E. Bertel. 1998. "Results from the OECD
report on International Projects of Electricity Generating Costs." Paper
presented at IJPGC 98: International Joint Power Generation Conference and
Exhibition, 24 - 26 August.
Parsons Infrastructure and Technology Group, Inc. 1998.
"Decarbonized Fuel Plants Utilizing Inorganic Membranes for Hydrogen
Production." Paper presented at the Twelfth Annual Conference on Fossil Fuels
Materials, 12 - 14 May, Knoxville, Tenn.
PCAST (U.S. President’s Committee of Advisors on Science
and Technology) Fusion Review Panel. 1995. The U.S. Program of Fusion
Energy Research and Development. Washington, D.C.
PCAST Energy Research and Development Panel. 1997. Federal
Energy Research & Development for the Challenges of the 21st Century.
https://www.whitehouse.gov/WH/EOP/OSTP/html/ISTP_Home.html
PCAST Panel on ICERD3 (Panel on International
Cooperation in Energy Research, Development, Demonstration, and Deployment).
1999. Powerful Partnerships: The Federal Role in International Cooperation on
Energy Innovation. https://www.whitehouse.gov/WH/EOP/OSTP/html/ISTP_Home.html
Peng, X.D., B.A. Toseland, and P.J.A. Tijm. 1998. "Kinetic
Understanding of the Chemical Synergy under LPDMETM Conditions - Once-Through
Applications." Paper presented at the Fifteenth International Symposium on
Chemical Reaction Engineering, 13 - 16 September, Newport Beach, Calif.
Peng, X.D., B.A. Toseland, A.W. Wang, and G.E. Parris. 1997.
"Progress in Development of PPMDE Process: Kinetics and Catalysts." Paper
presented at the Coal Liquefaction and Solid Fuels Contractors Review
Conference, 3 - 4 September, Pittsburgh, Penn.
Peterson, P.F. 1996. "Long-Term Safeguards for Plutonium in
Geologic Repositories." Science and Global Security 6: 1 - 29.
Pillai, K.K. 1989. "Pressurized Fluidized Bed Combustion." In
T.B. Johansson, B. Bodlund, and R.H. Williams, eds., Electricity: Efficient
End-Use and New Generation Technologies, and Their Planning Implications.
Lund, Sweden: Lund University Press.
Rabl, A. and J.V. Spadaro. 2000. "Public Health Impact of Air
Pollution and Implications for the Energy System." Annual Review of Energy
and the Environment 25 (in press).
Ringland, J.T. 1994. Safety Issues for Hydrogen-Powered
Vehicles. Albuquerque, N.M.: Sandia National Laboratories.
Rogner, H.-H. 1998. "Hydrogen Technologies and Technology
Learning Curve." International Journal of Hydrogen Energy 23 (9): 833 -
40.
Ross, M., R. Goodwin, R. Watkins, M.Q. Wang, and T. Wnnzel.
1995. Real-World Emissions from Model Year 1993, 2000, and 2010 Passenger
Cars. Report prepared for Energy Foundation and U.S. Department of Energy,
through Lawrence Berkeley Laboratory and Oak Ridge National Laboratory.
Berkeley, Calif.: American Council for an Energy-Efficient Economy.
Ryan, M.L. 1999. "Fuel Costs Taking More of O&M Budget: Even
As Costs Drop, Efficiency Rises." Nuclear Fuel 24 (14): 1 - 10.
Saviharju, K. 1995. "Combined Heat and Power Production."
Background paper prepared for Working Group II of IPCC’s Second Assessment
Report. In VTT Research Notes. Espoo, Finland.
Schaberg, P., and others 1997. "Diesel Exhaust Emissions Using
Sasol Slurry Phase Distillate Fuels." SAE Paper 972898. Society of Automotive
Engineers, Warrendale, Pa.
Scott, D.S., and W. Hafele. 1990. "The Coming Hydrogen Age:
Preventing World Climatic Disruption." International Journal of Hydrogen
Energy 15 (10): 727 - 37.
SIEP (Shell International Exploration and Production, B.V.).
1998. "Doing It the Gentle Way: Producing Electricity from Hydrocarbons without
CO2." SIEP 98-5039. Research and Technical Services, London.
Simbeck, D. 1995. "Air-Blown versus Oxygen-Blown Gasification."
Paper presented at the Institution of Chemical Engineers Conference on
Gasification: An Alternative to Natural Gas, 22 - 23 November, London.
Simbeck, D. 1999a. Personal communication. July.
Simbeck, D. 1999b: "Perspective on the Future of Distributed
Generation - Hype or Reality?" Paper presented at the Energy Frontiers
International Conference on Distributed Generation: Microturbines & Fuel
Cells, 4 - 5 May, Orcas Island, Wash.
Simbeck, D. 1999c. "A Portfolio Selection Approach for Power
Plant CO2 Capture, Separation, and R&D Options." In B. Eliasson,
P. Riemer, and A. Wokaun, eds., Greenhouse Gas Control Technologies:
Proceedings of the 4th International Conference on GHG Control Technologies.
Amsterdam: Pergamon.
Simbeck, D., R. Dickenson, and J. Moll. 1981. "Coal
Liquefaction: Direct versus Indirect - Making a Choice." Oil and Gas Journal
(4 May): 254 - 68.
Simbeck, D., and H.E. Johnson (SFA Pacific). 1999: "Report on
SFA Pacific Gasification Database and World Market Report." Paper presented at
the 1999 Gasification Technologies Conference, 17 - 20 October, San Francisco,
Calif.
Simbeck, D., and A.D. Karp. 1995. "Air-Blown versus Oxygen-Blown
Gasification - An Honest Appraisal." Paper presented at Alternate Energy
’95: Council on Alternate Fuels, 3 May, Vancouver, Canada.
Simbeck, D., N. Korens, F.E. Biasca, S. Vejtasa, and R.L.
Dickenson. 1993. "Coal Gasification Guidebook: Status, Applications, and
Technologies." Final report TR-102034. Electric Power Research Institute, Palo
Alto, Calif.
Sirman, M., E. Owens, and K. Whitney. 1998. "Emissions
Comparison of Alternative Fuels in an Advanced Automotive Diesel Engine."
Interim report TFLRF 338. Prepared for U.S. Department of Energy by U.S. Army
TARDEC Fuels and Lubricants Research Facility. Southwest Research Institute, San
Antonio, Tex.
Socolow, R.H., ed. 1997. "Fuels Decarbonization and Carbon
Sequestration: Report of a Workshop by the Members of the Report Committee."
PU/CEES Report 302. Princeton University, Center for Energy and Environmental
Studies, Princeton, N.J. Available at https://www.princeton.edu/~ceesdoe
Spadaro, J.V, and A. Rabl. 1998. "Social Costs and Environmental
Burdens of Transport: An Analysis Using Two Case Studies in France." Ecole des
Mines, Centre d’Energetique, Paris.
Spadaro, J.V, A. Rabl, E. Jourdain, and P. Coussy. 1998.
"External Costs of Air Pollution: Case Study and Results for Transport between
Paris and Lyon." International Journal of Vehicle Design 20: 274 - 82.
Spengler, J., and R. Wilson. 1996. "Emissions, Dispersion, and
Concentration of Particles." In R. Wilson and J. Spengler, eds., Particles in
Our Air: Concentrations and Health Effects. Cambridge, Mass.: Harvard
University Press.
Spenser, D. 1999. "Integration of an Advanced CO2
Separation Process with Methods of Disposing of CO2 in Oceans
and Terrestrial Deep Aquifers." In B. Eliasson, P. Riemer, and A. Wokaun, eds.,
Greenhouse Gas Control Technologies: Proceedings of the 4th International
Conference on GHG Control Technologies, Interlaken, Switzerland, 30 August -
2 September. Amsterdam: Pergamon.
Spenser, D., and S.S. Tam. 1999. "An Engineering and Economic
Evaluation of a CO2 Hydrate Separation for Shifted Synthesis Gas."
Paper presented at the Pittsburgh Coal Conference, October, Pittsburgh, Penn.
Spiewak, I., and A.M. Weinberg. 1985. "Inherently Safe
Reactors." Annual Review of Energy 10: 431 - 62.
STATS (Committee on Separations Technology and Transmutation
Systems, National Research Council). 1996. Nuclear Wastes: Technologies for
Separations and Transmutation. Washington, D.C.: National Academy Press.
Steinberg, M., and H.C. Cheng. 1989. "Modern and Prospective
Technologies for Hydrogen Production from Fossil Fuels." International
Journal of Hydrogen Energy 14 (11): 797 - 820.
Steinbugler, M.M., and R.H. Williams. 1998. "Beyond Combustion.
Fuel Cell Cars for the 21st Century." Forum for Applied Research and Public
Policy (winter): 102 - 07.
Stiegel, G. 1994. "Indirect Liquefaction." Paper presented to
the Committee on Strategic Assessment of DOE’s Coal Program of the National
Academy of Sciences, 14 January, Washington, D.C.
Stern, B.R., and R.G. Tardiff. 1997. "Risk Characterization of
Methyl Tertiary Butyl Ether (MTBE) in Tap Water." Risk Analysis 17 (6):
727 - 43.
Stevens, S.H, V.A. Kuuskraa, D. Spector, and P. Riemer. 1999.
"Enhanced Coalbed Methane Recovery Using CO2 Injection: Worldwide
Resource and CO2 Injection Potential." In B. Eliasson, P. Riemer, and
A. Wokaun, eds., Greenhouse Gas Control Technologies: Proceedings of the 4th
International Conference on GHG Control Technologies. Amsterdam: Pergamon.
Stoll, H., and D.M. Todd. 1996. "Competitive Power Generation
Costs for IGCC." Paper presented at the EPRI Gasification Technologies
Conference, 2 - 4 October, San Francisco, Calif.
Summerfield, I.R., S.H. Goldhorpe, N. Williams, and A. Sheikh.
1993. "Costs of CO2 Disposal Options." In Proceedings of the
International Energy Agency Carbon Dioxide Disposal Symposium. Amsterdam:
Pergamon.
Thomas, C.E., B.D. James, F.D. Lomax, Jr., and I.F. Kuhn, Jr.
1998a. "Integrated Analysis of Hydrogen Passenger Vehicle Transportation
Pathways." Draft final report prepared by Directed Technologies, Inc. under
Contract AXE-6-16685-01. U.S. Department of Energy, National Renewable Energy
Laboratory, Golden, Colo.
Thomas, C.E., B.D. James, F.D. Lomax, Jr., and I.F. Kuhn, Jr.
1998b. "Societal Impacts of Fuel Options for Fuel Cell Vehicles." SAE Technical
Paper 982496. Prepared for International Fall Fuels and Lubricants Meeting and
Exposition, 19 - 22 October, San Francisco, Calif.
Tinturier, B., B. Est�ve, and H. Mouney. 1999. "Innovative
Concepts: An EDF Viewpoint." Paper presented at Global ’99: Nuclear
Technology - Bridging the Millennia, International Conference on Future Nuclear
Systems, 29 August - 3 September, Jackson Hole, Wyo.
Todd, D.M., and H. Stoll. 1997. "Integrated Gasification
Combined Cycle: The Preferred Power Technology for a Variety of Applications."
Paper presented at Power-Gen Europe ’97, June, Madrid.
Turkenburg, W.C. 1992. "CO2 Removal: Some
Conclusions." Energy Conversion and Management 33 (5 - 8): 819 - 23.
UNFCCC (United Nations Framework Convention on Climate Change).
1992. "United Nations Framework Convention on Climate Change." Convention text,
UNEP/WMO Information Unit of Climate Change (IUCC) on behalf of the Interim
Secretariat of the Convention. IUCC, Geneva.
Val�e, A.M. (Framatome). 1999. "Nuclear Reactors for the
Future." Paper presented at Global ’99: Nuclear Technology - Bridging the
Millennia, International Conference on Future Nuclear Systems, 29 August - 3
September, Jackson Hole, Wyo.
van der Burgt, M.J. 1998. "IGCC Cost Reduction Potential." Paper
presented at EPRI-GTC Gasification Technologies Conference, October, San
Francisco, Calif.
van der Burgt, M.J., J. Cantle, J., and V.K. Boutkan. 1992.
"Carbon Dioxide Disposal from Coal-Based IGCCs in Depleted Gas Fields."
Energy Conversion and Management 33 (5 - 8): 603 - 10.
van der Burgt, M.J., and C. van Liere. 1996. "Applications of
the ‘Tophat’® Cycle in Power Generation." Paper
presented at Gasification Technologies Conference, 2 - 4 October, San Francisco,
Calif.
van Liere, J.. 1998. The Tophat® Cycle.
Available at http://users.bart.nl/~jvliere/tophat.htm
Veyo, S.E. 1998. "Tubular SOFC Power System Operational
Experience." Paper presented at the Fuel Cell Seminar: Fuel Cells - Clean Energy
for Today’s World, 16 - 19 November, Palm Springs, Calif.
Wade, D.C., and D.J. Hill. 1999. "Requirements and Potential
Development Pathways for Fission Energy Supply Infrastructures of the 21st
Century: A Systems Viewpoint." Paper presented at Global ’99: Nuclear
Technology - Bridging the Millennia, International Conference on Future Nuclear
Systems, 29 August - 3 September, Jackson Hole, Wyo.
Wadman, B. 1998. "A Very Good Year for Power Generation."
Diesel & Gas Turbine Worldwide (October): 46 - 54.
Walker, W. 1999. "Nuclear Power and Non-Proliferation." In M.
Poireau and A. Zurita, eds., Nuclear in a Changing World: Proceedings of the
European Seminar, vol. 2. European Commission, Directorate General XII -
Science, Research, and Development. Luxembourg: Office of Official Publications
of the European Communities.
Walsh, M.P. 1995. "Global Trends in Diesel Emissions Control: A
1995 Update." SAE Technical Paper 950149. Presented at SAE International
Congress and Exposition, 27 February - 2 March, Detroit, Mich.
Walsh, M.P. 1997. "Global Trends in Diesel Emissions Control: A
1997 Update." SAE Technical Paper 970179. Presented at SAE International
Congress and Exposition, 24 - 27 February, Detroit, Mich.
WEC (World Energy Council). 1995. Global Transport Sector
Energy Demand Towards 2020. London.
Whipple, C.G. 1996. "Can Nuclear Waste Be Stored Safely at Yucca
Mountain?" Scientific American 274 (6).
Williams, R.H. 1978. "Industrial Cogeneration." Annual Review
of Energy 2: 313 - 56.
Williams, R.H. 1998. "Fuel Decarbonization for Fuel Cell
Applications and Sequestration of the Separated CO2." In Robert U.
Ayres, ed., Eco-restructuring: Implications for Sustainable Development.
Tokyo: United Nations University Press.
Williams, R.H. 1999a. "Hydrogen Production from Coal and Coal
Bed Methane, Using Byproduct CO2 for Enhanced Methane Recovery and
Sequestering the CO2 in the Coal Bed." In B. Eliasson, P. Riemer, and
A. Wokaun, eds., Greenhouse Gas Control Technologies: Proceedings of the 4th
International Conference on GHG Control Technologies. Amsterdam: Pergamon.
Williams, R.H. 1999b. "Towards Zero Emissions for Coal: Roles
for Inorganic Membranes." In Proceedings of the International Symposium
Towards Zero Emissions: the Challenge for Hydrocarbons. Milan:
EniTecnologie, Eni Group.
Williams, R.H., and H.A. Feiveson. 1990. "Diversion-Resistance
Criteria for Future Nuclear Power." Energy Policy (July - August): 543 -
49.
Williams, R.H., and E.D. Larson. 1989. "Expanding Roles for Gas
Turbines in Power Generation." In T.B. Johansson, B. Bodlund, and R.H. Williams,
eds., Electricity: Efficient End-Use and New Generation Technologies, and
Their Planning Implications. Lund, Sweden: Lund University Press.
Williams, R.H., and E.D. Larson. 1993. "Advanced
Gasification-Based Power Generation." In T.B. Johannson, H. Kelly, A.K.N. Reddy,
and R.H. Williams, eds., Renewable Energy: Sources for Fuels and Electricity.
Washington, D.C.: Island Press.
Williams, R.H., E.D. Larson, R.E. Katofsky, and J. Chen. 1995.
"Methanol and Hydrogen from Biomass for Transportation." Energy for
Sustainable Development 1 (5): 18 - 34.
Willrich, M., and T. Taylor. 1974. Nuclear Theft: Risks and
Safeguards. Cambridge, Mass.: Ballinger.
World Bank. 1997. Clear Water, Blue Skies: China’s
Environment in the New Century. China 2020 series. Washington, D.C.
Zrodnikov, A.V., V.I. Chitaykin, B.F. Gromov, G.I. Toshinsky,
U.G. Dragunov, and V.S. Stepanov. 1999. "Application of Reactors Cooled by
Lead-Bismuth Alloy in Nuclear Power Energy." Paper presented at Global ’99:
Nuclear Technology - Bridging the Millennia, International Conference on Future
Nuclear Systems, 29 August - 3 September, Jackson Hole,
Wyo.