Back to Home
Page of CD3WD Project or Back to list of CD3WD Publications
 |  |  | World Energy Assessment - Energy and the Challenge of Sustainability (UNDESA - UNDP - WEA - WEC, 2000, 517 p.) |  |  | PART I. ENERGY AND MAJOR GLOBAL ISSUES | | | Chapter 1. An Introduction to Energy | |  | (introduction...) | | | What is sustainable energy development? | | | Evolution of the energy system | | | Demand for energy services | | | Energy trade patterns and globalisation | | | (introduction...) | | | Crude oil and oil products | | | Coal | | | Natural gas | | | Energy prices and taxes | | | Energy investments | | | (introduction...) | | | General features | | | Capital flows | | | Chapter 2. Energy and Social Issues | | | (introduction...) | | | Towards a new approach to energy for human uses | | | Energy and poverty in developing countries | | | (introduction...) | | | Dimensions of poverty | | | The energy-poverty nexus | | | The energy ladder and household decisions about fuel choice | | | Energy strategies for alleviating poverty in developing countries | | | Energy and poverty in industrialised countries | | | Energy and women | | | (introduction...) | | | Factors determining energy-women linkages | | | Specific concerns and priority areas | | | Energy for improving the position of women | | | Energy and population | | | (introduction...) | | | Demographic transitions | | | Population momentum | | | The energy-population nexus | | | Rural energy consumption and population implications | | | Traditional biomass-based cooking and demographic indicators | | | Energy-population nexus at the global level | | | Energy and urbanisation | | | (introduction...) | | | Urbanisation and energy linkages | | | Urbanisation and energy strategies | | | Energy to improve the urban environment | | | Energy and lifestyles | | | (introduction...) | | | Energy use in the United States | | | Trends towards increased energy use | | | Conclusion | | | Chapter 3. Energy, the Environment, and Health | | | (introduction...) | | | Household scale | | | (introduction...) | | | Harvesting | | | Combustion | | | Estimated health effects | | | Greenhouse gases | | | Workplace scale | | | (introduction...) | | | Biomass | | | Coal | | | Oil and gas | | | Hydropower and other renewables | | | Nuclear danger | | | Number of workers and quantitative health effects estimates | | | Community scale | | | (introduction...) | | | Fuel-derived air pollution in cities of industrialised countries | | | Fuel-derived air pollution in cities of developing countries | | | Urban pollution control in the longer run | | | Hydroelectric dams6 | | | Nuclear power | | | Regional scale | | | (introduction...) | | | Emissions and energy | | | Future emissions | | | Acid deposition | | | Tropospheric ozone | | | Suspended fine particles | | | Regional climate change | | | Global scale: climate change from greenhouse gases | | | (introduction...) | | | Consequences of greenhouse gas-induced climate change | | | Alternative energy futures and greenhouse gas emissions | | | International agreements to address global climate change | | | Cross-scale impacts | | | (introduction...) | | | Environmental risk transition | | | Win-win strategies to link environmental improvements at different scales | | | Assessment methods | | | Implications for the future | | | (introduction...) | | | Household scale | | | Workplace scale | | | Community scale | | | Regional scale | | | Global scale | | | Cross-scale | | | Conclusion | | | Chapter 4. Energy Security | | | (introduction...) | | | New dimensions and challenges to energy security | | | (introduction...) | | | Security of electric power supply | | | Routes to enhanced energy security | | | Energy adequacy | | | (introduction...) | | | Crude oil | | | Natural gas | | | Coal | | | Nuclear energy | | | Renewables | | | The resource outlook | | | Supply security | | | (introduction...) | | | Security of crude oil supply | | | Security of natural gas supply | | | Security of coal supply | | | Nuclear energy and energy security | | | Energy intensity | | | The environment and energy security | | | Markets and energy security | | | (introduction...) | | | The role of the state | | | Regional cooperation and the growing importance of regional electricity grids and network energies | | | Conclusion |
|
World Energy Assessment - Energy and the Challenge of Sustainability (UNDESA - UNDP - WEA - WEC, 2000, 517 p.)
PART I. ENERGY AND MAJOR GLOBAL ISSUES
Chapter 1. An Introduction to Energy
Hans-Holger Rogner (Germany)
Anca
Popescu (Romania)
Life is but a continuous process of energy conversion and
transformation. The accomplishments of civilisation have largely been achieved
through the increasingly efficient and extensive harnessing of various forms of
energy to extend human capabilities and ingenuity. Energy is similarly
indispensable for continued human development and economic growth. Providing
adequate, affordable energy is essential for eradicating poverty, improving
human welfare, and raising living standards world-wide. And without economic
growth, it will be difficult to address environmental challenges, especially
those associated with poverty.
But energy production, conversion, and use always generate
undesirable by-products and emissions - at a minimum in the form of dissipated
heat. Energy cannot be created or destroyed, but it can be converted from one
form to another. The same amount of energy entering a conversion process, say,
natural gas in a home furnace, also leaves the device - some 80-90 percent as
desirable space heat or warm water, the rest as waste heat, most through the
smokestack. Although it is common to discuss energy consumption, energy is
actually transformed rather than consumed. What is consumed is the ability of
oil, gas, coal, biomass, or wind to produce useful work. Among fossil fuels the
chemical composition of the original fuel changes, resulting in by-products of
combustion, or emissions.
This chapter provides a brief introduction to energy's
importance for human life and economic functioning, and paints a broad picture
of the current energy scene. (More extensive data on energy trends appear in the
annexes to this report.) Chapters 2, 3, and 4 examine in greater detail the
links between energy and important global challenges, including social issues,
health and the environment, and energy security. Chapter 11 analyses prospects
for achieving widespread and sustainable prosperity and for reconciling high
levels of energy services with environmental
protection.
What is sustainable energy development?
In its 1987 report, Our Common Future, the World
Commission on Environment and Development defines sustainable development as
development that "meets the needs of the present without compromising the
ability of future generations to meet their own needs"(p. 8). The report further
describes sustainable development "as a process of change in which the
exploitation of resources, the direction of investments, the orientation of
technological development, and institutional change are all in harmony and
enhance both current and future potentials to meet human needs and aspirations"
(p. 46). In its broadest sense, the report notes, "the strategy for sustainable
development aims to promote harmony among human beings and between humanity and
nature" (p. 65).
The relationship between energy production and use and
sustainable development has two important features. One is the importance of
adequate energy services for satisfying basic human needs, improving social
welfare, and achieving economic development - in short, energy as a source of
prosperity. The other is that the production and use of energy should not
endanger the quality of life of current and future generations and should not
exceed the carrying capacity of ecosystems.
|
The production and use of energy should
not endanger the
quality of life of
current and future generations
and should not exceed
the
carrying capacity of
ecosystems. |
Throughout the 20th century, the ready availability of
commercial energy fuelled global economic development. But much of the
developing world continues to rely on non-commercial energy sources, mainly
fuelwood, and has limited access to modern energy such as electricity and liquid
fuels. Lack of capital and technological capacity hinders the development of
adequate supplies, with deleterious effects on economic and social development.
Because they affect affordability and economic competitiveness,
energy prices need to be taken into account when analysing options for
sustainable energy development. Moreover, energy supplies should be secure and
reliable. For that reason, attention should be given to:
· The dependence on
energy supplies from politically unstable regions or unevenly distributed
locations.
· The possible disruption of
energy supplies due to severe accidents.
· The sociocultural environment
in which energy systems operate.
· The eventual exhaustion of
finite energy resources such as coal, crude oil, natural gas, and uranium, for
which alternative options must be developed.
Finally, the development and introduction of sustainable energy
technology must occur in a socially acceptable manner, with a broad range of
citizens participating in decision-making.
No energy production or conversion technology is without risk or
waste. Somewhere along all energy chains - from the extraction of resources to
the provision of energy services - pollutants are produced, emitted, or disposed
of, often with severe impacts on human health and the environment. The
combustion of fossil fuels is responsible for most urban air pollution, regional
acidification, and risks of human-induced climate change. The use of nuclear
power has created a number of concerns about the safety of nuclear
installations, the storage and disposal of high-level radioactive waste, and the
proliferation of nuclear weapons. The manufacturing of photovoltaic panels
generates toxic waste, and in some developing countries the use of biomass
contributes to desertification and biodiversity losses.
As noted, to be considered sustainable, energy systems must not
overload the carrying capacity of ecosystems. Nor should the use of finite
resources compromise the ability of future generations to meet their energy
service requirements. Efficient use of resources, clean conversion processes,
and the timely development of inexhaustible supply options - such as renewable
forms or nuclear energy based on breeding or fusion - are therefore the
principal strategies for sustainable energy
development.
Evolution of the energy system
From the perspective of society, energy is not an end in itself.
The energy system is designed to meet demands for a variety of services such as
cooking, illumination, comfortable indoor climate, refrigerated storage,
transportation, information, and consumer goods. People are interested not in
energy, but in energy services.
An energy system comprises an energy supply sector and the
end-use technology needed to provide energy services (see figure 1 the overview
and figure 6.1). The energy supply sector involves complex processes for
extracting energy resources (such as coal or oil), for converting these into
more desirable and suitable forms of energy (such as electricity or gasoline),
and for delivering energy to places where demand exists. The end-use part of the
system transforms this energy into energy services (such as illumination or
mobility).
Energy services are the result of a combination of technology,
infrastructure (capital), labour (know-how), materials, and energy carriers. All
these inputs carry a price and, within each category, are partly substitutable
for one another. From the perspective of consumers, the important issues are the
economic value or utility derived from the services. The energy carrier and the
source of that carrier often matter little. Consumers are generally unaware of
the upstream activities of the energy system. The energy system is service
driven (from the bottom up), whereas energy flows are driven by resource
availability and conversion processes (from the top down). Energy flows and
driving forces interact intimately (see below). Thus the energy sector should
never be analysed in isolation. It is not sufficient to consider only how energy
is supplied; the analysis must also include how and for what purposes energy is
used.
Modern energy systems rely on manufactured or processed fuels
and sophisticated conversion equipment. Traditional energy usually means
unprocessed fuels close to their primary form and low-technology conversion
devices (or no technology). Low-technology energy conversion usually implies low
efficiency and high pollution. Thus technology is a critical link between the
supply of energy services and access, affordability, and environmental
compatibility. Technology is more than a power plant, an automobile, or a
refrigerator. It includes infrastructure such as buildings, settlement patterns,
road and transportation systems, and industrial plants and equipment. It also
includes social and cultural preferences as well as laws and regulations that
reflect the compatibility of technology options with social preferences and
capabilities and cultural backgrounds.
The overall efficiency of an energy system depends on individual
process efficiencies, the structure of energy supply and conversion, and energy
end-use patterns. It is the result of compounding the efficiencies of the entire
chain of energy supply, conversion, distribution, and end-use processes. The
weakest link in the analysis of the efficiency of various energy chains is the
determination of energy services and their quantification, mostly due to a lack
of data on end-use devices and actual patterns of their use.
In 1997 the global efficiency of converting primary energy
(including non-commercial energy) to final energy, including electricity, was
about 70 percent (279 exajoules over 399 exajoules). The efficiency of
converting final energy to useful energy is lower, with an estimated global
average of 40 percent (Nakicenovic and others, 1990; Gilli, Nakicenovic, and
Kurz, 1995). The resulting average global efficiency of converting primary to
useful energy is the product of these two efficiencies, or 28 percent. Because
detailed statistics do not exist for most energy services and many rough
estimates enter the efficiency calculations, the overall efficiency reported in
the literature spans a wide range, from 15 to 30 percent (Olivier and Miall,
1983; Ayres, 1989; Wall, 1990; Nakienovic and others, 1990; Schaeffer and
Wirtshafter, 1992; and Wall, Scuibba, and Naso, 1994).
|
Technology is a critical link between
the supply of energy
services
and access, affordability,
and environmental
compatibility.
|
Specific energy services are supplied by various combinations of
energy and technology. In this context, technology is often viewed as capital
and know-how. To a large extent, energy and technology, capital, and know-how
can substitute for one another. Replacing less efficient and dirty technology
with more efficient and cleaner technology is the substitution of capital and
know-how for energy. Capital investment, however, typically involves energy
embedded in materials, manufacturing, and construction, as well as labour and
know-how.
The core business of the energy sector has traditionally
involved delivering electricity to homes and businesses, natural gas to
industries, and gasoline to gas stations. In the past, electricity supply -
especially electrification of unserved areas - was a matter of sociopolitical
development strategy. As a matter of state importance, energy supply was often
directed by a regional utility under essentially monopolistic conditions. More
recently, energy sector liberalisation has turned strategic goods into
commodities, changing the sector from selling kilowatt-hours or litres of
gasoline to selling energy services. With competition among suppliers, energy
companies will become increasingly active in providing energy services, which
may also include end-use
technologies.
Demand for energy services
The structure and size of the energy system are driven by the
demand for energy services. Energy services, in turn, are determined by driving
forces, including:
· Economic
structure, economic activity, income levels and distribution, access to capital,
relative prices, and market conditions.
· Demographics such as
population, age distribution, labour force participation rate, family sizes, and
degree of urbanisation.
· Geography, including climatic
conditions and distances between major metropolitan centres.
· Technology base, age of
existing infrastructure, level of innovation, access to research and
development, technical skills, and technology diffusion.
· Natural resource endowment and
access to indigenous energy resources.
· Lifestyles, settlement
patterns, mobility, individual and social preferences, and cultural mores.
· Policy factors that influence
economic trends, energy, the environment, standards and codes, subsidies, and
social welfare.
· Laws, institutions, and
regulations.
The structure and level of demand for energy services, together
with the performance of end-use technologies, largely determine the magnitude of
final energy demand. The amount of final energy per unit of economic output
(usually in terms of gross domestic product, or GDP), known as the final energy
intensity, is often used to measure the effectiveness of energy use and the
consumption patterns of different economies. Economies with a large share of
services in GDP and a large share of electricity in the final energy mix usually
have lower final energy intensities than do economies based on materials and
smokestack-based industries and fuelled by coal and oil. The final energy demand
mix, the structure and efficiency of energy supply (resource extraction,
conversion, transmission, and distribution), domestic resource availability,
supply security, and national energy considerations then determine primary
energy use.
Global primary energy use expanded by about 2 percent a year in
1970-98 (table 1.1). This growth rate fell to just under 1 percent a year in
1990-98 as a result of regional differences in socioeconomic development. First,
the severe economic collapse of transition economies in Eastern Europe and the
former Soviet Union reduced income by 40 percent and primary energy use by 35
percent between 1990 and 1998. Second, the rapid growth experienced by
developing countries in the 1980s slowed in the early 1990s and slowed even more
during the financial crisis of 1997-98. Third, among OECD regions, energy growth
exceeded the long-term global average only in Pacific OECD countries. In North
America, despite continued economic expansion and the availability of
inexpensive energy services throughout the 1990s, total energy use grew by just
1.4 percent a year (the same as the OECD average). If corrected for weak
economic performance in transition economies and the 1997-98 financial crisis,
global energy use would have continued to grow by 2 percent a year throughout
the 1990s.
Energy use by developing countries has increased three to four
times as quickly as that by OECD countries - the result of life-style changes
made possible by rising incomes and higher population growth. As a result the
share of developing countries in global commercial energy use increased from 13
percent in 1970 to almost 30 percent in 1998. On a per capita basis, however,
the increase in primary energy use has not resulted in more equitable access to
energy services between developed and developing countries. (Annex C provides
energy data and trends related to the discussion in this chapter, disaggregated
by country and region.)
In Africa per capita energy use has barely increased since 1970
and remains at less than 10 percent of per capita use in North America (annex
table C2). The same is true for Asia despite a near-doubling in per capita
energy use since 1970. In essence this means that most Africans and Asians have
no access to commercial energy. Latin America saw little improvement, while
China and especially the Middle East made above-average progress in providing
access to modern energy services. Energy use in non-OECD Europe and the former
Soviet Union has been affected by economic restructuring, which in the former
Soviet Union led to negative per capita growth in energy use between 1971 and
1997. Per capita energy use stayed nearly constant in North America, while
substantial growth occurred in the Pacific OECD.
TABLE 1.1. COMMERCIAL PRIMARY ENERGY USE BY REGION,
1970-98a
|
Region |
1970
(exajoules) |
1980
(exajoules) |
1990
(exajoules) |
1998
(exajoules) |
1998 as share of world total (percent) |
Annual growth rate, 1970-98 (percent) |
Annual growth rate, 1970-80 (percent) |
Annual growth rate, 1980-90 (percent) |
Annual growth rate, 1990-98 (percent) |
|
North America |
74.7 |
85.6 |
93.4 |
104.3 |
29.4 |
1.2 |
1.4 |
0.9 |
1.4 |
|
Latin America |
5.7 |
9.2 |
11.3 |
15.1 |
4.3 |
3.6 |
4.9 |
2.1 |
3.7 |
|
OECD Europeb |
51.6 |
61.9 |
66.5 |
70.1 |
19.7 |
1.1 |
1.8 |
0.7 |
0.7 |
|
Non-OECD Europec |
3.6 |
6.1 |
6.5 |
4.8 |
1.3 |
1.0 |
5.3 |
0.5 |
-3.8 |
|
Former Soviet Union |
31.8 |
47.2 |
58.5 |
37.5 |
10.6 |
0.6 |
4.0 |
2.2 |
-5.4 |
|
Middle East |
3.0 |
5.6 |
10.6 |
15.4 |
4.3 |
6.0 |
6.4 |
6.6 |
4.7 |
|
Africa |
2.9 |
5.6 |
8.9 |
11.0 |
3.1 |
4.8 |
6.6 |
4.8 |
2.7 |
|
China |
9.8 |
17.8 |
28.5 |
36.0 |
10.1 |
4.8 |
6.2 |
4.8 |
3.0 |
|
Asiad |
6.0 |
10.6 |
18.8 |
28.1 |
7.9 |
5.7 |
5.9 |
5.9 |
5.2 |
|
Pacific OECDe |
14.1 |
19.4 |
26.0 |
32.8 |
9.2 |
3.0 |
3.2 |
3.0 |
2.9 |
|
World total |
203.2 |
269.0 |
328.9 |
354.9 |
100.0 |
2.0 |
2.8 |
2.0 |
1.0 |
|
OECD countries |
140.4 |
166.9 |
185.9 |
207.2 |
58.4 |
1.4 |
1.7 |
1.1 |
1.4 |
|
Transition economies |
35.4 |
53.3 |
65.0 |
42.3 |
11.9 |
0.6 |
4.2 |
2.0 |
-5.2 |
|
Developing countries |
27.4 |
48.8 |
78.0 |
105.5 |
29.7 |
4.9 |
5.9 |
4.8 |
3.8 |
a. Excluding commercial biomass. b. Includes Czech
Republic, Hungary, and Poland. c. Excludes the former Soviet Union. d. Excludes
China. e. Australia, Japan, Republic of Korea, and New Zealand.
Source: BP, 1999.
Regional energy use is even more inequitable when viewed in
terms of per capita electricity use. The difference between the least developed
countries (83 kilowatt-hours per capita) and the OECD average (8,053
kilowatt-hours per capita) is two orders of magnitude (see annex table C.2).
The link between energy use and economic activity is neither
static nor uniform across regions. In the past, energy and economic development
were closely related. But this relationship does not necessarily hold at higher
levels of economic development. During 1960-78 changes in primary energy use and
GDP grew at the same rate in OECD countries (figure 1.1). Thereafter, a change
in elasticity between energy and economic activity suggests that the
often-postulated one-to-one relationship between primary energy use and economic
activity can be changed, at least temporarily. Because of its versatility,
convenience, cleanliness (at point of use), and productivity-enhancing features,
the increase in electricity use has outpaced GDP growth in all regions - often
by a large margin. In addition, the efficiency of converting electricity from
final energy to energy services is the highest of all fuels.
Energy transformation is the fastest-growing sector in all
countries except transition economies, generally followed by transportation.
Electricity generation dominates energy transformation, reflecting the continued
importance of electricity for economic development. Oil refining, coal
transformation (coking), gasworks, centralised heat production, transmission,
and distribution losses account for the rest of the energy used by energy
transformation.
Energy trade patterns and globalisation
The growing share of traded goods and services in gross world
product reflects a continued shift towards integrated global commodity markets.
This share approached 43 percent in 1996, up from 25 percent in 1960. The value
share of energy in trade peaked in 1979 at almost 14 percent, then fell to 3-5
percent in the 1990s.
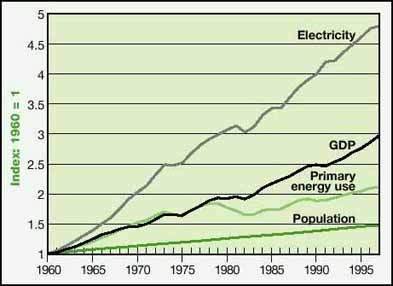
FIGURE 1.1. CHANGES IN GDP,
POPULATION, PRIMARY ENERGY USE, AND ELECTRICITY USE IN OECD COUNTRIES,
1960-97
Source: IEA, 1999.
Still, the world energy system has become more integrated, as
evidenced by the rising share of energy crossing borders before reaching final
consumers. Energy trade slipped to 40 percent of primary energy use in 1985
(down from 50 percent in 1970) but rebounded after the collapse in oil prices in
1986. By the end of the 20th century this share was approaching 55 percent.
The fast-growing Asian economies contributed significantly to
this increase. Their energy imports tripled between 1985 and 1997, reaching 13
percent of world energy imports. The share of OECD countries in global energy
trade dropped 6 percentage points thanks to stepped-up intraregional trade and
increased domestic production of oil (accounting for 13 percent of domestic oil
production in 1990, up from 6 percent in 1985) and gas (30 percent of domestic
gas production in 1985). OECD countries in Europe cut their share of global
imports from 25 percent in 1985 to 16 percent in 1997, while North America
doubled its share to 8 percent over the same period.
Global energy trade remains dominated by crude oil and oil
products. Despite steady growth in coal trade and accelerated penetration of
natural gas in the 1990s, the share of crude oil and oil products in trade only
fell from 90 percent in 1971 to 77 percent in 1997. While trade in coal, natural
gas, and even oil products expanded largely unaffected by world oil market
prices, trade in crude oil definitely responds - though with a lag - to market
price changes. Thus crude oil remains the world's swing fuel, with Middle
Eastern countries as the swing supplier despite the fact that the Middle East
has the lowest production
costs.
Crude oil and oil products
Developing countries have almost doubled their share of crude
oil and oil product imports since 1979. While other major importers such as
Western Europe and Japan have reduced or held steady their share of the global
oil trade, the U.S. thirst for oil has reached an all-time high, accounting for
25 percent of global oil trade. In 1998 some 46 percent of oil trade originated
in the Middle East - up from 38 percent in 1985. The region is on track to
regain market shares of well above 50 percent. Its low production costs (on
average, less than $5 a barrel) exposes investments in oil production capacity
elsewhere to above-average risks. It appears that Organisation of the Petroleum
Exporting Countries (OPEC) countries have regained their monopoly power lost in
1986, and can control oil market prices in either direction.
For importing countries, concerns about oil import dependence
and supply security appear to have given way to market forces and high
expectations that new exploration and development will bring new oil to the
market at a rate commensurate with demand. Moreover, in the wake of
globalisation and non-polarisation, quasi-open access to OPEC oil has
accelerated the shift of oil from a strategic good to a commodity, further
lowering supply security concerns.
Still, the world oil market remains fragile. In March 1999 OPEC
countries cut production by 85 million tonnes a year, or 2.5 percent of world
oil production. This was in addition to an earlier cut of 125 million tonnes. As
a result of strong world oil demand, including that from the rebounding Asian
economies and the surging U.S. economy, market prices almost tripled within
about a year. (World market prices for API Gravity 2 oil were $9.39 a barrel in
December 1998 and $27.55 a barrel in March 2000.)
The impact of oil market prices or of high dependence on oil
imports (or both) on the economies of several developing countries is shown in
figure 1.2. In several countries oil imports absorb a large share of export
earnings. The low oil market prices of the mid-1990s benefited these economies
relative to 1985 (the year before oil prices collapsed) and 1990 (when prices
soared during the Gulf war). The pattern for Haiti differs from those of the
other countries in figure 1.2. There the share of export earnings spent on oil
imports has more than doubled since 1985. The 1999 hike in oil prices will
likely absorb similar shares of export earnings as in 1985 and
1990.
Coal
World coal production runs about 4,500 million tonnes,
equivalent to some 2,230 million tonnes of oil equivalent (Mtoe), 210 Mtoe of
which corresponds to steam coal trade. In recent years coal exports have grown
by 4 percent a year. There is no indication that demand will outstrip supply in
the foreseeable future. Production capacity is well developed, and new market
entrants (Colombia, Kazakhstan, Russia, Venezuela) are eager to join the trade.
Over the past 20 years a quasi-unified coal market has emerged
in which the United States has assumed the role of marginal supplier. Indeed,
U.S. capacities are among the world's highest-cost supplies. Everything else
being equal, prices tend to gravitate towards the production costs of the
marginal producer. Because productivity advances determine the cost of U.S.
production, U.S. productivity levels determine the world price of coal.
FIGURE 1.2. OIL IMPORTS AS A SHARE
OF EXPORT EARNINGS IN VARIOUS DEVELOPING COUNTRIES, 1985-97
Source: World Bank, 1999.
|
Since 1990 electricity rates have
declined steadily,
especially in
countries where electricity market
deregulation has
been
or is about to be
introduced. |
Natural gas
Unlike oil and coal markets, natural gas has yet to play a
significant role in global markets. Some 20 percent of global gas crosses
borders before reaching final consumers. About 75 percent of that gas is traded
by pipe between essentially neighbouring countries. Hence natural gas trade has
developed primarily at the regional level or between adjacent regions. Pipeline
transmission is capital-intensive and allows little flexibility in the choice of
buyers and sellers. Still, pipeline gas is traded between production and
consumption sites more than 4,000 kilometres apart. Three major regional gas
trade markets have emerged:
· The almost fully
integrated North American market, characterised by accelerated growth of
Canadian exports to the U.S. market (from 26 Mtoe in 1990 to 79 Mtoe in 1998).
There have also been minor exchanges between Mexico and the United States.
· The European market, with the
following principal suppliers: the former Soviet Union (with a pipeline
producing 108 Mtoe in 1998), Norway (pipeline producing 38 Mtoe), and the
Netherlands (pipeline producing 33 Mtoe), and Algeria with minor liquefied
natural gas supplies from Libya (pipeline and liquefied natural gas producing 47
Mtoe). Gas trade expanded by 2.7 percent a year in 1990-98.
· The Asian gas market is
dominated by liquefied natural gas (which increased from 47 Mtoe in 1990 to 77
Mtoe in 1998). The main suppliers are Indonesia, Malaysia, Australia, Brunei,
the United Arab Emirates, and Qatar. Japan, the Republic of Korea, China, and
Taiwan (China) are the main customers.
A gas market has also begun to develop in Latin America, with
exports from Bolivia to Argentina and Argentina to
Chile.
Energy prices and taxes
Energy prices influence consumer choices and behaviour and can
affect economic development and growth. High energy prices can lead to
skyrocketing import bills, with adverse consequences for business, employment,
and social welfare. Energy exporters benefit from high energy prices. High
energy prices also stimulate exploration and development of additional
resources, foster innovation, and encourage efficiency improvements.
While some impacts of energy prices are fairly steady, others
are more transient. For example, higher absolute prices have had little impact
on economic development in Japan and OECD countries in Europe relative to the
much lower prices in the United States and some developing countries. The price
hikes of the 1970s affected economic growth in all energy-importing countries,
however. Thus it appears that economies are more sensitive to price changes than
to price levels. But even price changes appear not to cause the turbulence of
the past. The recent near-tripling in world oil market prices has, at least in
OECD countries, not yet had any impact on economic development.
Energy prices, which include taxes, must be clearly
distinguished from costs, average costs from marginal costs, and contract
markets from spot markets. Two types of exchange modes - contract markets and
spot markets - prevail in most major energy markets. Contracts are long-term
trade agreements between exporters and, in the case of oil, refineries.
Contracts account for about 80 percent of traded oil. The prices associated with
these contracts are usually not disclosed. Contract prices are quasi-fixed for
the contract period but include certain adjustment mechanisms that account for
major market changes.
The remaining 15-20 percent of international oil is traded in
spot markets. Spot sales are more or less instantaneous sales of entire cargoes.
Initially, spot market transactions served as a mechanism to clear markets for a
small share of production that was not contracted or became available for other
reasons - say, seasonal market fluctuations. The spot market has since become
the principal mechanism for setting oil prices as well as an essential
ingredient for managing risk.
Steam coal prices are less volatile than oil, which is one
reason coal remains a popular fuel for electricity generation. In addition, coal
can be significantly cheaper than natural gas and oil. While internationally
traded energy prices are an important factor in the approximately $450 billion
business (at $20 a barrel), the energy bills presented to users are considerably
higher than the trade prices because most countries tax energy use. In general,
OECD taxes on residential energy use are higher than those on industry. In some
developing and transition economies taxes are higher for industry, usually as a
cross-subsidy to provide energy services to the poor. Energy taxes and subsidies
are an important tool for governments pursuing energy development objectives.
Since 1990 electricity rates have declined steadily, especially
in countries where electricity market deregulation has been or is about to be
introduced. Market liberalisation has a more profound impact on the electricity
rates of industry than of households. Prices for light oil at the national level
largely mirror movements in the global market price for oil. Light oil prices
are much lower in India and other developing countries than in OECD countries,
reflecting government
subsidies.
Energy investments
Capital investment is a prerequisite for energy development.
Energy system development and structural change are the results of investments
in plants and equipment as well as in energy system infrastructure. Difficulties
in attracting capital for energy investments may impede economic development,
especially in the least developed countries. Although energy investments account
for only a small share of the global capital market, the provision of the
capital required to finance the growing needs of the energy sector cannot be
assumed, especially in developing countries.
|
Market size and product mobility
often favour investments
in oil
exploration and development
over, for example, natural gas
or
energy efficiency. |
General features
The challenges of raising funds for energy investments include
the perceived risk to investors and the uncertainty on rates of return. Returns
on energy investments do not always compare well to those on other
infrastructure investments. During 1974-92 electricity projects supported by the
World Bank achieved average rates of return of 11 percent a year - while returns
to urban development projects were 23 percent and to transport projects, 21
percent (Hyman, 1994). Also important is the allocation of funds within the
energy sector. Rate of return considerations discriminate against small-scale,
clean, and innovative energy supplies and against investments in energy
efficiency. Market size and product mobility often favour investments in oil
exploration and development over, for example, natural gas or energy efficiency.
Investments in energy plants, equipment, and infrastructure must
be viewed in the context of economic growth, savings, and the size and degree of
liberalisation of capital markets. The current average global savings rate is
about 22 percent of GDP - 21 percent in developed countries and 24 percent in
developing countries. In transition economies recent declines in GDP have been
matched by reduced savings, keeping the savings rate at about 20 percent (World
Bank, 1999). Although energy investments as a share of total investments vary
greatly among countries and between stages of economic development, an average
of 1.0-1.5 percent of GDP is invested in energy. This share is expected to
remain relatively stable.
Thus current energy investments amount to $290-430 billion a
year. But such investments do not include investments in end-use devices and
appliances, energy efficiency improvements in buildings, and so on. Including
these investments doubles capital requirements.
Energy investments have long lives. Investments in electricity
generating plants, refineries, and energy-related infrastructure made in the
next 10 years will likely still be in operation in 2050 and beyond. Hence there
is a fair amount of inertia with regard to the rate of change that can be
introduced in the energy system. For example, the current global average
conversion efficiency for coal-fired electricity generation is 34 percent and
for gas-fired electricity generation, 37 percent. The best commercially
available coal and gas power plants have much higher efficiencies: 43-48 percent
for coal and 55-60 percent for natural gas.
Given the longevity of the existing capital stock, it is
unlikely that the global average will reach, say, 45 percent for coal-fired
electricity by 2050 unless the most efficient plants are adopted universally.
But most efficient does not always mean least cost - low-cost domestic coal can
be burnt more economically in a medium-efficient plant than in a high-efficient
but more capital-intensive alternative.
The efficiency of electricity generation also varies widely
among regions. The Middle East introduced coal for electricity generation in the
early 1980s and, because most coal is imported, adopted the latest coal
combustion technology. As a result the region's average conversion efficiency
exceeds that of OECD countries. Another aspect affecting efficiency is the
introduction of sulphur and nitrogen oxide abatement equipment, which tends to
reduce efficiency (as in Asia and
Africa).
Capital flows
The globalisation of economic production has led to an
acceleration of capital flows. Indeed, capital markets have been growing faster
than GDP for some time, and this trend is unlikely to change. Annual global
energy investments account for about 7 percent of international credit
financing, which is about $3.6 trillion (Hanke, 1995). With capital markets
growing relative to GDP, and assuming relatively stable future energy investment
ratios, capital market size does not appear to be a limiting factor for energy
sector finance.
Scarce public funds, especially in developing countries, are
sought by many needy projects ranging from rural development, education, and
health care to energy supply. Because energy supply, more than any other
alternative, is often seen as more readily capable of generating revenues early
on, energy investments are increasingly viewed as a private sector affair. Yet
private funds are not flowing into most developing countries.
Foreign direct investment approached $400 billion in 1997, up
from $50 billion in 1984, and accounted for 1.8 percent of OECD GDP (up from 0.6
percent in 1984; figure 1.3). Foreign direct investment in energy projects is
estimated at 5-15 percent of the total (Victor, 2000). Foreign direct investment
is generally commercially motivated, with the sponsor of investments expecting
not only to recover the initial capital but also counting on competitive
returns. This cannot always be guaranteed in developing countries with
potentially fragile governments or the absence of free markets. Indeed, 25
countries received 89 percent of global foreign direct investment in 1996, and
only 10 of these are developing countries - none are among the 47 least
developed countries. Brazil, China, and Mexico are the only developing countries
to receive more than 2 percent of the world total.
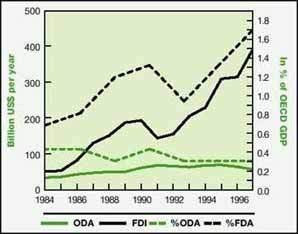
FIGURE 1.3. FOREIGN DIRECT
INVESTMENTS AND OFFICIAL DEVELOPMENT ASSISTANCE, 1984-97, IN US$ AND AS SHARE OF
OECD GDP
Source: World Bank, 1999.
In contrast to foreign direct investment, official development
assistance is meant as development aid in the form of grants. Official
development assistance increased from $34 billion in 1984 to $69 billion in 1995
but slipped to $56 billion in 1997, or 0.25 percent of OECD GDP - a far cry from
the 0.7 percent target agreed to by developed countries (see figure 1.3).
Against these recent developments in international financial and
capital flows, prospects for financing energy projects in developing countries
generally look bleak. Most foreign investors lack confidence in the ability of
developing country energy projects to provide stable (and competitive) returns
until the investment has been recovered. Hence, until the economic risk to
foreign investors can be eliminated (through deregulated energy and financial
markets, steady revenue generation through bill collection, firm policies on
profit transfers, and the like), developing countries will have to continue to
finance their energy development from domestic savings.
References
Ayres, R.U. 1989. Energy Inefficiency in the US Economy: A
New Case for Conservation. RR-89-12. International Institute for Applied
Systems Analysis, Laxenburg, Austria.
BP (British Petroleum). 1999. BP Statistical Review of World
Energy. London.
Gilli, P.-V., N. Nakicenovic, and R. Kurz. 1995. "First- and
Second-Law Efficiencies of the Global and Regional Energy Systems." Paper
presented at the World Energy Council's 16th Congress, 8-13 October, Tokyo.
Hanke, T. 1995. "Die Mäerkte spielen verrüeckt." Die Zeit
18: 33.
Hyman, L. S. 1994: "Financing Electricity Expansion." World
Energy Council Journal (July): 15-20.
IEA (International Energy Agency). 1999. Energy Balances.
Paris: Organisation for Economic Co-operation and Development.
IMF (International Monetary Fund). 1998. International
Financial Statistics (May). Washington, D.C.
Nakicenovic, N., L. Bodda, A. Gruebler, and P.-V. Gilli. 1990.
"Technological Progress, Structural Change and Efficient Energy Use: Trends
Worldwide and in Austria." International part of a study supported by the
Öesterreichische Elektrizit¨aetswirtschaft AG and International Institute
for Applied Systems Analysis, Laxenburg, Austria.
Olivier, D., and H. Miall. 1983. Energy Efficient Futures:
Opening the Solar Option. London: Earth Resources Limited.
Schaeffer, R. and R. M. Wirtshafter. 1992. "An Exergy Analysis
of the Brazilian Economy: From Energy Product to Final Energy Use." Energy
17: 841-61.
Victor, D. 2000. Private communication. Council of Foreign
Relations, 9 March, New York, NY.
Wall, G. 1990. "Exergy Conversion in the Japanese Society."
Energy 15: 435-44.
Wall, G., E. Scuibba, and V. Naso. 1994. "Exergy Use in the
Italian Society." Energy 19: 1267-74.
WCED (World Commission on Environment and Development). 1987.
Our Common Future. Oxford: Oxford University Press.
World Bank. 1999. World Development Indicators 1999
CD-ROM. Washington,
D.C.
Chapter 2. Energy and Social Issues
Amulya K.N. Reddy (India)
LEAD AUTHORS: Wendy Annecke (South Africa), Kornelis Blok
(Netherlands), David Bloom (United States), Brenda Boardman (United Kingdom),
Anton Eberhard (South Africa), Jamuna Ramakrishna (India), Quentin Wodon
(Belgium), and Anita Kaniz Mehdi Zaidi (United Kingdom and
Pakistan)
|
ABSTRACT
Poverty is the most fundamental reality of developing
countries - and the energy consumption patterns of poor people tend to add to
their misery and aggravate their poverty. A direct improvement in energy
services would allow the poor to enjoy both short-term and long-term advances in
living standards. Required are energy strategies based on increasing the use of
energy carriers other than biomass, or on using biomass in modern ways. Poverty
alleviation and development depend on universal access to energy services that
are affordable, reliable, and of good quality.
It has been noted that “poverty has a woman’s
face”. Energy and women are linked in many diverse ways, particularly
through the nature of the (predominantly biomass) energy resource base, the
characteristics of the household and community economy, the features of energy
policy, and the position of women in families and communities. Energy can be a
vital entry point for improving the position of women in households and
societies.
Many of today’s global problems arise from the
availability and use of natural resources, which depend on the size of the human
population putting pressure on them. But population is more than just an
external factor influencing energy consumption. Energy consumption patterns can
also influence population growth through their effect on the desired number of
births in a family and the relative benefits and costs of fertility.
Energy is linked to urbanisation through its implications for
land use, transportation, industry, construction, infrastructure, domestic
appliances and products, biomass consumption, and gender. Energy strategies can
be designed to improve the urban environment - particularly for transport,
industrialisation, mitigation of heat island effects, and construction.
Although energy devices (houses, vehicles, appliances) have
become much more efficient in industrialised countries, the number and use of
these devices have increased markedly. If appliances and their use (the material
basis of lifestyles) are taken as determinants of energy consumption, then
strategies can be devised based on reducing the number and use of
energy-intensive appliances.
Almost every industrialised country has poor and
disadvantaged populations. But the energy aspects of poverty are radically
different for industrialised and developing countries. Energy exacerbates
poverty in industrialised countries - for example, through the disconnection of
energy services or the absence in cold countries of universal affordable
warmth.
There are two-way linkages between energy and poverty, women,
population growth, urbanisation, and lifestyles. That is, these global issues
determine energy consumption, and energy systems influence the issues. Current
energy consumption patterns are aggravating these global issues, leading to
unsustainability. But energy can also help solve major global problems -
particularly those related to poverty, women, population growth, urbanisation,
and lifestyles. To realise this potential, energy must be brought to centre
stage and given the same importance as the other major global issues. |
Human society cannot survive without a continuous use, and hence
supply, of energy. The original source of energy for social activities was human
energy - the energy of human muscle provided the mechanical power necessary at
the dawn of civilisation. Then came the control and use of fire from the
combustion of wood, and with this, the ability to exploit chemical
transformations brought about by heat energy, and thereby to cook food, heat
dwellings, and extract metals (bronze and iron). The energy of flowing water and
wind was also harnessed. The energy of draught animals began to play a role in
agriculture, transport, and even industry. Finally, in rapid succession, human
societies acquired control over coal, steam, oil, electricity, and gas. Thus
from one perspective, history is the story of the control over energy sources
for the benefit of society.
Modern economies are energy dependent, and their tendency has
been to see the provision of sufficient energy as the central problem of the
energy sector. Indeed, the magnitude of energy consumed per capita became an
indicator of a country’s ‘modernisation’ and progress. Energy
concerns have long been driven by one simple preoccupation: increasing the
supply of energy. Over the past few decades, however, serious doubts have arisen
about the wisdom of pursuing a supply-obsessed approach. Attention is shifting
towards a more balanced view that also looks at the demand side of energy. But
access to, and the use of, energy continues to be a necessary and vital
component of development.
In the supply-driven approach, the appetite for energy often
exceeded the capacity of local sources of supply. The energy supplies of some
countries had to be brought from halfway round the world. Efforts to establish
control over oil wells and oil sea routes have generated persistent tensions and
political problems. This situation has also shaped national policies for foreign
affairs, economics, science, and technology - and influenced the political map
of the world. The security of energy supplies was a major geostrategic issue
throughout the 20th century.
At the same time, the magnitude and intensity of energy
production and use began to have deleterious impacts on the environment. By the
late 1960s the gravity of the environmental problems arising from toxic
substances had become clear. Awareness of the environmental issue of acid rain
followed. The problems of urban air pollution have been known for a long time.
Climate change discussions intensified in the mid-1970s. All these problems are
directly related to the quality and quantity of fuel combustion.
Then came the oil shocks of 1973 and 1979, along with price
increases that led to economic disruption at international, national, and local
levels. The oil shocks thrust the energy problem into the range of awareness of
individuals. Some oil-importing developing countries suffered serious balance of
payments problems, and in some cases landed in debt traps. The development of
indigenous fossil fuel resources and power generation faced the hurdle of
capital availability. And more recently, the accumulation of greenhouse gases in
the atmosphere resulting from energy consumption has focussed attention on the
threat of climate change, with the possibility of far-reaching consequences. In
parallel, the lack of control over energy resources has highlighted the
importance of national and local self-reliance (as distinct from
self-sufficiency).1
|
What human beings want
is not oil or coal, or even
gasoline
or electricity per se, but the
services that those
energy
sources provide. |
Thus, quite apart from the critical issues related to the supply
of fossil fuels, the political, social, and economic institutions dealing with
energy have failed to overcome a new series of grave problems - problems of
economics (access to capital), empowerment (self-reliance), equity, and the
environment. Many of the human-made threats to the species and the biosphere,
indeed to civilisation’s future, are energy-related. Awareness of the
energy dimensions of these issues has arisen more recently, but the underlying
energy bases of the issues are still imperfectly appreciated by decision-makers,
perhaps because this understanding has not been disseminated widely.
This chapter is devoted to the main linkages between energy and
social issues. It shows that energy strategies have impacts on major issues
related to poverty, women, population, urbanisation, and lifestyles. Data on
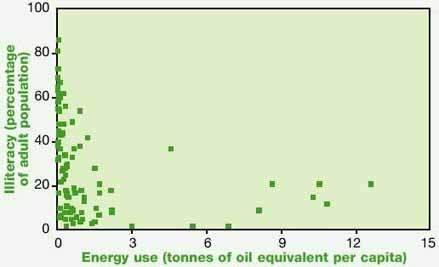
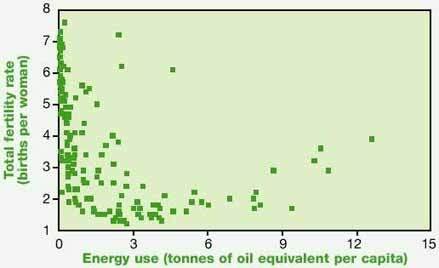
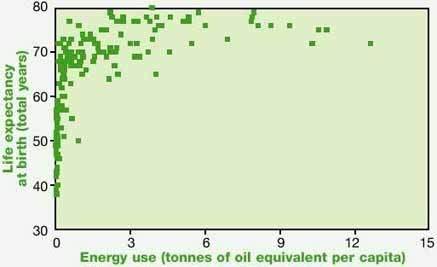
infant mortality, illiteracy, life expectancy, and total fertility as a function
of energy use are shown in figure 2.1, which is not meant to suggest that there
is a causal relation between the parameters represented.2
These linkages imply that energy has to be tackled in such a way
that social problems are at least not aggravated - which is what conventional
energy strategies tend to do, because they are so preoccupied with energy
supplies that they ignore these problems completely or deal with them
inadequately. Because of its linkages to social problems, energy can contribute
to their solution. Unfortunately, energy and the major problems of today’s
world are not being dealt with in an integrated way by national and
international
policy-makers.
Towards a new approach to energy for human uses
Another approach is called for: one that recognises that the
satisfaction of social needs by energy is best achieved by treating neither
energy supply nor energy consumption as ends in themselves. After all, what
human beings want is not oil or coal, or even gasoline or electricity per se,
but the services that those energy sources provide. Thus it is important to
focus on the demand side of the energy system, the end uses of energy, and the
services that energy provides.
In fact, one can identify a rather small set of the most
important of these energy services. They include the basic services of cooking,
heating, lighting, space conditioning, and safe storage of food. In addition,
the provision of clean water and sanitation, which is facilitated by energy,
affects public health in cities as well as rural areas. Societies also require
services such as transportation, motive power for industry and agriculture, heat
for materials processing (steel, cement, and so on), and energy for commerce,
communication, and other economic and social activities.
FIGURE 2.1a. COMMERCIAL ENERGY USE AND INFANT MORTALITY IN
INDUSTRIALISED AND DEVELOPING COUNTRIES
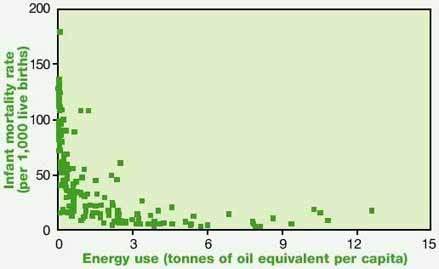
Figure
Figure
Figure
Figure
Note: Data on commercial energy use are for 1994;
data on social indicators are for 1995.
Source: World Bank, 1997.
The demand-side, end-use-oriented energy services approach
stresses another difference. The end user cares less about the original sources
or fuels used to provide the service than about crucial attributes of the final
energy carrier from a social standpoint. Among the most important attributes are
energy’s accessibility (particularly for the poor, women, and those in
remote areas), affordability, adequacy, quality, reliability, safety, and impact
(particularly on the immediate environment).
The traditional supply-side approach tends to forecast energy
demand on the basis of projections of past and present economic and demographic
trends. It tends to ignore the large variety of scenarios that are feasible
considering the opportunities and potentials offered by changes in energy
demand, improvements in energy efficiency, shifts from traditional energy
sources to modern energy carriers, and dissemination of new energy technologies.
To best serve humanity, the energy system should help achieve
the goals laid down at the 1992 United Nations Conference on Environment and
Development (the so-called Earth Summit) in Rio de Janeiro, and in other UN
contexts. These goals include the promotion of economically viable, socially
harmonious, environmentally safe, and strategically secure societies. Meeting
these goals requires five crucial components: economic efficiency, equity
(particularly for the poor, women, ethnic minorities, and those in remote
areas), empowerment or self-reliance, environmental soundness, and peace.
Together these components can be taken as some of the most essential measures of
sustainable development.
The Earth Summit led to greater awareness that development needs
to be sustainable if it is to serve humanity’s short- and long-term goals.
More than 150 governments committed themselves to the protection of the
environment through the Rio Declaration and Agenda 21. Government
representatives considered that key commitments related to energy would be
covered under the United Nations Framework Convention on Climate Change
(UNFCCC), which was signed on this occasion. Agenda 21 makes this important
statement:
Energy is essential to economic and social
development and improved quality of life. Much of the world’s energy,
however, is currently produced and consumed in ways that could not be sustained
if technology were to remain constant and if overall quantities were to increase
substantially. The need to control atmospheric emissions and other gases and
substances will increasingly need to be based on efficiency in energy
production, transmission, distribution and consumption, and on growing reliance
on environmentally sound energy systems, particularly new and renewable sources
of energy. (UN, 1993b, ch. 9.9)
The Framework Convention on Climate Change, which has been
ratified by 164 countries, defines an ecological target - without linking this
target to social impacts! - that implies the implementation of energy measures.
The Intergovernmental Panel on Climate Change (IPCC) also has presented
scientific assessments of data related to climate change and prospects for
inputs, adaptation, and mitigation of climate change and their relationship to
energy issues.
Since the Earth Summit many other initiatives have been taken at
various levels to promote sustainable energy through increased energy
efficiency, support for renewable energy sources, and integrated energy resource
planning. There are now good examples, significant benchmarks, and success
stories all around the world of efforts in these areas. But these efforts are
dispersed. Though they provide a good starting point, they cannot meet the
tremendous energy challenges facing humanity during the 21st century.
Energy issues tend to get sidelined in many international
forums. Such major global issues as poverty, women, population, urbanisation,
lifestyles, undernutrition, environment, economics, and security tend to get
higher priority than energy. But missing from most discussions of these issues
is the important linkage between each of them and global and local energy
systems. It is too little appreciated that achieving progress in these other
arenas can be greatly assisted by manipulation of energy systems.
Even when this linkage is mentioned, the discussion focuses on
how these global issues determine energy consumption patterns. Energy is treated
as the dependent variable. Very little attention is directed at understanding
whether current energy patterns are aggravating these issues, and almost no
attention is given to how alternative energy strategies can contribute to their
solution.
Thus a fresh conceptual framework is required. The framework
elaborated in this chapter, and depicted in figure 2.2, concerns the linkage
between energy, on the one hand, and poverty, women, population, urbanisation,
and lifestyles, on the other.3
The linkage between energy and food security is also crucial,
particularly because it concerns the important social problem of undernutrition
that is so widespread and serious, especially in developing countries. Despite
this, the energy-undernutrition dimension is not addressed in this chapter,
primarily because of space considerations. Moreover, the energy-undernutrition
link has been treated adequately in other contexts, particularly in Energy
after Rio: Prospects and Challenges (UNDP, 1997a), which explains how energy
strategies can play a powerful role in increasing the supply of food as well as
building an environment in which food is absorbed more effectively.
|
Indoor air pollution is a major
by-product of the
traditional use of
biomass, which diminishes the quality
of life,
especially for women
and young children. |
As humankind enters the new millennium, it is important to
highlight energy’s critical relationship to major global problems. The
timeliness of the challenge derives from three critical elements that are
converging to make the world thirstier for energy services: aspirations for a
higher living standards, booming economies in large regions, and population
growth.
The assessment that follows draws together a number of diverse
elements that are relevant to sustainable development, and for which issues of
supply and demand of energy are significant. It goes on to show new options for
using energy more efficiently, and also how both renewable and fossil sources of
energy can be used in cleaner, more efficient ways to help create a more
sustainable future. In fact, the global goal for energy can be stated very
simply: sustainable development of the world. Energy services therefore are a
necessary condition for sustainable
development.
Energy and poverty in developing countries
Poverty is the most fundamental reality of developing
countries.4 Poverty refers to an individual’s (or family’s)
lack of access - associated primarily with inadequate income - to basic human
needs such as food, shelter, fuel, clothing, safe water, sanitation, health
care, and education. Poverty is manifested as the inability to achieve a minimum
standard of what is needed for material well-being. Human poverty also entails
the denial of opportunities and choices most vital to human development -
including a long, healthy, creative life, a decent standard of living, dignity,
self-esteem, the respect of others, and the things that people value in
life.
Dimensions of poverty
Poverty is usually conceptualised and measured in terms of the
proportion of people who do not achieve specified levels of health, education,
or body weight. Operationally, however, poverty standards are typically
expressed in a single dimension: the monetary resources that would enable an
individual to consume either a fixed bundle of basic goods and services
(absolute poverty5), or a fraction of the bundle of goods and
services that a reference group is able to, or actually does, consume (relative
poverty).
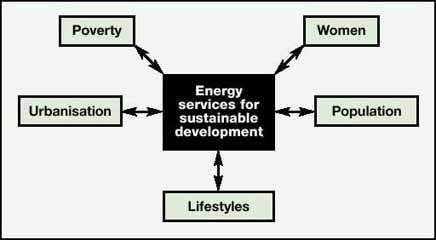
FIGURE 2.2. ENERGY AND SOCIAL
ISSUES
UNDP’s human poverty index goes beyond mere income poverty.
It measures deprivation in three essential dimensions of human life: longevity
(or vulnerability to death at an early age), knowledge (access to reading and
communication), and a decent standard of living in terms of overall economic and
social needs (percentage of people without access to safe water and health
services and the percentage of underweight children under five).
Whether measured directly with a range of indicators of basic
human outcomes, or indirectly with a single monetary dimension, poverty is
indisputably among the world’s largest, most urgent, and most fundamental
problems. Its pervasiveness - as revealed by the extent to which elementary
minimum needs are not satisfied - is undeniable. Whether food, shelter, health,
education, or employment is considered, living standards of the majority in most
developing countries are pathetically low. They represent a full-time struggle
for survival - a type of existence largely unknown, and perhaps even
unimaginable, in industrialised countries. This struggle is quite apart from
associated psychological reactions of deprivation and feelings of hopelessness
and social disempowerment, often accompanied by deep feelings of personal need.
In perhaps the most ambitious and careful attempt yet undertaken
to measure absolute poverty in developing countries, it has been estimated that,
as of 1993, roughly 1.3 billion people in developing countries - 30 percent of
their total population - consumed less than $1 a day worth of goods and
services.6
Statistics on the inability of people in developing countries to
satisfy basic human needs corroborate the enormous scale of poverty and
highlight its breadth and complexity. For example, an estimated 20 percent of
people in developing countries do not have access to health services, 30 percent
lack access to safe water, and 61 percent lack access to sanitation (UNDP,
1996). And infant and child mortality rates in developing countries are more
than 5 times higher than in industrialised countries, the proportion of children
below age five who are underweight is 8 times higher, the maternal mortality
rate is 14 times higher, and the proportion of births not attended by trained
health personnel is 37 times higher.
Significant and widening disparities in human development and
poverty are also found within countries between the rich and the poor, between
rural and urban areas, between regions, between different ethnic groups, and
between women and men. And income and development inequalities are greater
within developing countries than within industrialised OECD countries. The
richest 10 percent account for nearly half of national income or consumption in
Brazil and South Africa. In contrast, the richest 10 percent in countries such
as Germany, Japan, Norway, Switzerland, and the United States account for about
25 percent of their country’s national income and spending. Industrialised
countries not only have higher human development and lower poverty indexes; they
are also more equitable than developing countries. But there has been overall
progress in human development over the past 30 years, as indicated by an
examination of measures such as UNDP’s Human Development Index (HDI). On
average, a child born in a developing country today can expect to live 16 years
longer than a child born in 1970. Adult literacy rates since then have increased
by nearly half (UNDP, 1998).
|
Because efficient devices tend to have
higher first costs,
the poor invariably
end up with less efficient devices
that consume more
energy
for a given level
of service. |
Yet these favourable aggregate trends mask slow progress or even
setbacks in many countries, especially among the poorest people. For example,
life expectancy in Africa is still 20 years lower than in East Asia or Latin
America and the Caribbean. And adult literacy rates in South Asia (51 percent)
are shockingly lower than in Southeast Asia (90 percent) or in nearly all
industrialised countries (UNDP, 1998).
The alleviation, if not eradication, of poverty is among the
world’s largest, most urgent, and most fundamental challenges - and not
merely for humanitarian reasons. Societies with grave inequalities and
disparities tend to be unstable. Large populations below the poverty line are
explosive material for social upheavals. Thus poverty has politically
unsustainable characteristics. It merits urgent consideration and immediate
action.
The energy-poverty nexus
Energy services are a crucial input to the primary development
challenge of providing adequate food, shelter, clothing, water, sanitation,
medical care, schooling, and access to information. Thus energy is one dimension
or determinant of poverty and development, but it is vital. Energy supports the
provision of basic needs such as cooked food, a comfortable living temperature,
lighting, the use of appliances, piped water or sewerage, essential health care
(refrigerated vaccines, emergency and intensive care), educational aids,
communication (radio, television, electronic mail, the World Wide Web), and
transport. Energy also fuels productive activities, including agriculture,
commerce, manufacture, industry, and mining. Conversely, lack of access to
energy contributes to poverty and deprivation and can contribute to economic
decline.
The energy dimension of poverty - energy poverty - may be
defined as the absence of sufficient choice in accessing adequate, affordable,
reliable, high-quality, safe, and environmentally benign energy services to
support economic and human development. The numbers are staggering: 2 billion
people are without clean, safe cooking fuels and must depend on traditional
biomass sources; 1.7 billion are without electricity. Increased access to such
energy services will not, in itself, result in economic or social development.
But lack of adequate energy inputs can be a severe constraint on development.
Universally accessible energy services that are adequate, affordable, reliable,
of good quality, safe, and environmentally benign are therefore a necessary but
insufficient condition for
development.
The energy ladder and household decisions about fuel choice
Poor people tend to rely on a significantly different set of
energy carriers than the rich. The poor use proportionately more wood, dung, and
other biomass fuels in traditional ways, and less electricity and liquefied
petroleum gas (LPG). To illustrate this point, evidence from Brazil is shown in
figure 2.3.
The observation that roughly 2 billion people depend mainly on
traditional fuels for cooking is significant in part because indoor air
pollution is a major by-product of the traditional use of biomass. This
pollution diminishes the quality of life, especially for women and young
children.
Households use fuel for a variety of activities, including
cooking, water heating, lighting, and space heating. Different energy carriers
can be used for each of these activities. For instance, firewood, dung,
charcoal, coal, kerosene, electricity, and LPG can be used for cooking; and
kerosene and electricity for lighting.
These carriers (for a particular activity) form what is commonly
referred to as an ‘energy ladder’ for that activity. Each rung
corresponds to the dominant (but not sole7) fuel used by a particular
income group, and different income groups use different fuels and occupy
different rungs (Hosier and Dowd, 1987; Reddy and Reddy, 1994). Wood, dung, and
other biomass fuels represent the lowest rung on the energy ladder for cooking.
Charcoal and coal (when available) and kerosene represent higher steps up the
ladder to the highest rungs, electricity and LPG.
The ordering of fuels on the energy ladder also tends to
correspond to the efficiency of the associated systems (the fraction of energy
released from the carrier that is actually used by the end-use device) and their
‘cleanliness’. For example, the cook-stove efficiencies of firewood
(as traditionally used), kerosene, and gas are roughly 15, 50, and 65 percent,
respectively. As one proceeds up the energy ladder, the emission into the air of
carbon dioxide, sulphur dioxide, and particulates also tends to decline.
Households seem to make choices among energy carrier options on
the basis of both the household’s socioeconomic characteristics and
attitudes and the attributes of alternative carriers. Income is the main
characteristic that appears to influence a household’s choice of carrier
(Leach, 1992; Reddy and Reddy, 1994).
Relevant attributes of energy carriers include accessibility,
convenience, controllability, cleanliness, efficiency, current cost, and
expected distribution of future costs. Because different fuels require different
appliances - stoves, lamps, and so on - with varying costs and durability, fuel
costs have both fixed and variable components.
The importance of this distinction between fixed and variable
costs is magnified by three factors: the presence of quasi-fixed costs, such as
fixed monthly charges for a natural gas or electricity hookup; the need to make
large ‘lumpy’ purchases of some fuels, such as tanks for storing
propane gas; and the need to make sometimes sizeable security deposits, either
to guarantee the payment of monthly bills or the return of equipment such as LPG
cylinders or canisters. Despite the fact that they are refundable, security
deposits impose a present cost on households, the magnitude of which depends
upon the return on those funds in their next best use, or their
‘opportunity cost’.
The division of costs into fixed, quasi-fixed, and variable
components affects household decisions about fuel choice. The outcome of these
decisions depends on the household’s preparedness to forgo present
consumption for future benefits. The degree to which a household discounts
future benefits may be determined in part by its level of wealth and its
liquidity. Households may apply high discount rates to fuel consumption
decisions, because of the high cost of either diverting resources from other
uses or of borrowing funds to cover up-front capital costs. Thus they will tend
to prefer fuel carriers that involve lower up-front or first costs. Poor people
use much higher discount rates than the rich when making energy carrier
decisions (Reddy and Reddy, 1994). Lack of reliable income may force them to
think almost solely in terms of the first cost, rather than the life-cycle cost.
Because efficient devices tend to have higher first costs, the poor invariably
end up with less efficient devices that consume more energy for a given level of
service. Fuel costs may be determined either in a market or implicitly in terms
of the opportunity cost of time spent gathering the fuel, such as
firewood.
Energy strategies for alleviating poverty in developing countries
The poor pay more money, or spend more time for energy services,
than those who are better off. This has a powerful implication. The economic
hardship endured by poor households is understated when their income
(consumption expenditure) is evaluated in terms of its command over the basket
of goods and services purchased by households with average income or consumption
expenditures.
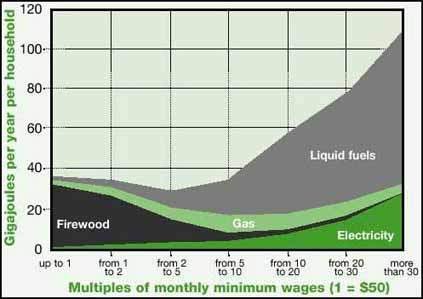
FIGURE 2.3. AVERAGE ENERGY DEMAND
BY INCOME SEGMENT IN BRAZIL, 1988
Source: De Almeida and de Oliveira,
1995.
Further, in many places, poor households could achieve the same
level of energy services at much less daily cost if they could move up the
energy ladder to LPG or electricity. Demonstration projects have shown that the
price that the poorest household is prepared to pay for electric lighting is
near the full cost because the alternative of kerosene lamps involves much
higher expenditures.
Substitution of energy carriers or devices that enable greater
efficiency would confer sizeable gains in purchasing power on poor urban
households. This analysis of the expenditure patterns of households in different
income groups suggests that such an increase in effective resources would be
devoted almost entirely to better satisfying basic needs for food, shelter,
clothing, health, education, and additional fuel. Thus cost-effective
improvements in energy efficiency have considerable potential to reduce poverty
in all of its key dimensions.
It appears that the energy consumption patterns of poor people
tend to add to their misery and aggravate their poverty for the following
reasons:
· Because the poor
pay more for daily energy needs, they are less likely to accumulate the wealth
needed to make the investments that are necessary to make use of cheaper and
more efficient fuels and appliances.
· The use of biomass compromises
the health of household members, especially when it is burned indoors without
either a proper stove to help control the generation of smoke or a chimney to
draw the smoke outside. Thus in addition to its relatively high cost, the use of
biomass fuel may promote higher medical care expenditures and diminish the
poor’s ability to work productively (chapter 3).
· Biomass also has deleterious
environmental consequences outside the household. These effects are reinforced
by the fact that biomass users are less likely to boil the water they drink, for
reasons of cost or custom. Insofar as the use of biomass in urban areas promotes
deforestation, reliance on biomass may also tend to increase its future cost,
further diminishing the living standards of the poor (Leach, 1992; Dasgupta,
1993).
The linkages between energy and poverty have implications for
strategies to alleviate poverty. The standard poverty alleviation strategies of
macroeconomic growth, human capital investment, and wealth redistribution do not
directly address the energy-poverty nexus in developing countries. If patterns
of energy use among the poor depress their nutrition, health, and productivity,
the poor are likely to absorb the benefits of economic growth only very slowly.
Education will continue to increase their earning capacity, but by less when
kerosene rather than electricity is the main illuminant, when lighting is poor,
and when access to knowledge though radio and television is limited. The
situation is worsened when traditional biomass is the dominant cooking fuel:
school attendance flags because of the burden of collecting it and the
respiratory illness caused by cooking with it.
|
Dramatic increases in
living standards in
developing
countries can theoretically be
achieved with small inputs
of
energy. |
In contrast, strategies that, in addition to standard poverty
alleviation strategies and rural development, include direct improvement of
energy services allow the poor to enjoy both short-term and self-reinforcing
long-term advances in their living standards. Such strategies should promote
increased use of energy carriers other than biomass, or use of biomass in modern
ways.
In fact, this approach suggests that major advances in poverty
alleviation can be achieved with relatively small inputs of energy, as evidenced
from the so-called 1 kilowatt per capita scenario (Goldemberg and others, 1985).
This scenario was based on a ‘thought experiment’ in which the
following question was explored: If all developing countries achieved a level of
energy services comparable to that of Western Europe in the 1970s,8
and if they deployed the most efficient energy technologies and energy
carriers available in the 1980s, what would be the per capita energy consumption
corresponding to this vastly improved standard of living?
The surprising answer was that, provided that the most
energy-efficient technologies and energy carriers available are implemented, a
mere 1 kilowatt per capita - that is, a 10 percent increase in today’s
energy per capita - would be required for the populations of developing
countries to enjoy a standard of living as high as that of Western Europe in the
1970s. In other words, dramatic increases in living standards in developing
countries can theoretically be achieved with small inputs of
energy.9
Energy and poverty in industrialised countries
Almost every industrialised country has its poor and
disadvantaged, but the energy aspects of their poverty are radically different
from those for developing countries. The poor in industrialised countries are
not energy poor in an absolute sense. Indeed, the direct use of energy by the
poor in the United States for homes and automobiles is 1.65 times the average
use in developing countries for all purposes, including the indirect use of
energy for industrial and commercial purposes and public transportation. The
high energy expenditures of the poor relative to those in developing countries
are also not an indicator of affluence. These expenditures are essential to meet
basic needs in the industrialised country context. The poor in industrialised
countries consume much more energy than their counterparts in developing
countries because of the much wider use of energy-intensive technologies.
Despite this apparent energy affluence of the poor in
industrialised countries relative to the masses in developing countries, their
economic plight cannot be ignored. The poor in industrialised countries spend a
larger fraction of their income on energy relative to the average. Energy
patterns clearly exacerbate poverty in industrialised countries - just as they
do in developing ones. This linkage is not taken into account in conventional
energy planning and policy-making. Rather, conventional energy strategies adopt
the ‘energy trickle-down’ approach to social welfare and implicitly
assume that if energy supplies are increased, these problems will take care of
themselves. In industrialised countries the problem is not that the poor do not
have access to enough energy to satisfy their needs, but rather that their
circumstances require them to consume too much energy and therefore to spend too
large a fraction of their income on it. If they cannot meet this expenditure,
their access to energy is disrupted.
An alternative energy strategy is needed that addresses the
energy-poverty link in industrialised countries and makes the poor less
vulnerable to the high costs of energy. The most promising approach is to make
available to the poor more energy-efficient technologies for space heating,
household appliances, and transportation services.
A central challenge for many developing countries is the
expansion of access to electricity for the poor. In contrast, maintaining access
is the critical issue in some medium-income countries and economies in
transition, as well as in OECD countries. The uninterrupted availability of
access to vital energy services is particularly important to the poor,
highlighting the health and other hazards associated with the lack of heating
and light. Disconnection can be life-threatening. It is part of the general
question of how the poor should be protected during the liberalisation and
privatisation that are sweeping electric utilities around the world. There is
increasing recognition of the importance of dealing with material hardship (lack
of access to energy) rather than just income poverty in both industrialised and
developing
countries.
Energy and women
Poverty has a woman’s face. Of the approximately 1.3
billion people living in poverty, 70% are women. (UNDP, 1997a. p. 12)
Compared to men, women in developing countries spend long
hours working in survival activities...[This] time spent...is largely invisible
in current methods of reporting energy patterns and statistics. (UNDP,
1997a, p. 15)
In developing countries, biomass accounts for about one-third
of all energy and nearly 90% in some of the least-developed countries. About two
billion people rely mainly or exclusively on traditional fuels (mostly biomass)
for their daily energy needs. (UNDP, 1997a, pp. 36-37)
Human energy conservation must be central to any energy
strategy, as it is a major component of energy used at the domestic level. The
traditional division of labour allocates most tasks to women in the household.
(Viklund, 1989, p. 10)
Energy and women are linked in many diverse ways.10
These linkages vary spatially, over time, across classes, between urban
and rural areas, and between countries. Some of these variations are common to
women, men, and children of a given era, class, or country. But certain features
of the relationship between energy and women are worth
considering.
Factors determining energy-women linkages
Four main factors influence the nature of linkages between
energy and women: the nature of the (energy) resource base, the characteristics
of the household and community economy, the features of energy policy, and the
position of women in families and communities.
Resource base. The survival and lives of most people in
the developing world depend on the biomass resource base, rather than on coal,
oil, or nuclear energy. Their consumption of energy (other than human energy and
animate energy sources) is for survival needs, primarily cooking. For these
needs, most people depend on biomass sources such as fuelwood, crop residues,
and animal dung.
But this biomass resource base is being degraded.11
As a result, in the course of a single generation, the time and effort
required to meet minimum household energy needs have increased. Because many
households rely on biomass fuels that are gathered or received as payment for
services rendered, national energy accounts tend to under-represent the
importance of biomass fuels as energy sources.
Likewise, labour and human investment (contributed primarily by
women) added to this resource base are not fully understood or recognised. In
fact, only fairly recently has it become accepted that deforestation in most
areas is not caused by household use of fuel-wood. Nonetheless, the cost (human
effort and financial outlay) involved in securing household energy needs has
escalated to such an extent that many households have been forced to shift to
less efficient and less clean fuels. The health impacts on women and children of
exposure to high concentrations of particulate matter, carbon monoxide, and
hundreds of other pollutants emitted when biomass fuels are burned have been
investigated and documented in some depth during the past 20 years (see chapter
3).
Household and community economy. Energy choices depend on
the extent to which the local economy is based on subsistence agriculture or on
raising livestock. A further issue is the degree of monetisation of the economy,
and whether wages are paid in cash or in kind - for instance, in grain or, more
pertinently, in crop residues. Each of these variables may influence the choices
made - whether fuel is gathered or bought, whether improved (more efficient and
less polluting) stoves are adopted, and what type of fuel is used.
Like the resource base, the local economy is dynamic,
particularly now that macroeconomic factors are bringing about vast changes in
microeconomies. These factors will determine the disposable income of
households, as well as the opportunity costs of depending on the labour and time
of women and children to supply household energy needs.
Energy policy. The linkages between women and energy are
also shaped by the prevailing energy policy, especially its degree of
sensitivity to the needs and priorities of (rural) women. Particularly in many
developing countries, energy policy is designed in such a way that energy
resources are not equally available to all. Industrial, commercial, urban, and
male users receive priority service and attention in energy policies. At the
bottom of the list are agricultural, domestic, rural, and female users. The
structure and functioning of the energy sector also cater to those in the
favoured categories.
The effect of these biases and predilections is evident in the
rural areas of most developing countries. Even well-intentioned initiatives such
as rural electrification often begin and end with a ‘pole in every
village’. Few affordable, viable options have been developed for the
domestic sector, where much of women’s work occurs.
Position of women in families and communities. One can
see evidence in many places of a highly degraded biomass energy resource base.
Yet investments to improve kitchens, stoves, and cooking fuels either do not
figure in the hierarchy of household expenditures or appear very low on the
list. Why?
A partial answer is that the livelihoods of people living in
such environments are also under threat. In other words, they have other, even
more urgent priorities. But another and crucial part of the answer is related to
the position of women in families and communities.

FIGURE 2.4. WOMEN’S SHARE OF
WORLD OUTPUT, 1993 (TRILLIONS OF U.S. DOLLARS)
Source: De Almeida and de Oliveira,
1995.
The four factors discussed here - the energy resource base, the
local economy, energy policy, and the position of women in families and
communities - are closely connected. But the last of these factors is perhaps
more fundamental than the others. It is a root cause, the reason it is necessary
to study linkages not only between women and energy but also between women and a
range of productive assets and social services. Women, by virtue of their
position in society (or lack thereof), stand disadvantaged in decision-making
processes in family, community, and country, as well as in accessing productive
assets. Poor women in developing countries are doubly disadvantaged, while their
sisters in rural areas are triply disenfranchised. Two aspects of this
disenfranchisement that have particular bearing on the linkages between women
and energy deserve closer attention: the value assigned to women’s labour
and the value placed on women’s time.
· Valuing
women’s labour. Across cultures and economic rankings, women’s
work has been under-valued, sometimes to the extent that it has been rendered
invisible. This applies not only to women’s reproductive work and household
work but also to their immensely active participation in the so-called informal
sector of the economy. This under-valuation, in terms of what is included in the
UN System of National Accounts (SNA) and what is not, is similar in
industrialised and developing countries.12 In both cases only about
one-third of women’s work is taken into account. Two-thirds is left out.
Women’s contribution to world output is also under-valued,
and to a much greater extent (figure 2.4). According to published statistics,
world output in 1993 totalled $23 trillion. But this reflects only recorded
economic activity - and the unrecorded economic contributions of women are
almost 45 percent of this amount (UNDP, 1995).
Furthermore, women are under-paid relative to men for the same
tasks. Again, this applies both in industrialised and developing countries.
Women also shoulder the burden of household survival activities (cooking,
cleaning, collecting fuel and water, and caring for children, plus sometimes
raising kitchen gardens), all of which are largely unacknowledged. The result is
that across the globe, women work longer hours than men. One of the most
tangible linkages between women and energy is that the growing scarcity and cost
of cooking fuel have lengthened women’s workdays and made them more
arduous.
· Valuing women’s
time. Rural women in developing countries have been forced to become experts
at multitasking.13 Faced with impossible workloads and only their own
time and labour to fall back on, poor rural women have become very efficient at
managing time. These skills are not assigned any value in the labour market.
Even women often do not consider what they do as ‘work’. Though the
survival of the family - in literal as well as economic terms - may depend on
the skill with which a woman manages her household, she has little or no
economic decision-making power, and her time and her work have very low status.
Not only are the cash-earning activities of the male members of the household
given higher status, but even the leisure time of men may rank higher than the
work time of women (Nathan, 1997).
To summarise, many of the world’s women (roughly 400
million) rely on energy sources that are not part of the market economy in order
to fulfil their survival activities and household responsibilities. They often
depend on these sources for their economic activities as well. Women are more
vulnerable than men to environmental degradation, because there is often a
direct impact on their workload. They are also more likely to be directly
affected by increases in fuel prices and by scarcity. Often the only asset that
women can turn to in times of scarcity or high prices is their own bodies, their
own labour. This results not only in longer workdays but also in declining
health, nutrition, and a score of other ill effects. Apart from the overwhelming
importance of biomass energy, the role of human energy and particularly of
women’s energy must be recognised (chapter
3).
Specific concerns and priority areas
Health and sanitation. Thus there is a very direct link
between energy and women’s health. Most of the burdens placed by energy
scarcity are borne by women. Even where biomass energy is relatively easily
available, women feel the health impacts of having to collect fuelwood. These
impacts may range from cuts, falls, bites, and back injuries to sexual
harassment (Government of India, 1988). Often these problems are compounded by
having to haul water for the household as well.
Exposure to indoor air pollution is another well-documented
health risk associated with the use of biomass fuels in traditional stoves that
are little more than shielded fires in poorly ventilated kitchens (WHO, 1992).
Rural women and children in developing countries are most affected by this
pollution. The rural-urban differential in pollutant concentrations and
exposures is marked, as are differences between countries at different stages of
human development (figure 2.5). The urban-rural differential is reversed in
high-HDI countries, where exposures are higher due to the greater amount of time
spent indoors and due to building characteristics and materials.
Fuel scarcity has wider implications. Women may be forced to
move to foods that can be cooked more quickly or to eat more raw food. Such a
shift can have health repercussions for the whole family, especially children
(Batliwala, 1982; Ramakrishna, 1992).
An additional critical factor related to health is the lack of
sanitation in many rural areas of developing countries, which is directly
related to the difficulty of accessing clean water. There is an
energy-sanitation link here because energy often has to be used to lift
‘clean’ sub-soil water or to boil water to reduce the health risk from
contamination. The convenience of the water supply - for instance, the distance
to the source and the number of sources - correlates with the amount of water
used daily per capita. For most rural people in developing countries, the amount
of clean water available per capita is well below the minimum required for
maintaining sanitation. In addition, the supply of drinking water is highly
inadequate. As water drawers and carriers and household managers, women feel the
impact of water shortages most keenly. The availability, supply, and quality of
water could be greatly improved by increasing the amount of energy available for
these functions.
Environmental quality. Energy scarcity often relates
directly to environmental quality for households and for communities in general.
The implications of this relationship are particularly relevant for women.
Deteriorating environmental quality places greater burdens on women’s time
and labour. In addition, as mentioned above, women’s health and
productivity may be significantly undermined. This is only partly due to the
increased effort required to meet minimum household energy requirements.
|
Apart from the overwhelming
importance of biomass energy,
the
role of human energy and
particularly of women's energy
must be
recognised. |
Energy, after all, is only one of the inputs that women must
secure for survival. Water also becomes scarce with increasing environmental
degradation. In cases of severe environmental decline, male migration often
increases, as in Sub-Saharan Africa. In such circumstances women have to bear
the additional responsibility of heading households. A key intervention to
arrest or slow environmental degradation in many developing countries would be
to increase the energy options for poor rural women. In particular, the
potential of renewable energy sources has not been realised.
Economic activities. The linkages between women’s
economic activities and energy have two aspects. One is the strong correlation
between the time women have for economic activities and the time they have for
survival activities, including collecting and preparing cooking fuels. The other
is securing energy inputs for economic activities. The main point is that
women’s choices are often very restricted, and they do not have much margin
for error for the unforeseen. Given that most women, whether bakers, brewers, or
food processors, are small-scale producers whose businesses are frequently
biomass-energy intensive, both technology development and improved energy supply
could greatly enhance their productivity.
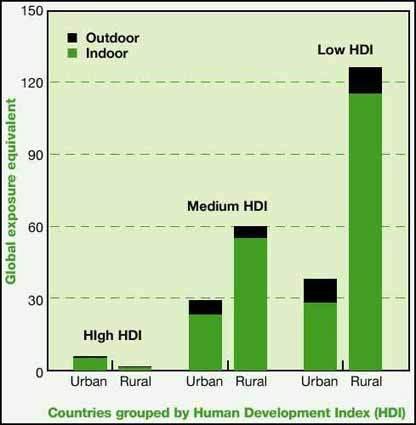
FIGURE 2.5. GLOBAL EXPOSURE
EQUIVALENTS FOR PARTICULATES IN 12 MAJOR MICROENVIRONMENTS
The global exposure equivalent is defined as the
equivalent (particulate) concentration that the entire world’s population
would have to breathe continuously to equal the population exposure in each
micro-environment.
Note: Data are for various years from the late 1980s to early
1990s.
Source: Based on Smith, 1993.
Education. Despite momentous advances in the literacy of
women, much remains to be done. As long as the drudgery of survival activities
continues to grow, given the division of labour in most households, getting
girls into schools will be an uphill battle. Improved access to better-quality,
affordable, reliable cooking fuels could make an enormous difference. As it is,
girls are the first to be called on to shoulder survival activities that cannot
be managed by the adult women of the household. Invariably, girls’
education suffers as a result.
Human productivity. The gravest consequence of energy
scarcity is probably that human productivity - especially women’s
productivity - is depressed. When survival of the family becomes the goal, there
is no opportunity to develop human potentials and talents. This is a loss not
only to the individual, but to society as
well.
Energy for improving the position of women
Energy can be a vital entry point or ‘lever’ for
improving the position of women in the household and society. As a bottleneck
and burden, the lack of affordable energy has often constrained the options and
opportunities available to women. But there are many strategic advantages in
using energy as an entry point.
Energy scarcity condemns many women to spend all their days and
a good part of their nights meeting basic survival needs. Enhancing their access
to affordable, clean energy sources would go a long way towards reducing the
drudgery they face, and allow them to use their time and energy for other
purposes. This could lead to improved health, education, nutrition, and economic
status, not only for women but for their families as well. The greatest benefit
would accrue to the next generation; and in particular to girls, who would gain
- as their workload at home decreases - better health and nutrition and
opportunities to go to school.
Energy is also a key productive asset for strengthening the
economic standing of women. In many cases it is also necessary for providing
equal access to productive resources (Batliwala and Reddy, 1996). Whether a
woman is engaged in food processing or in farming, her economic return largely
depends on a dependable supply of energy and on improvements in energy
technology products relevant to her trade.
Energy is a good organising issue for women, because energy is a
primary concern in their daily lives - especially poor women’s. Energy
resource scarcity, cost, quality, and reliability are their constant concerns.
Whereas alone each woman may be able to do little to improve the situation,
together their power could be fairly easily demonstrated. In some countries
farmers (mainly men) have organised themselves to demand affordable and reliable
energy supplies. Women can broaden these movements by adding their agenda.
|
Energy can be
a vital entry point or 'lever'
for
improving the position of
women in the household
and society. |
Finally, energy provides many opportunities for skill building
among women. That these skills would be non-traditional ones, and would not
restrict women to the kitchen and home (as do those perennial-favourite
income-generation schemes tailoring and pickle-making) are added advantages. The
exploitation of such opportunities, combined with improved access to credit for
women, could result in considerable entrepreneurial activity.
This perspective can also be turned on its head with good
effect. Involving women more integrally in the energy sector could be a boon for
the sector as well. The energy sector has evolved as a capital-intensive,
expert-dominated, centralised sector. But there is a role for decentralised
energy in which women can play an important part. In fact, the
‘engendering’ of the energy sector could be its salvation in the long
run, leading to decentralisation, longer-term perspectives, and investment, and
a better fit between energy source, energy quality, and end use - in other
words, to a greater emphasis on renewable energy sources, in keeping with the
underlying philosophy of sustainable
development.
Energy and population
Many of today’s global problems arise from the availability
and use of natural resources, which depend on the size of the human population
putting pressure on them. This pressure has been escalating in an alarming
manner.
The world’s population has increased explosively over the
past 100 years. “It took the world population millions of years to reach
the first billion, then 123 years to get to the second, 33 years to the third,
14 years to the fourth, 13 years to the fifth billion” (Sen, 1994).
Additions to the population have been unprecedented: “Between 1980 and
1990, the number of people on earth grew by about 923 million, an increase
nearly the size of the total world population in Malthus’ time” (about
1800; Sen, 1994).
This explosive growth has led to talk of a runaway population
inexorably bringing humanity to its doom and of a situation of ‘standing
room only’ on this planet. But these predictions have generally assumed the
persistence of the very high population growth rates of the 1950s, which
corresponded to a doubling every 23 years or
so.
Demographic transitions
The recent tremendous increase in world population is associated
with what is known as a demographic transition. In such a transition, the
population moves from a pre-industrial balance of high mortality and high
fertility to a post-industrial balance of low mortality and low fertility.
Demographic transitions have occurred in the past - in Western
Europe in the 19th century, and in Southern and Eastern Europe in the first
quarter of the 20th century. They are now taking place all over the developing
world. In some countries they are just starting. In others they are well under
way. And in the remaining countries they are over or almost over.
The demographic transition currently under way in developing
countries has been initiated by the rapid fall in mortality in these countries,
brought about by improvements in public health and advances in medical
technology. For example, an increase in life expectancy from 40 to 50 years was
accomplished in developing countries in just 15 years, from 1950-65. In
comparison, a similar increase of life expectancy required 70 years (from
1830-1900) in Western Europe and 25 years (from 1900-25) in southern and Eastern
Europe.
If a large reduction in mortality were not accompanied by a fall
in fertility, the population would increase indefinitely. But what happened in
industrialised countries is that fertility also fell, and the low value of
mortality was balanced by a new low value of fertility. Thus the growth rate of
population is low both before and after the demographic transition during which
the population grows rapidly:
The rate of world population growth is certainly
declining, and even over the last two decades, its percentage growth rate has
fallen from 2.2 percent per year between 1970 and 1980 to 1.7 percent between
1980 and 1992. This rate is expected to go down steadily until the size of the
world’s population becomes nearly stationary (Sen, 1994).
The crucial question, therefore, is whether the reduction in
mortality that took place in developing countries from 1950-65 has been followed
by a fall in fertility. The evidence seems clear. Until the mid-1960s there was
no sign of a fertility decline, but since then fertility has begun to fall in
almost all developing countries, except those in Sub-Saharan Africa. The average
total fertility rate in developing countries fell from 5.9 to 4.7, that is, by
about 20 percent, from 1965-70.14
It is important to note that the response of fertility is not as
rapid as the decline in mortality - fertility is not in sync with mortality. The
delay in fertility decline leads to a ‘bulge’ in the time variation of
population. This bulge gives rise to the problems associated with population
size. Thus it seems that a demographic transition is taking place and that the
population of developing countries and of the world is likely to stabilise
eventually. But the world is sure to have a growing population for quite some
time because of ‘population momentum (Sen,
1994).
Population momentum
Population momentum has important geographic, locational, and
age dimensions. First, the geographic distribution of population growth is
uneven - 90 percent of the growth is taking place in developing countries. These
additions to population are primarily in populous countries with a low average
income. In addition, the population explosion is worse in countries that already
have a severe population problem. Second, the locational distribution of
population growth is such that the urban share of growth has increased and will
continue to go up.
Third, the age distribution of the population is changing in all
countries, but the nature of the change varies among them. The population is
becoming older in rich countries because life expectancy is increasing while
infant mortality is relatively stable. In poor countries the age distribution
depends on the phase of the demographic transition. In the initial phase the
dependent non-working-age population grows faster because infant mortality is
declining much more than the increase in life expectancy. In the middle phase
the growth of the working-age population (with the potential of being
economically active) is relatively greater.15 And in the final phase,
the elderly population grows faster.16
It is important to estimate this future population. An average
of the 1992 UN medium estimate and the World Bank estimate of the future
population yields 9.79 billion in 2050,17 11.15 billion in 2100, and
11.45 billion in 2150. In 1998 the UN Population Division projected 8.9 billion
people by 2050, thanks to the fertility rate decreasing around the world (New
York Times, 21 October 1998, p. A8). The bulk of the population increase is
expected to take place in developing countries, where the population is expected
to triple to 9 billion by 2110.
The increase in global population before its expected
stabilisation by about 2100 means that per capita resources will continuously
decline in the near future. In fact, per capita estimates conceal the
differential growth that is likely to take place in industrialised and
developing countries, which will exacerbate the already serious disparities
between these two
worlds.
The energy-population nexus
Population levels influence the magnitude of energy demand in a
straightforward way: The larger the population, the more total energy is
required, with the magnitude of this total energy depending on per capita energy
consumption. This is perhaps the basis of a view that population increases in
developing countries represent the most serious threat to the global atmosphere
through the phenomenon of global warming (Atiq, Robins, and Roncerel, 1998).
There is an another view, however. The patterns of energy
consumption in rich industrialised and poor developing countries, and the rich
and poor within developing countries, are such that industrialised countries,
and the rich within developing countries, have - because of their
energy-intensive consumption patterns - far greater per capita impact on the
global atmosphere. Hence the greater rates of population growth of poor
developing countries, and the poor within developing countries, are far less
relevant to global warming than the lower rates of population growth of
industrialised countries, and the rich within developing countries. In fact, 49
percent of the growth in world energy demand from 1890-1990 was due to
population growth, with the remaining 51 percent due to increasing energy use
per capita.18 This relationship will hold true for the future if per
capita energy consumption does not change significantly.
Thus the conventional view of the energy-population nexus is
that population is an external factor influencing energy consumption. This
exogenous impact of population on energy is the well-known (and obvious) aspect
of the population-energy connection, although many people seem not to realise
the scale of its impact even today.
But there can be another connection, in which energy strategies
may lessen the intensity of the population problem. If energy consumption and
population growth are a dialectical pair - each transforming the other, and each
being an effect when the other is the cause - then the pattern of energy
consumption should also have an effect on population growth.
This is the other side of the coin - energy consumption patterns
influencing the rate of population growth through their effect on the desired
number of births in a family and the relative benefits and costs of fertility.
These patterns can retard or accelerate the demographic transition (Goldemberg
and others, 1988).
This dimension of the energy-population nexus - not yet
elaborated sufficiently - will be sketched through the influence of energy
consumption on population growth at two levels: the micro level of villages in
developing countries and the macro level of the world. The implication is that
energy can play a key role in accelerating the demographic transition,
particularly by achieving dramatic reductions in fertility to stabilise global
population as quickly as possible and at as low a level as
possible.
Rural energy consumption and population implications
To proceed, several features of rural energy consumption in
developing countries must be highlighted. Though these features vary with
country and agroclimatic conditions, a few numbers typical of south Indian
villages are presented to give a flavour of the features involved (ASTRA, 1982):
· Commercial energy
accounts for a very small percentage of the inanimate energy used in villages;
the bulk of the energy comes from fuelwood.19
· Animate sources - human beings
and draught animals such as bullocks - account for less than 10 percent of the
total energy, but the real significance of this contribution is that these
animate sources represent the bulk of the energy used in agriculture.
· Nearly all the energy
consumption comes from traditional renewable sources. Thus agriculture is
largely based on human beings and bullocks, and domestic cooking (which uses the
bulk of the total inanimate energy) is based entirely on fuelwood.20
But the environmental soundness of this pattern of dependence on renewable
resources comes at an exorbitant price. Levels of agricultural productivity are
very low, and large amounts of human energy are spent on fuelwood gathering (for
example, about 2-6 hours and 4-8 kilometres a day per family to collect about 10
kilograms of fuelwood).
· Fetching water for domestic
consumption also uses a great deal of human energy (an average of 1.5 hours and
1.6 kilometres a day per household) to achieve an extremely low per capita water
consumption of 1.7 litres a day.
· Almost half of the human
energy is spent on grazing livestock (5-8 hours a day per household), which is a
crucial source of supplementary household income in these parts of the country.
· Children contribute about
one-third of the labour for gathering fuelwood, fetching water, and grazing
livestock. Their labour contributions are vital to the survival of families.
This point is usually ignored by population and education planners.
· The end uses of human energy
in villages show that their inhabitants, particularly women and children, suffer
burdens that have been largely eliminated in urban settings by the deployment of
inanimate energy. For example, gathering fuelwood and fetching water can be
eliminated by changing, respectively, the supply of cooking fuel and water.
There are also serious gender and health implications of rural energy
consumption patterns (Batliwala, 1982).
|
Industrialised countries have -
because of their
energy-intensive
consumption patterns - far greater
per capita impact on
the
global atmosphere. |
To understand the population implications of these features of
energy consumption in villages, it is necessary to consider how these features
influence the desired number of births in a family and the relative benefits and
costs of fertility. A useful starting point is the general preconditions for a
decline of fertility, as set forth by the demographer A. J. Coale (1973, 1983):
· Fertility must be
within the calculus of conscious choice. Potential parents must consider it an
acceptable mode of thought and form of behaviour to balance advantages and
disadvantages before deciding to have another child.
· Reduced fertility must be
advantageous. Perceived social and economic circumstances must make reduced
fertility seem an advantage to individual couples.
· Effective fertility reduction
techniques must be available. Procedures that will prevent births must be known,
and there must be sufficient communication between spouses and sufficient
sustained will, in both, to use them successfully.
The exercise of choice in matters of fertility is a
culture-dependent issue, and awareness and availability of fertility-reduction
techniques depend on specific technologies and the success with which they are
spread. But the desired number of births, and therefore the relative benefits
and costs of fertility, depend upon socioeconomic factors such as
· Infant
mortality and the probability of offspring surviving. The lower this
probability, the larger the number of children aspired to and the greater the
exposure of the mother to the possibility of additional pregnancies.
· The role of women in
arduous, time-consuming household chores. The greater this role, the smaller
the scope and emphasis on women’s education and the lower the age of
marriage.
· The use of children to
perform essential household tasks. The greater the use of children for these
tasks, the more they become essential for the survival of the household.
· Opportunities for children
to earn wages. Wage-earning children become desirable as economic
assets.
Only a few of these factors enter into perceptions of advantages
and disadvantages of fertility and family size. Nevertheless, the reduction of
fertility, and therefore the acceleration of the demographic transition, depends
on crucial developmental tasks. These tasks include an increase in life
expectancy, improvement of the immediate environment (including drinking water,
sanitation, and housing), education of women, and diversion of children away
from household support tasks and employment to schooling.
Further, almost every one of these socioeconomic preconditions
for smaller family size and fertility decline depends on energy-using
technologies. Infant mortality has much to do with inadequate, unsafe supplies
of domestic water and with an unhealthy indoor environment resulting from
polluting fuel-stove cooking systems. The conditions for women’s education
become favourable if the drudgery of their household chores is reduced with
efficient energy sources and devices for cooking and with energy-using
technologies to supply water for domestic uses. The deployment of energy for
industries that generate employment and income for women can also help delay the
marriage age, which is an important determinant of fertility. And if the use of
energy results in child labour becoming unnecessary for crucial household tasks
(cooking, gathering fuelwood, fetching drinking water, grazing livestock), an
important rationale for large families is eliminated.
From this standpoint, it is obvious that prevailing patterns of
energy consumption in villages do not emphasise energy inputs for the following
tasks:
· Providing safe and
sufficient supplies of drinking water.
·
Maintaining a clean and healthy environment.
· Reducing the drudgery of household chores
traditionally performed by women.
· Relieving
children of menial tasks.
· Establishing
income-generating industries in rural areas.
Thus current energy consumption patterns exclude the type of
energy-using technologies needed to promote the socioeconomic preconditions for
fertility decline. In fact, they encourage an increase in the desired number of
births in a family and an increase in the relative benefits of fertility
(Batliwala and Reddy,
1996).
Traditional biomass-based cooking and demographic indicators
Traditional biomass-based cooking is predominant in most
developing countries, particularly in rural areas. The negative health impacts
of this are discussed in chapter 3. The low efficiencies of traditional biomass
stoves derive from the incomplete combustion of the biomass, resulting in a
number of health-damaging pollutants, particularly suspended particulates and
carbon monoxide. These pollutants exceed acceptable levels inside poorly
ventilated houses, especially those without chimneys. Thus one would expect to
find a correlation between the percentage of biomass use in total energy use and
a number of demographic indicators, especially those related to women and young
children, who are thought to be most vulnerable.
Indeed, such a correlation has been revealed by recent work on a
large number of developing countries (Bloom and Zaidi, 1999). Table 2.1 shows
that, as the percentage of biomass increases, life expectancy decreases, infant
(and child) mortality increases, and the annual population growth rate
increases. Such trends do not prove causality but are consistent with the view
that traditional biomass use impedes the demographic
transition.
Energy-population nexus at the global level
One way of considering the energy-population nexus at the global
level is through the 1 kilowatt per capita scenario (Goldemberg and others,
1985) described above. That scenario shows that, if the most energy-efficient
technologies and energy carriers available today were implemented, a mere 10
percent increase in the magnitude of energy would be required for the
populations of developing countries to enjoy a standard of living as high as
that in Western Europe in the 1970s. In other words, under the conditions of
this scenario, energy supplies need not become a constraint, and dramatic
increases in living standards can be attained in developing countries. It
follows that, if energy-efficient technologies and modern energy carriers were
implemented to enable the populations of developing countries to realise higher
living standards, then these standards would likely result in low growth rates
for developing country populations, similar to rates in Western European
countries. Insofar as current energy strategies do not sufficiently emphasise
energy-efficient technologies and modern energy carriers, they are not
addressing directly the population problem.
TABLE 2.1 BIOMASS USE AND DEMOGRAPHIC INDICATORS
|
Indicator |
Percentage of biomass in total fuel use |
|
0-20 |
20-40 |
40-60 |
60-80 |
Above 80 |
|
Number of countries |
70.00 |
12.00 |
14.00 |
10.00 |
16.00 |
|
Female life expectancy (years) |
74.70 |
68.80 |
62.00 |
56.10 |
48.30 |
|
Life expectancy (years) |
71.50 |
66.50 |
59.90 |
54.50 |
47.00 |
|
Male life expectancy (years) |
68.50 |
64.00 |
57.80 |
53.00 |
45.80 |
|
Infant mortality (per 1,000 live births) |
22.50 |
46.60 |
64.70 |
82.60 |
116.80 |
|
Under-five mortality (per 1,000 live births) |
27.50 |
59.30 |
93.00 |
135.30 |
173.00 |
|
Total fertility rate |
2.51 |
3.26 |
4.64 |
5.35 |
6.33 |
|
Crude birth rate |
19.20 |
26.20 |
35.00 |
39.10 |
45.00 |
|
Crude death rate |
8.60 |
7.60 |
10.90 |
12.80 |
18.10 |
|
Annual population growth rate (percent) |
1.00 |
1.61 |
2.43 |
2.74 |
2.52 |
|
Female-male life expectancy gap (years) |
6.20 |
4.50 |
4.20 |
3.10 |
2.60 |
Sources: UN, 1993a; World Bank,
1998.
Energy and urbanisation
A century ago, even visionaries could not imagine a city with
more than 1 million inhabitants.21 Yet by 2010 more than 500 such
concentrations will dot the globe, 25 of them with more than 10 million people
(so-called megacities). The availability of energy sources in combination with
the phenomena of motorisation and industrialisation have substantially altered
the manner in which people relate to their environment.
Urban dwellers will soon outnumber those in traditionally rural
areas and constitute half the world’s population. Of the 1.23 billion urban
residents added to the world population since 1970, 84 percent have been in less
developed regions. The global population is growing by 2.5 percent a year (3.5
percent a year in less developed regions, and 0.8 percent in more industrialised
regions). The annual growth is 61 million people - roughly the equivalent of
adding six cities with a population of 10 million to the urban population
world-wide. By 2020-25 the global annual urban growth rate will have declined to
less than 2 percent, but the urban population will increase by 93 million people
a year - more than the current annual increase in the total world population.
The rate of urbanisation and its attendant impacts differ in
regions across the globe. Thus strategies to capitalise on the positive factors
of urbanisation and to mitigate the negative factors will also differ by region.
Latin America is the most urbanised region in the developing world. Nearly
three-quarters of Latin Americans live in urban areas. Although Africa is the
least urbanised region, it is experiencing the highest urban growth rate, and
already a third of its people live in cities. However Asia contains almost half
the world’s megacities and continues to urbanise rapidly. Given its current
annual growth rate, Asia’s urban population is expected to double in less
than 20 years.
Increasingly, larger portions of the world’s people live in
the biggest cities. In addition, more live in intermediate-sized cities than
ever before. In 1950 there were 83 cities or urban areas with more than 1
million people. Today 280 such urban areas exist. The growth of large cities
also affects smaller cities, particularly in less developed regions. Over the
next 15 years the number of cities with 5-10 million residents will increase
significantly. Further, the number of people in them will more than double, as
will the population of cities in the 1-5 million and 0.5-1.0 million ranges.
This means that while megacities are the most visible symbols of problems and
challenges, smaller cities are no less significant.
Urbanisation reflects more than demographic change. It is both
driven by and profoundly influences the context and processes of development. It
exerts both direct and indirect advantages in the struggle towards global
sustainability and human development. The origins of many global environmental
problems related to air and water pollution are located in cities - this is the
urbanisation-pollution linkage. Unsustainable consumption and production
patterns are also a feature of cities. But it is also in cities that one can
find potential solutions, because they have several positive features.
Birth rates are three to four times lower in urban areas than in
rural areas, thereby reducing environmental pressures from population growth.
Cities provide greater accessibility to education, services, and training. They
increase the access of residents to information on environmental issues and
facilitate their integration into the policy process according to identified
needs and priorities. Because of their concentrated form and efficiencies of
scale, cities offer major opportunities to reduce energy demand and minimise
pressures on surrounding land and natural resources. Women are also the direct
beneficiaries of urbanisation, because their interests and demands are more
easily articulated and negotiated in their new, dynamic social environment.
Cities are the engines of economic growth and centres of
employment and opportunity for expanding and diversified national economies.
Eleven of the twelve urban agglomerations with 10 million or more people are
located within one of the 25 largest economies. The economic prosperity of
nations will depend on the performance of their cities. With a focus on cities,
appropriate energy policy can be targeted more effectively and resources
leveraged far more efficiently to affect large numbers of individuals,
communities, industries, and services. But a lack of competent and accountable
urban governance can lead to the loss of much of the potential contribution of
cities to sustainable economic and social development and, at worst, to a
completely dysfunctional living environment. Concerned and innovative urban
development planning, on the other hand, can enable growing urban populations to
contribute towards sustainable human development by empowering individuals to
convert their creative assets into global
wealth.
Urbanisation and energy linkages
The 1996 United Nations Conference on Sustainable Human
Settlements, known as Habitat II, reaffirmed that the vast majority of
population growth in developing countries will occur in urban centres. The type
and scale of urban development will largely affect future energy consumption. In
turn, urbanisation also has a profound effect on the amount and type of energy
consumed. Other factors - including economic development, industrialisation, and
such social-cultural particularities as consumption patterns - also drive the
global increase in energy demand. Although traditional rural societies rely
heavily on human and animal energy and on wood for fuel, today’s urban
societies rely primarily on fossil fuels and electricity.
Per capita energy consumption remains low in the developing
world. For many urban Africans and Asians, biomass fuels meet a large portion of
energy needs. As these countries urbanise, energy demand increases, and
traditional bulky fuels (such as wood and charcoal, which require
energy-intensive forms of transportation), food, and other materials consumed in
urban areas must be transported across greater distances. Urban manufacturing
and industry also require more energy than traditional agriculture. In addition,
the provision of infrastructure and services to new urban residents requires
energy that is not typically consumed in rural settlements.
Urbanisation imposes enormous demands on the ecosphere, because
most urban activities at the industrial, community, and household levels are
based on natural capital depletion. Housing construction, transportation,
economic activities, and the generation of residential heat and electricity all
put stress on the environment and compete for ecological space. Energy use is
already high in industrialised countries and is increasing rapidly in developing
countries as they industrialise. But energy can be an instrument for sustainable
development with an emphasis on more efficient use of energy, and an increased
use of renewable energy sources, among other
measures.
Urbanisation and energy strategies
Although many countries prepared national plans of action for
Habitat II, most did not formulate a national policy on the linkages between
urbanisation and energy. Few governments have allocated significant resources to
encouraging more effective use of non-renewable energy resources or to
increasing the long-term supply of renewable energy resources. In light of
current urbanisation trends and the opportunities presented by new
energy-efficient technologies and processes, the moment is opportune for this
discussion to take place.
Cities have the potential to be far more environmentally benign.
The spatial concentration of humans and their activities can minimise pressures
on surrounding land and natural resources. Well-designed cities can channel
development far away from wetlands and other sensitive areas, and protect
natural resources. By integrating land-use and transportation planning, cities
can reduce both congestion and pollution.
Cities offer important opportunities for protecting the
environment. With proper planning, dense settlement patterns can ease pressures
on per capita energy consumption and provide opportunities to increase energy
efficiency. For example, recycling becomes more feasible due to the large
quantities of materials and the number of industries that can benefit from it.
In addition, land use, infrastructure, and services are better used, and the
need for extensive transportation networks and residential heating is reduced.
Low-density communities tend to have the opposite characteristics.
Transportation. Mobility and access remain among the
greatest challenges for cities in the developing world, especially considering
the growing proportion of lower-income people. A city that cannot be accessed by
all its inhabitants is not sustainable. Because motor vehicle ownership remains
relatively low in many of these cities, there is a window of opportunity to
avoid the mistakes made in the industrialised world and design urban
transportation systems that facilitate walking, bicycling, and public
transportation. Such measures can improve the environmental health of cities and
citizens as well as mitigate the threat of global warming.
|
The new millennium is ushering
in a new urbanised era. For
the first
time ever, more people will reside
in urban settlements
than
in rural. |
Cities are centres of employment, residence, and leisure, and of
the integration between them. Mobility and access are therefore complementary
aspects of the same problem. Mobility implies movement: people going to work,
people going to the market, people bringing vegetables to sell in the market.
Access implies the ability to take advantage of urban functions: people
developing ‘backyard industries’, people being able to find in their
neighbourhoods the services they need, people being able to walk to work. A
sensible balance between mobility and accessibility concerns should result in a
more energy-efficient transport strategy based on demand management. In this
regard, the systemic integration between land use and transport is much more
important than an isolated concern with vehicles, fuels, and emissions. These
are also important complementary concerns.
To illustrate, given the opportunity to work legally at home
(for example, inputting data or transcribing reports from remote places), the
informal sector, a thriving and integral sector in developing economies, would
be formalised and backyard industries would proliferate, reducing the need for
urban residents to commute to places of employment. The integration of
sustainable transport and employment-related strategies could reduce stress on
the local environment, promote more creative employment options (especially for
women), and lead to a general improvement in quality of life.
Patterns of energy consumption also depend on the means and
availability of transport. Where extensive road networks, vehicles, and other
transport infrastructure exist, there is a high risk of depending on a
supply-driven vicious circle. As is well known, conventional traffic planning
based on individual modes of transport can lead to potentially difficult
situations, as has occurred, for example, in Bangkok (Thailand), Kuala Lumpur
(Malaysia), Mexico City, and Săo Paulo (Brazil). The creation of appropriate
land-use legislation for residential and commercial sites and access to public
transportation services can mediate the demand for more energy-intensive
transport use.
Considerable opportunity exists to design more efficient
transportation systems and create more liveable cities. A critical step for
industrialised and developing countries is to move towards managing urban travel
demand rather than simply increasing the supply by reducing or averting
over-reliance on the privately owned car through appropriate pricing, spatial
settlement policies, and regulatory measures.
A number of strategies are available to governments to advance a
sustainable transport sector (Rabinovitch, 1993; UN, 1996):
· Exploration of
surface (rather than above-ground or underground) solutions based on affordable
technologies. Buses should be considered before a high-technology rail system.
· Development of an integrated
transport strategy that explores the full array of technical and management
options and pays due attention to the needs of all population groups, especially
those whose mobility is constrained because of disability, age, poverty, or
other factors.
· Coordination of land-use and
transport planning to encourage spatial settlement patterns that facilitate
access to basic needs such as places of employment, schools, health centres, and
recreation, thereby reducing the need to travel.
· Encouragement and promotion of
public access to electronic information services and technology.
· Promotion, regulation, and
enforcement of quiet, use-efficient, low-polluting technologies, including
fuel-efficient engine and emission controls, fuel with a low level of polluting
emissions, and other alternative forms of energy.
· Provision or promotion of
effective, affordable, physically accessible, and environmentally sound public
transport and communication systems that give priority to collective means of
transport, with adequate carrying capacity and frequency to support basic needs
and reduce traffic flows.
· Exploration of partnerships
with private-sector providers. Ideally the public sector should provide
monitoring and operational standards, and the private sector should invest in
capacity and contribute managerial comparative advantages and
entrepreneurship.
Construction. Low-energy building materials such as
timber, soil, sand, and stone require little energy in their manufacture and
processing. The durability of many of these materials can be improved without
large energy expenditures. These materials are often used in the construction of
housing in developing countries. It is often possible to improve the use of such
materials through appropriate construction methods and design techniques that
maximise their functionality and natural advantage.
One example is construction using earth, in which the mechanical
energy required is ultimately much more efficient than that for ceramic building
materials, which require large amounts of heat (usually applied inefficiently).
The low costs of locally available renewable energy resources could potentially
ensure a continuous supply of energy to meet the demand of domestic,
agricultural, and small-scale industrial sectors. These materials also have the
advantage of being familiar to local building operators and
planners.
Energy to improve the urban environment
The new millennium is ushering in a new urbanised era. For the
first time ever, more people will reside in urban settlements than in rural.
Perhaps the forces of change - economic, social, technological, and political -
render this process inevitable. If so, policy design and prescriptions should be
targeted differently. Rather than attempting to arrest rural-urban migration, it
is important to make rural life less difficult and arduous and more pleasant and
attractive.
|
The rapid expansion of urbanised areas,
especially in
developing countries,
creates a unique opportunity
to implement
'leapfrogging'
approaches. |
Energy interventions can play a positive role in this task
through electrification of homes for lighting, labour-saving appliances, and
entertainment, as well as for the supply of safe piped water. Thus an
improvement in the quality of rural life can decrease the negative aspects of
urbanisation, making it wise to pursue balanced urban and rural development and
to ensure synergies between the two. The focus of development efforts should be
redirected towards achieving more sustainable urban and rural living
environments in light of the inevitability of a mostly urban world.
Rapid urbanisation is associated with a rise in energy demand -
which potentially threatens the sustainability of human settlements and the
natural environment. The spatial concentration and diversification of human and
economic activities hasten the demand for resources and compromise the carrying
capacity of final disposal systems and infrastructure. In addition, the rise in
disposable income of urban populations is likely to lead to a concomitant desire
for more material goods and services.
Yet many of the negative effects of urbanisation can be
mitigated through innovative energy policies. In developing countries rapid
urbanisation and its attendant demands on material and financial resources have
severely compromised the ability of governments to foster sustainable
environment. Although the use of fossil fuels in industrial processes, heating,
electricity, and motor vehicles tends to expand with economic growth, measures
can be taken to promote renewable, clean technologies that lessen the burden of
economic activity on human populations and ecosystems. In cities in
industrialised countries, control of motor vehicle emissions has led to a
dramatic reduction in ground-level ozone and carbon monoxide levels on or near
major roads.
Urban areas offer enormous potential for easing the demand for
energy-intensive materials and increasing the efficiency of resource use. The
agglomeration of social networks fosters an environment that is more accessible
to public awareness campaigns, creating a favourable learning environment for
changing wasteful patterns of consumption on a large scale. The application of
new energy-efficient technology is more easily accelerated in an urban setting
because business and industry may be more amenable to experimentation and thus
bypass the environmentally deleterious path of excessive technological use that
has often been followed in industrialised countries.
Most technologies used in cities in the industrialised world
were invented about a century ago. The rapid expansion of urbanised areas,
especially in developing countries, creates a unique opportunity to implement
‘leapfrogging’ approaches. Widespread urbanisation may provide the
economies of scale needed to implement innovative affordable technologies.
The urban environment is also conducive to offering education
opportunities and creating jobs. This facilitates capacity-building efforts to
deal with the operation and maintenance of environmentally friendly energy
infrastructure based on renewable sources. Opportunities for reducing the
material inputs of production by recycling waste by-products are more feasible
in urban areas. For urban services such as transportation, a reduction in cost
and in the share of energy-intensive services provides an additional means by
which energy strategies can take advantage of the positive aspects of
urbanisation. A prime example is the promotion of surface bus modes of
transportation rather than expensive solutions such as
subways.
Energy and lifestyles
After the oil shocks of the 1970s, one of the issues that often
arose in discussions of energy was the sustainability of a world with glaring
and grave disparities in per capita energy consumption between industrialised
and developing countries. A related issue was the need for convergence in per
capita consumption through minimisation, if not removal, of these disparities.
These discussions were set aside because of optimists’
belief in the enormous potential of efficiency improvements. These improvements
- it was believed - would enable industrialised countries to sustain their
energy services (and therefore living standards and lifestyles) with far less
energy consumption. At the same time, the improvements would enable developing
countries to achieve dramatic improvements in their standards of living with
only marginal increases in their inputs of energy. Now, almost 30 years after
the oil shocks, the time has come to revisit these fundamental issues by
analysing the experiences of industrialised
countries.
Energy use in the United States
Consider the United States.22 Following the oil
shocks and for almost 10 years, from 1973-83, the United States reduced its
consumption even as its population and economy expanded. “Americans learned
to do more with less” (Myerson, 1998). For instance, there was an emphasis
on thicker insulation and tighter windows to cut space-heating bills. Compact,
fuel-efficient cars became popular. There was investment in more efficient
appliances, machines, and engines. As a result per capita residential energy
consumption fell by a tenth. It looked as if energy patterns were following the
hopes of the optimists.
But during the next 15 years, from 1983-98, the United States
lost all the gains in energy conservation it achieved in 1973-83. Declining
energy prices offset the conservation gains. In 1983-98 per capita residential
energy consumption rose by 10 percent, offsetting its 10 percent reduction from
1973-83 and rising to within 2 percent of its 1973 peak. Americans returned to
consuming nearly as much energy as before the oil shocks.
In 1999 Americans were expected to burn more fuel per capita
than in 1973. U.S. dependence on oil imports has increased - in 1973 imports
were 35 percent of consumption; in 1998, 50 percent. In 1973, 5 percent of oil
imports came from the Gulf; in 1998, 10 percent. The reduction in the energy
intensity of the U.S. economy has tapered off; from 1972-86 energy per unit of
GDP fell 43 percent; but from 1987-97 the fall was only 8 percent. It appears as
if, to one-third of Americans, “conservation means doing less, worse or
without, i.e., privation, discomfort and curtailment” (Myerson, 1998).
Houses. The number of people in the average U.S.
household has shrunk by one-sixth, but the area of the average new home has
grown by one-third. In 1973 the average new home was 1,600 square feet for the
average family of 3.6 people; by 1998 the average size had increased to 2,100
square feet even though the average family had shrunk to 3.0 people. In
addition, many energy-intensive changes have taken place inside the home. For
example, the average ceiling height, which was 8 feet in 1973, had risen to 9
feet by 1998. Ceilings are often so high that ceiling fans are required in
winter to blow back rising heat.
Appliances. The penetration of energy-intensive
appliances has increased. For example, in 1973 fewer than 40 percent of homes
had central air conditioning. But in 1998 more than 80 percent had it. Forty
percent of homes had two or more television sets in 1970; by 1997, the
percentage was 85 percent. And homes with dishwashers increased from 19 percent
in 1970 to 57 percent in 1996. There has also been an invasion of new always-on,
electricity-sucking ‘vampires’ such as computers, videocassette
recorders, microwave ovens, and telecommunications equipment. The energy
consumption of these gadgets is rising 5 percent a year, and they will soon
consume more per household than a refrigerator.
Transport. Americans are driving automobiles more than
ever, primarily because there are more wage earners per family and more urban
sprawl. The number of women working or looking for work increased from 47
percent in 1975 to 72 percent in 1997. Households with three or more cars
increased from 4 percent in 1969 to 20 percent in 1998. From 1983-95 average
commuting distance increased by one-third, from 9.72 to 11.6 miles. And only 15
percent of commuters use public transit.
Fuel-intensive minivans, sport utility vehicles, and pickup
trucks are growing in popularity. As a result the average horsepower of motor
vehicles increased from 99 in 1982 to 156 in 1996. It took 14.4 seconds to
accelerate from 0-60 miles per hour in 1982, but only 10.7 seconds in 1996.
Gasoline prices are a key factor in these developments. The 1973
per gallon price (adjusted for inflation) was $1.10, but the 1998 price was only
$1.00. U.S. gasoline prices are only about a third of those in Europe and Japan.
No wonder U.S. per capita consumption is much higher than that in Europe and
Japan.
Industry and commerce. U.S. corporations have all but
stopped making improvements solely to save energy. Industrial and commercial
energy use fell 18 percent from 1973-83 but rose 37 percent from 1983-97.
Environment. Clearly, energy prices and environmental
concerns point in opposite directions. At the 1992 Earth Summit, U.S. President
George Bush pledged to reduce carbon emissions by 7 percent between 1990 and
2010. But the U.S. Energy Information Administration predicts that emissions
will rise 33 percent. If fears of global warming are justified, it looks as if
the pattern of U.S. energy consumption during the past 25 years has grave
implications for the global environment - even though U.S. national and urban
environments are much cleaner.
Energy and income. How have changes in lifestyle
influenced the pattern of energy use in industrialised countries?23
What are the determinants of energy consumption? What are the driving
forces of energy consumption patterns?
The general relationship between per capita GDP and per capita
energy use has been established in many studies (Nakicenovic and John, 1991).
The relationship is non-linear - energy use typically grows slower than GDP. For
instance, in 1985-95 per capita GDP in OECD countries grew 1.6 percent a year,
whereas per capita energy use grew 0.8 percent (IEA, 1997).
It is instructive to look at energy use from the point of view
of individual consumers or households. Households use energy directly (for
example, electricity, natural gas, and gasoline) as well as indirectly, in the
goods and services that they purchase. The sum of direct and indirect use
represents the total energy requirements of a household. If it is assumed that,
in the ultimate analysis, all products and services of society are produced for
the service of households, then an overall picture of the energy requirements of
society can be obtained.
The relationship between household income and energy
requirements (using input-output analysis) has been known for a long time. In
the early 1970s it was found that, if the income of households increases by 1
percent, their use of energy increases by 0.7-0.8 percent - that is, the income
elasticity of energy requirements for any year lies between 0.7 and 0.8
(Roberts, 1975). More detailed research in the Netherlands using a combination
of process analysis and input-output analysis came to similar findings; for 1990
the income elasticity of energy requirements was 0.63.
The most salient finding is that income is the main determinant
of energy consumption. Other household characteristics, such as size, age of
oldest member, life-cycle phase, degree of urbanisation, education level, and so
on, turn out to be relatively unimportant (Vringer and Blok, 1995; Vringer,
Gerlach, and Blok, 1997).
Income elasticity is smaller than unity because the growth of
direct energy consumption is less than the growth of income. In contrast the
indirect part of energy consumption grows in proportion to income. Thus a shift
to less energy-intensive products does not take place as household income grows.
In the case of direct energy use, saturation effects occur.
Lower-income households already use a large amount of natural gas (or other
energy carriers for space heating). Gasoline consumption saturates at a much
higher income level. Electricity consumption did not saturate in the income
categories considered.
|
While some saturation
effects occur, lifestyles
in
industrialised countries still
evolve towards higher
levels of
energy use. |
A cross-sectional analysis for 1948-96 yielded similar results.
Indirect energy use grew at a rate more or less proportional to income. Direct
energy consumption shows a different behaviour; from 1976-96 it grew at less
than average income levels (Vringer and Blok, 1995).
Thus the lifestyle issue becomes an income issue. Seen from the
perspective of households, income is by far the main driver of energy
requirements. There does not seem to be any tendency to adopt less
energy-intensive consumption patterns with rising
incomes.
Trends towards increased energy use
Increasing income levels tend to lead to a higher use of energy
services by citizens of modern society. Some saturation effects occur, but they
do not have a dominant effect on energy consumption. The effects of
energy-efficiency improvements, especially in space heating and large
appliances, may be more important. Nevertheless, lifestyles in industrialised
countries still evolve towards higher levels of energy use.
Many of the driving forces described here cannot easily be
altered to lead to lower energy use. But energy-efficiency improvement
(including design that stimulates energy-efficient use of equipment) had a
considerable impact in the early 1980s. Hence increasing the rate of efficiency
improvement seems to be the most straightforward approach to limiting the growth
of energy consumption.
If it is necessary to go beyond the limits of efficiency
improvements, it is not sufficient to identify income as the determinant. After
all, one cannot look for income reduction strategies. But income is only a proxy
for more fundamental determinants of energy use. Income is translated into
consumption, which is the material expression (more appliances, bigger homes,
heavier cars, more goods) of lifestyles. If one takes these material expressions
as determinants, one can think of strategies directed towards altering the
consumption patterns associated with the most energy-intensive categories of
energy use without impairing quality of life. But a great deal of thought and
action will be required to influence lifestyles in this way. They may require a
fundamental change in current pricing and taxing policies - not to mention
taking advantage of the Internet revolution to change
trends.
Conclusion
This chapter has clarified the two-way linkages between energy,
on the one hand, and poverty, women, population, urbanisation, and lifestyles,
on the other. The relationship between energy and these major global issues is
dialectical - the global issues determine energy consumption, and in turn,
energy systems influence the issues. If attention is focussed on the global
issues as the cause, then energy becomes the effect. But if the focus is on
energy as the cause, then one can see the myriad ways in which energy shapes the
global issues.
It has also been shown that current energy consumption patterns
are aggravating various global problems, leading to further unsustainability.
But energy can also contribute to the solution of problems; in particular,
poverty, the situation of women, population growth, unplanned urbanisation, and
excessively consumptive lifestyles. To realise energy’s enormous potential
in these areas, it must be brought to centre stage and given the same importance
as other major global concerns.
A goal is an objective to be achieved, a strategy is a broad
plan to achieve the goal, and a policy is a specific course of action to
implement a strategy. Policies are implemented through policy agents working
with policy instruments.
The goal for energy systems is sustainable development. Energy
strategies to advance this goal should be derived from the details of the
linkages between energy and social issues. In particular strategies should
emerge from the manner in which energy can contribute to the solution of social
problems.
Thus poverty alleviation in developing countries should involve
the energy strategy of universal access to adequate, affordable, reliable,
high-quality, safe, and environmentally benign modern energy services,
particularly for cooking, lighting, income generation, and transport. Poverty
alleviation in industrialised countries requires the energy strategy of
universal protection and maintenance of access to affordable energy services,
particularly for space heating and lighting.
Improvement in the position of women requires energy strategies
that minimise, if not eliminate, arduous physical labour at home and at work,
replace traditional biomass-based fuel-stove cooking systems with modern
(preferably gaseous) fuels and cooking devices, and use the intrinsic managerial
and entrepreneurial capabilities of women in decentralised energy systems.
Control over population growth can benefit from energy
strategies that increase life expectancy and reduce infant (and child) mortality
in developing countries through modern fuels and cooking devices that render
unnecessary the physical labour of children for household chores such as
gathering fuelwood, cooking, fetching drinking water, and grazing livestock -
and that improve the quality of life of women.
Accentuating the positive aspects of urbanisation and
alleviating its negative aspects require energy strategies that exploit the
advantages of high-density settlements, provide universal access to affordable
multi-modal public transportation, and reduce the ‘push’ factor in
rural-urban migration by improving energy services in rural settlements.
Finally, reducing energy consumption through lifestyle changes
requires a strategy - using pricing and taxation - of discouraging the use of
energy-intensive devices and encouraging the use of energy-conserving devices.
To be successful, the strategies outlined above must harness
both appropriate supply and end-use technologies. The strategies must also be
converted into policies wielded by policy agents through policy instruments.
Complete hardware plus ‘software’ - policies, management, financing,
training, institutions - solutions are essential for the deployment of energy as
an instrument of sustainable development. These challenges will be discussed in
the chapters that follow.
Notes
1. Self-reliance does not preclude imports and exports but
requires that control over destiny be indigenous.
2. Energy use is taken as a proxy for useful energy, which means
that the efficiency of energy use has been held constant.
3. The linkages between energy and security, between energy and
economics, and between energy and environment are dealt with in later chapters.
4. This section is based on inputs from Anton Eberhard and Wendy
Annecke of the Energy Research Development Centre, University of Cape Town, and
from David Bloom, Harvard University.
5. Unfortunately, estimates of absolute poverty are quite
sensitive to the methods used to make these adjustments. In addition, all such
methods focus on the cost of a standardised bundle consumed by an average
household, not on the typical bundle consumed by a poor household. Insofar as
market baskets consumed by poor households tend to be filled with relatively
high proportions of less costly non-tradable goods and services, absolute
poverty will be overstated with all methods of estimation.
6. This number has been adjusted for differences in the
purchasing power of different national currencies in 1985 using estimates
contained in Penn World Table 5.6 (Center for International Comparisons at the
University of Pennsylvania, 2000).
7. Because of irregularities in supply, price rises, and so on,
households have, in addition to a preferred or dominant fuel, other fuels as
back-ups. Thus when LPG, for instance, is in short supply, households may be
forced to switch to electricity.
8. The thought experiment was not intended to recommend Western
European living standards as the goal for developing countries or to establish
activity level targets for these countries to be achieved by some particular
date. The appropriate mix and levels of activities for the future in developing
countries will have to be different to be consistent with their climate,
culture, and development goals. Rather, the purpose of the thought experiment
was to show that it is possible not only to meet basic human needs but also to
provide improvements in living standards that go far beyond the satisfaction of
basic needs, without significant increases in per capita energy use. Thus energy
supply availability need not be a fundamental constraint on development.
9. The correspondence between the 1 kilowatt per capita increase
(about 30 gigajoules per capita annually) and a vastly improved standard of
living is not very different from the threshold of 1 tonne of oil equivalent per
capita (about 40 gigajoules per capita annually), above which infant mortality,
illiteracy, life expectancy, and fertility all show substantial improvement and
saturation (see figure 2.1).
10. This section is based on the paper prepared for this chapter
by Jamuna Ramakrishna, Humanist Institute for Cooperation with Developing
Countries (HIVOS), Bangalore, India.
11. The initial (early 1970s) belief that this degradation was
the result of villagers’ dependence on biomass for cooking has given way to
a broader understanding that includes factors such as urban demand for biomass,
industrial needs, logging, and clearing for agriculture. The fact remains that
biomass cover (indicated, for instance, by remote sensing) is decreasing.
12. Under the criteria set forth in the 1993 revision of the
SNA, the boundary between productive activities that are market-oriented and
those that are not is drawn in such a way that the majority of household work
and community voluntary work is excluded from the SNA. Education is also
excluded. Although this leads to a gross under-estimation of women’s
economic contributions, the 1993 revision is actually an improvement over the
previous version of the SNA, which excluded production of household goods for
own consumption and activities such as carrying water (UNDP, 1995).
13. This section is based on the paper prepared for this chapter
by Jamuna Ramakrishna, HIVOS, Bangalore, India.
14. Total fertility is a measure of the average number of
children a woman will bear throughout her child-bearing years if at each age she
has the average fertility corresponding to that age group.
15. Incidentally, the growth in the percentage of the
working-age population capable of being economically active (relative to the
total population) has been ascribed a key role in the East Asian economic
miracle in conjunction with educational, health, and institutional measures to
realise the economic potential of this boom in the labour force. Thus the middle
phase of the demographic transition has important implications for economic
growth.
16. The importance of the percentage of working-age population
was brought out by Bloom and Williamson (1998).
17. The ‘demographic indicators for countries of the world,
1950-2050, medium variant’ (UN, 1996) estimates 9.37 billion in 2050.
18. Data are from John Holdren, Harvard University.
19. In one of the villages studied, fuelwood consumption
corresponded to about 217 tonnes of firewood per year; that is, about 0.6 tonnes
per day for the village, or 0.6 tonnes per year per capita.
20. Unlike in some rural areas of India, dung cakes are not used
as cooking fuel in the region studied. In situations where agro-wastes (such as
coconut husks) are not abundant, it appears that, if firewood is available
within some convenient range (determined by the capacity of head-load
transportation), dung cakes are never burnt as fuel. Instead dung is used as
manure.
21. This section is based on the paper prepared for this chapter
by Jonas Rabinovitch, senior urban development adviser, UNDP, with the
assistance of Raquel Wexler.
22. Apart from information provided by the U.S. Energy
Information Administration, an excellent article is Myerson (1998).
23. This section is based on the input of Kornelis Blok, Utrecht
University.
References
ASTRA (Centre for the Application of Science and Technology to
Rural Areas). 1982. “Rural Energy Consumption Patterns: A Field
Study.” Biomass 2 (4): 255-80.
Atiq R.A., N. Robins, and A. Roncerel, eds. 1998. Exploding
the Population Myth: Consumption versus Population - Which Is the Population
Bomb? Dhaka: Dhaka University Press.
Batliwala, S. 1982. “Rural Energy Scarcity and Nutrition: A
New Perspective.” Economic and Political Weekly 17 (9): 329-33.
Batliwala, S. 1984. “Rural Energy Situation: Consequences
for Women’s Health.” Socialist Health Review 1 (2): 75.
Batliwala, S. 1987. “Women’s Access to Food.”
Indian Journal of Social Work 48 (3): 255-71.
Batliwala, S., and A.K.N. Reddy. 1994. “Energy Consumption
and Population.” In Population: The Complex Reality. London: The
Royal Society.
Batliwala, S., and A.K.N. Reddy. 1996. “Energy for Women
and Women for Energy (Engendering Energy and Empowering Women).” Paper
presented at a meeting of Energia: Women and Energy Network, 4-5 June,
University of Twente, Enschede, Netherlands.
Bloom, D.E., and J.G. Williamson. 1998. “Demographic
Transitions and Economic Miracles in Emerging Asia.” The World Bank
Economic Review 12 (3): 419-55.
Bloom, D.E., and A. Zaidi. 1999. “Energy-Population
Linkages in Developing Countries.” Paper presented at World Energy
Assessment Lead Authors Meeting, London, March.
Bloom, D.E., P. Craig, and P. Malaney. 2000. The Quality of
Life in Rural Asia. Hong Kong: Oxford University Press.
Center for International Comparisons at the University of
Pennsylvania. 2000. Penn World Table, http://pwt.econ.upenn.edu/
Coale, A.J. 1973. “The Demographic Transition
Reconsidered.” Paper presented at International Population Conference,
Ličge, Belgium.
Coale, A.J. 1983. “Recent Trends in Fertility in Less
Developed Countries.” Science 221: 828-32.
Dasgupta, P.S. 1993. Scientific American: 26-31.
De Almeida, E., and A. de Oliveira. 1995. “Brazilian Life
Style and Energy Consumption.” In Energy Demand, Life Style Changes and
Technology Development. London: World Energy Council.
Goldemberg, J., T.B. Johansson, A.K.N. Reddy, and R.H. Williams.
1985. “Basic Needs and Much More with One Kilowatt per Capita.”
Ambio 14 (4-5): 190-200.
Goldemberg, J., T.B. Johansson, A.K.N. Reddy, and R.H. Williams.
1988. Energy for a Sustainable World. New Delhi: Wiley-Eastern.
Government of India. 1988. Shramshakti Report. Report of the
National Commission of Self-Employed Women and Women in the Informal Sector.
New Delhi.
Hosier, R.H., and J. Dowd. 1987. “Household Fuel Choice in
Zimbabwe: An Empirical Test of the Energy Ladder Hypothesis.” Resources
and Energy 13 (9): 347-61.
IEA (International Energy Agency). 1997. Indicators of Energy
Use and Energy Efficiency. Paris.
Leach, G. 1992. “The Energy Transition.” Energy
Policy 20 (2): 116-23.
Myerson, A.R. 1998. “U.S. Splurging on Energy after Falling
Off Its Diet.” New York Times, 22 October: A1.
Nakicenovic, N., and A. John. 1991. “CO2
Reduction and Removal: Measures for the Next Century.” Energy, the
International Journal 16: 1347-77.
Nathan, D. 1997. “Economic Factors in Adoption of Improved
Stoves.” Wood Energy News 12 (1): 16-18.
Rabinovitch, J. 1993. “Urban Public Transport Management in
Curitiba, Brazil.” UNEP Industry and Environment (January-June):
18-20.
Ramakrishna, J. 1992. “Improved Stoves, Time, Fuel:
Implications for the Nutrition and Health of Women and Children.”
Boiling Point 27: 4-6.
Reddy, A.K.N., and B.S. Reddy, 1994. “Substitution of
Energy Carriers for Cooking in Bangalore.” Energy 19 (5): 561-71.
Roberts, P.C. 1975. “Energy Analysis in Modelling.” In
I.M. Blair, B.D. Jones, and A.J. van Horn, eds., Aspects of Energy
Conversion. Oxford: Pergamon Press.
Sen, A. 1994. “Population: Delusion and Reality.”
New York Review of Books 41 (15): 1-8.
Smith, K.R. 1993. “Fuel Combustion, Air Pollution Exposure,
and Health: The Situation in Developing Countries.” Annual Review of
Energy and Environment 18: 529-66.
UN (United Nations). 1993a. Energy Statistics Yearbook
1993. New York.
UN (United Nations). 1993b. Report of the United Nations
Conference on Environment and Development (UNCED), Agenda 21. Document
A/Conf. 151/26/Rev. 1., Vol. 1. New York.
UN (United Nations). 1996. Habitat Agenda and Istanbul
Declaration. New York: United Nations Department of Public Information.
UNDP (United Nations Development Programme). 1995. Human
Development Report 1995. New Delhi: Oxford University Press.
UNDP (United Nations Development Programme). 1996. Human
Development Report 1996. New Delhi: Oxford University Press.
UNDP (United Nations Development Programme). 1997a. Energy
after Rio: Prospects and Challenges. New York: UNDP, in collaboration with
International Energy Initiative, Stockholm Environment Institute, and United
Nations Conference on Environment and Development.
UNDP (United Nations Development Programme). 1997b. Human
Development Report 1997. New Delhi: Oxford University Press.
UNDP (United Nations Development Programme). 1998. Human
Development Report 1998. New Delhi: Oxford University Press.
Viklund, E., ed. 1989. Nordic Seminar on Domestic Energy in
Developing Countries: A Seminar Report. Publication 31. Lund University,
Lund Centre for Habitat Studies, Sweden.
Vringer, K., and K. Blok. 1995. “The Direct and Indirect
Energy Requirement of Households in the Netherlands.” Energy Policy
23: 893-910.
Vringer, K., T. Gerlach, and K. Blok. 1997. “The Direct and
Indirect Energy Requirement of Netherlands’ Households in 1995 [in
Dutch].” Utrecht University, Department of Science, Technology and Society,
Utrecht, Netherlands.
WHO (World Health Organisation). 1992. Epidemiological,
Social, and Technical Aspects of Indoor Air Pollution from Biomass Fuels: Report
of a WHO Consultation, June 1991. Geneva.
World Bank. 1998. World Development Indicators 1998.
Washington,
D.C.
Chapter 3. Energy, the Environment, and Health
John P. Holdren (United States)
Kirk R.
Smith (United States)
LEAD AUTHORS: Tord Kjellstrom (New Zealand),
David Streets (United States), and Xiaodong Wang (China)
CONTRIBUTING AUTHORS: Susan Fischer (United States), Donna
Green (Australia), Emi Nagata (Japan), and Jennifer Slotnick (United States)
MAJOR REVIEWERS: Jyoti Parikh (India) and Yasmin Von
Schirnding (South Africa)
|
ABSTRACT
In this chapter, the principal environmental and health
impacts of energy are discussed according to the scale at which they
occur. About half of the world’s households use solid fuels (biomass
and coal) for cooking and heating in simple devices that produce large amounts
of air pollution-pollution that is probably responsible for 4-5 percent of the
global burden of disease. The chief ecosystem impacts relate to charcoal
production and fuelwood harvesting.
At the workplace scale, solid-fuel fuel cycles create
significant risks for workers and have the largest impacts on populations among
energy systems. In communities, fuel use is the main cause of urban air
pollution, though there is substantial variation among cities in the relative
contributions of vehicles and stationary sources. Diesel-fuelled vehicles, which
are more prominent in developing countries, pose a growing challenge for urban
health. The chief ecosystem impacts result from large-scale hydropower projects
in forests, although surface mining causes significant damage in some areas.
At the regional scale, fine particles and ozone are
the most widespread health-damaging pollutants from energy use, and can extend
hundreds of kilometres from their sources. Similarly, nitrogen and sulphur
emissions lead to acid deposition far from their sources. Such deposition is
associated with damage to forests, soils, and lakes in various parts of the
world. At the global scale, energy systems account for two-thirds of
human-generated greenhouse gas increases. Thus energy use is the human activity
most closely linked to potential climate change. Climate change is feared to
have significant direct impacts on human health and on ecosystems.
There are important opportunities for ‘no regrets’
strategies that achieve benefits at more than one scale. For example, if
greenhouse gas controls are targeted to reduce solid fuel use in households and
other energy systems with large health impacts (such as vehicle fleets),
significant improvements can occur at the local, community, regional, and global
scales. |
The harvesting, processing, distribution, and use of fuels and
other sources of energy have major environmental implications. Insults include
major land-use changes due to fuel cycles such as coal, biomass, and hydropower,
which have implications for the natural as well as human environment.1
Perhaps the most important insult from energy systems is the routine and
accidental release of pollutants. Human activities disperse a wide variety of
biologically and climatologically active elements and compounds into the
atmosphere, surface waters, and soil at rates far beyond the natural flows of
these substances. The results of these alterations include a 10-fold increasein
the acidity of rain and snow over millions of square kilometres and significant
changes in the global composition of the stratosphere (upper atmosphere) and
troposphere (lower atmosphere).
The rough proportions of various pollutants released into the
environment by human activities are shown in table 3.1. Note the importance of
energy supply systems, both industrial and traditional, in the mobilisation of
such toxic substances as sulphur oxides and particles as well as in the release
of carbon dioxide, the principal greenhouse gas. Also shown is the human
disruption index for each substance, which is the ratio of the amount released
by human activities to natural releases. This indicates that together with other
human activities, energy systems are significantly affecting the cycling of
important chemical species at the global scale. Although by themselves these
indexes do not demonstrate that these insults are translated into negative
impacts, their magnitudes provide warning that such impacts could be
considerable.
In the past hundred years most of these phenomena have grown
from local perturbations to global disruptions. The environmental transition of
the 20th century-driven by more than 20-fold growth in the use of fossil fuels
and augmented by a tripling in the use of traditional energy forms such as
biomass-has amounted to no less than the emergence of civilisation as a global
ecological and geochemical force.
The impacts from energy systems, however, occur from the
household to the global scale. Indeed, at every scale the environmental impacts
of human energy production and use account for a significant portion of human
impacts on the environment.
This chapter examines the insults and impacts of energy systems
according to the scale at which the principal dynamics occur-meaning the scale
at which it makes the most sense to monitor, evaluate, and control the insults
that lead to environmental impacts. In addition, some cross-scale problems are
considered to illustrate the need to control insults occurring at one scale
because of the impacts they have at other scales. Impacts are divided into two
broad categories: those directly affecting human health (environmental health
impacts) and those indirectly affecting human welfare through impacts on the
natural environment (ecosystem impacts).
Because of their ubiquity and size, energy systems influence
nearly every category of environmental insult and impact. Indeed, large
multiple-volume treatises have been devoted to discussing the environmental
problem of just part of the energy system in single countries (as with U.S.
electric power production in ORNL and RFF, 1992-98). A detailed review of the
environmental connections of energy systems world-wide is beyond the scope of
this volume. Indeed, simply cataloguing the routes of insults and types of
impacts of energy systems world-wide would take substantially more space than is
available here, even if accompanied by little comment.
|
Because of their ubiquity and
size, energy systems
influence
nearly every category of
environmental insult
and impact.
|
In addition, for three other reasons reproducing catalogues
involving simple listings of insults and impacts for each of the many types of
energy systems would not serve the interests of readers. First, many detailed
studies in recent years have done this job much better than we could here. Thus
we will cite a range of such material to enable interested readers to expand
their understanding. In addition, there is a substantial amount of such
information in other chapters, for example, on the environmental and health
impacts of renewable energy systems in chapter 7 and of fossil and nuclear power
systems in chapter 8. Chapter 8 also addresses the technological implications of
reducing urban pollution according to changes in local willingness to pay for
health improvements. Chapter 1 discusses some of the relationships between
environment and energy development, and chapter 9 has much discussion of the
implications of various future energy scenarios for greenhouse gas emissions.
The second reason relates to our desire to help readers
understand the relative importance of the problems. The significance of known
environmental impacts from energy systems varies by orders of magnitude, from
the measurable but minuscule to the planet-threatening. Just as the other
chapters in this volume must focus on just a few of the most important energy
system issues for the next half-century, we must do so for environmental
impacts.
Finally, we feel that it is as important to give readers a
framework for thinking about environmental impacts as it is to document current
knowledge about individual problems. Thus we have devoted much of our effort to
laying out the problems in a systematic manner using scale as the organising
principle. Near the end of the chapter we also discuss two of the most common
analytical frameworks for making aggregate comparisons involving a range of
environmental impacts from energy systems: economic valuation and comparative
risk assessment using fuel-cycle analysis.
Given space limitations and the reasons summarised above, we
focus below on the two or three most important environmental insults and impacts
at each scale. This approach brings what may seem to be a geographic bias as
well-examples at each scale tend to be focused not only on the most important
problems but also on the places in the world where the problems are most severe.
We recognise that there are innumerable other impacts and places that could be
mentioned as well, but we offer this set as candidates for those that ought to
have the highest priority in the next few decades.
Indeed, if these environmental problems were brought under
control, the world would have moved most of the way towards a sustainable energy
future from an environmental standpoint.
This chapter focuses almost entirely on the environmental
insults and impacts associated with today’s energy systems, in line with
this report’s goal of exploring the sustainability of current practices. In
later chapters, as part of efforts to examine the feasibility of advanced energy
conversion technologies, new sources of energy, and enhanced end-use
efficiencies, the potential environmental impacts of future energy systems are
explored.
TABLE 3.1. ENVIRONMENTAL INSULTS DUE TO HUMAN ACTIVITIES BY
SECTOR, MID-1990S
|
Insult |
Natural baseline (tonnes a year) |
Human disruption indexa |
Share of human disruption caused by |
|
|
|
Commercial energy supply |
Traditional energy supply |
Agriculture |
Manufacturing, other |
|
Lead emissions to atmosphereb |
12,000 |
18 |
41% (fossil fuel burning, including additives) |
Negligible |
Negligible |
59% (metal processing, manufacturing, refuse burning) |
|
Oil added to oceans |
200,000 |
10 |
44% (petroleum harvesting, processing, and transport) |
Negligible |
Negligible |
56% (disposal of oil wastes, including motor oil changes)
|
|
Cadmium emissions to atmosphere |
1,400 |
5.4 |
13% (fossil fuel burning) |
5% (traditional fuel burning) |
12% (agricultural burning) |
70% (metals processing, manufacturing, refuse burning) |
|
Sulphur emissions to atmosphere |
31 million (sulphur) |
2.7 |
85% (fossil fuel burning) |
0.5% (traditional fuel burning) |
1% (agricultural burning) |
13% (smelting, refuse burning) |
|
Methane flow to atmosphere |
160 million |
2.3 |
18% (fossil fuel harvesting and processing) |
5% (traditional fuel burning) |
65% (rice paddies, domestic animals, land clearing) |
12% (landfills) |
|
Nitrogen fixation(as nitrogen oxide and ammonium)c
|
140 million (nitrogen) |
1.5 |
30% (fossil fuel burning) |
2% (traditional fuel burning) |
67% (fertiliser, agricultural burning) |
1% (refuse burning) |
|
Mercury emissions to atmosphere |
2,500 |
1.4 |
20% (fossil fuel burning) |
1% (traditional fuel burning) |
2% (agricultural burning) |
77% (metals processing, manufacturing, refuse burning) |
|
Nitrous oxide flows to atmosphere |
33 million |
0.5 |
12% (fossil fuel burning) |
8% (traditional fuel burning) |
80% (fertiliser, land clearing, aquifer disruption) |
Negligible |
|
Particulate emissions to atmosphere |
3,100 milliond |
0.12 |
35% (fossil fuel burning) |
10% (traditional fuel burning) |
40% (agricultural burning) |
15% (smelting, non-agricultural land clearing, refuse) |
|
Non-methane hydrocarbon emissions to atmosphere |
1,000 million |
0.12 |
35% (fossil fuel processing and burning) |
5% (traditional fuel burning) |
40% (agricultural burning) |
20% (non-agricultural land clearing, refuse burning) |
|
Carbon dioxide flows to atmosphere |
150 billion (carbon) |
0.05e |
75% (fossil fuel burning) |
3% (net deforestation for fuelwood) |
15% (net deforestation for land clearing) |
7% (net deforestation for lumber, cement manufacturing) |
Note: The magnitude of the insult is only one factor
determining the size of the actual environmental impact. a. The human disruption
index is the ratio of human-generated flow to the natural (baseline) flow. b.
The automotive portion of anthropogenic lead emissions in the mid-1990s is
assumed to be 50 percent of global automotive emissions in the early 1990s. c.
Calculated from total nitrogen fixation minus that from nitrous oxide. d. Dry
mass. e. Although seemingly small, because of the long atmospheric lifetime and
other characteristics of carbon dioxide, this slight imbalance in natural flows
is causing a 0.4 percent annual increase in the global atmospheric concentration
of carbon dioxide.
Source: Updated from Holdren, 1992 using Houghton
and others, 1994; IPCC, 1996b; Johnson and Derwent, 1996; Lelieveld and others,
1997; Nriagu, 1989, 1990; Smithsonian Institution, 1996; Smith and Flegal, 1995;
and WRI,
1998.
Household scale
The oldest human energy technology, the home cooking fire,
persists as the most prevalent fuel-using technology in the world. For much of
the world’s population, the home cooking fire accounts for most direct
energy demand. Household fuel demand accounts for more than half of energy
demand in most countries with per capita incomes under $1,000 (see figure 2.1).
The ‘energy ladder’ is a useful framework for
examining trends and impacts of household fuel use (see figure 10.1). The ladder
ranks household fuels along a spectrum running from simple biomass fuels (dung,
crop residues, wood) through fossil fuels (kerosene and gas) to the most modern
form (electricity). The fuel-stove combinations that represent rungs in the
ladder tend to become cleaner, more efficient, more storable, and more
controllable in moving up the ladder.2 But capital costs and
dependence on centralised fuel cycles also tend to increase in moving up the
ladder (OTA, 1992).
Although there are local exceptions, history has generally shown
that when alternatives are affordable and available, populations tend to move up
the ladder to higher-quality fuel-stove combinations. Although all of humanity
had its start a quarter of a million years ago at the top of the energy ladder
in those times (wood), only about half has moved up to higher-quality rungs
(figure 3.1). The remaining half is either still using wood or has been forced
by local wood shortages down the ladder to crop residues, dung, or, in some
severe situations, to the poorest-quality fuels such as shrubs and grass.
Throughout history in places where coal is easily available,
local wood shortages have led some populations to move to coal for household
use. This shift occurred about a thousand years ago in the United Kingdom, for
example, although it is relatively uncommon there today (Brimblecome, 1987). In
the past 150 years such transitions occurred in Eastern Europe and China, where
coal use still persists in millions of households (see figure 3.1). In terms of
the energy ladder, coal represents an upward movement in terms of efficiency and
storability. Because of these characteristics and its higher energy densities,
it is possible to ship coal economically over longer distances than wood and to
efficiently supply urban markets. In these senses, coal is like other household
fossil fuels. Unlike kerosene and gas, however, coal is often a dirtier fuel
than wood.
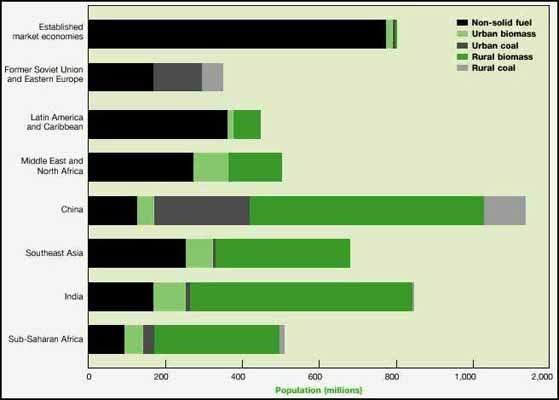
FIGURE 3.1. POPULATION AND
HOUSEHOLD FUEL USE BY REGION, 1995
Source: Updated from Reddy, Williams, and
Johansson,
1997.
Harvesting
The chief environmental impacts of household fuel cycles relate
to harvesting and combustion. In the 1970s books and newspapers called attention
to the ‘other’ energy crisis, referring to the growing and alarming
shortage of woodfuel affecting a large fraction of the world population that
depended on it. Since deforestation and desertification were often also
occurring in such places, it was perhaps a logical conclusion that fuel demand
was to blame. It is still common today to read that deforestation is caused by
fuel gathering in rural areas of developing countries. Detailed studies in many
areas around the world, however, have rarely documented cases in which fuel
demand is a significant cause of deforestation. The most important cause by far
seems to be expansion of agricultural lands, followed by lumbering and road
building. Indeed, the causation is more often the reverse-that is, the shortage
of fuelwood is due to deforestation, rather than the other way around.
Part of the misunderstanding stems from the assumption that
rural households gather woodfuel from forests. In many areas villagers gather
significant amounts of fuelwood from what Gerald Leach has called
‘invisible trees’-the trees around fields, next to houses, along
roads, and so on that do not show up in most satellite remote sensing surveys or
national forest statistics. Thus when estimates of local fuelwood demand appear
to exceed growth rates in local forests, it does not necessarily imply that
deforestation is taking place. Conversely, if deforestation is known to be
occurring, it does not mean that fuel demand is necessarily the reason.
Similarly, desertification in the Sahel and elsewhere in
Sub-Saharan Africa has links to fuel demand. But it has been difficult to
separate out the influence of all the relevant factors, including climate
change, intensification of grazing, land-use shifts, and fuel harvesting.
Nevertheless, as with deforestation, there are some poor areas where harvesting
of wood and brush plays an important role.
|
BOX 3.1. HEALTH-DAMAGING POLLUTANTS IN SOLID FUEL SMOKE
FROM HOUSEHOLD STOVES IN INDIA
Biomass smoke
· Small particles,
carbon monoxide, nitrogen dioxide.
· Formaldehyde, acrolein,
benzene, 1,3-butadiene, toluene, styrene, and so on.
· Polyaromatic hydrocarbons such
as benzo(a)pyrene.
Coal smoke
· All the above
plus, depending on coal quality, sulphur oxides and such toxic elements as
arsenic, lead, fluorine, and mercury. |
|
|
Physical form and contaminant
content are the two
characteristics
of fuels that most affect
their pollutant
emissions
when burned. |
Although the link between fuelwood harvesting and deforestation
is far from universal, there are localised cases in which fuelwood demand seems
to contribute significantly to forest depletion. Most prominent among these are
places, mainly in Sub-Saharan Africa, where commercial charcoal production is
practised. In these areas temporary kilns (legal or illegal) in forested areas
are used until local wood resources are depleted, then moved or rebuilt
elsewhere. Charcoal, being a relatively high-quality and high-density fuel, can
be trucked economically across long distances to urban markets. Thus large
charcoal-using cities can have ‘wood sheds’ extending hundreds of
kilometres along roadways, though there is evidence that significant regrowth
often occurs over long enough periods. In some arid and semiarid areas,
harvesting by woodfuel traders to meet urban demand seems to contribute to
forest depletion, although, again, regrowth is often occurring. The quality of
regrowth in terms of biodiversity and other ecosystem parameters is not well
documented, however.
The harvesting of dung and crop residues as fuel does not have
much direct environmental impact. But in some areas it may deprive local soils
of needed nutrients and other conditioners. Indeed, in most rural areas the use
of dung as fuel rather than fertiliser is probably a sign of poverty and lack of
fuel alternatives. Crop residues, on the other hand, consist of a wide variety
of materials, many of which do not have much value as fertiliser or soil
conditioner. Indeed, in some cases disposal becomes a serious problem if these
residues are not gathered for fuel. In these cases the usual practice is to burn
the residues in place on the fields, with consequent pollution implications
(although sometimes with benefits in terms of pest control). Consequently,
regardless of development level, air pollution from post-harvest burning of
farmland is a significant seasonal source of air pollution in many agricultural
areas around the world (see chapter 10). Harvesting and preparation of household
biomass fuels also have occupational health impacts on women and children, due,
for example, to heavy loads and burns (see the section on workplace scale,
below).
Combustion
It is generally difficult to pre-mix solid fuels sufficiently
with air to assure good combustion in simple small-scale devices such as
household stoves. Consequently, even though most biomass fuels contain few
noxious contaminants, they are usually burned incompletely in household stoves
and so produce a wide range of health-damaging pollutants (box 3.1). Wood and
other biomass fuels would produce little other than non-toxic products, carbon
dioxide, and water when combusted completely. But in practice sometimes as much
as one-fifth of the fuel carbon is diverted to products of incomplete
combustion, many of which are important health-damaging pollutants.

FIGURE 3.2A. ENERGY FLOWS IN A
TYPICAL WOOD-FIRED COOKING STOVE
Source: Smith and others, 2000
a.

FIGURE 3.2B. INDOOR
CONCENTRATIONS OF HEALTH-DAMAGING POLLUTANTS FROM A TYPICAL WOOD-FIRED COOKING
STOVE
Note: Dozens of other health-damaging pollutants are
known to be in woodsmoke. Mg/m3 stands for milligrams per cubic
metre. Numbers in parentheses are typical standards set to protect health.
Source: Smith and others, 2000 a.

FIGURE 3.2C. GREENHOUSE GAS
EMISSIONS FROM A TYPICAL BIOMASS COOKSTOVE
Note: Numbers in parentheses are carbon dioxide
equivalents of non-carbon dioxide gases.
Source: Smith and others, 2000 a.
Coal, on the other hand, is not only difficult to burn
completely because it is solid, but also often contains significant intrinsic
contaminants that add to its emissions of health-damaging pollutants. Most
prominent among such emissions are sulphur oxides (see box 3.1). But in many
areas coal also contains arsenic, fluorine, and other toxic elements that can
lead to serious health-damaging pollutants. Tens of millions of people in China,
for example, are exposed to such pollutants from household coal use.
Petroleum-based liquid and gaseous fuels, such as kerosene and
liquefied petroleum gas, can also contain sulphur and other contaminants, though
in much smaller amounts than in many coals. In addition, their physical forms
allow much better pre-mixing with air in simple devices, assuring much higher
combustion efficiencies and lower emissions of health-damaging pollutants in the
form of products of incomplete combustion. Furthermore, stoves for
petroleum-based liquid and gaseous fuels are much more energy efficient than
those for coal. As a result emissions of health-damaging pollutants per meal
from these fuels are at least an order of magnitude less than those from solid
fuels (Smith and others, 2000a).
Not only do solid-fuel stoves produce substantial emissions of
health-damaging pollutants per meal, but a large fraction do not have chimneys
for removing the emissions from the home. Consequently, indoor concentrations of
health-damaging pollutants can reach very high levels. Figure 3.2a shows the
energy flows of a typical wood-fired cooking stove, in which a large fraction of
the fuel energy is lost because of low combustion efficiency or low transfer of
the heat to the pot. Figure 3.2b shows the excessive pollutant levels commonly
reached in these circumstances, well beyond World Health Organization
guidelines. Even in households with chimneys, however, heavily polluting
solid-fuel stoves can produce significant local outdoor pollution. This is
particularly true in dense urban slums, where such ‘neighbourhood’
pollution can be much higher than average urban pollution levels.
To estimate the health damage from pollution, it is necessary to
take into account the amount of pollution released. Equally important, however,
is the behaviour of the population at risk. Even a large amount of pollution
will not have much health impact if little of it reaches people. But a
relatively small amount of pollution can have a big health impact if it is
released at the times and places where people are present, such that a large
fraction is breathed in. Thus it is necessary to look not only at where the
pollution is but also at where the people are.
Unfortunately, pollution from household stoves is released right
at the times and places where people are present-that is, in every household
every day. This is the formula for high pollution exposures: significant amounts
of pollution often released in poorly ventilated spaces at just the times when
people are present. Moreover, because of their nearly universal responsibility
for cooking, women and their youngest children are generally the most exposed.
Thus, although the total amount of health-damaging pollution
released from stoves world-wide is not high relative to that from large-scale
use of fossil fuels, human exposures to a number of important pollutants are
much larger than those created by outdoor pollution. As a result the health
effects can be expected to be higher as well.
In many ways the harvesting impacts and air pollution from use
of biomass fuels are the result of fuel shortages, particularly where inferior
forms (dung and crop residues) are in use. Thus these can be considered part of
the health effects of too little energy, along with lower nutrition and chilling
(box 3.2).
|
BOX 3.2. HEALTH EFFECTS OF TOO LITTLE WOODFUEL
Lack of sufficient fuel for heating and cooking has several
negative health impacts. First, in many places women and children must walk
further and work harder to gather fuel, using more energy and time and placing
themselves at increased risk of assault and natural hazards such as leeches and
snakes. In addition, nutrition can be negatively affected if families have to
walk long distances to gather cooking fuel. When seasonal changes result in
longer fuel collection times, families are unable to compensate by reducing the
time spent on agricultural activities. Instead the time is subtracted from
resting and food preparation.
Inferior fuels, such as twigs and grass, that are used as
substitutes in times of shortage require more attention from women during
cooking, keeping them from other tasks. These fuels also produce more
health-damaging smoke and are inadequate for processing more nutritious foods
such as cereals and beans (since they have long cooking times). The figure at
right outlines some coping strategies adopted by households to deal with fuel
shortages and their health consequences.
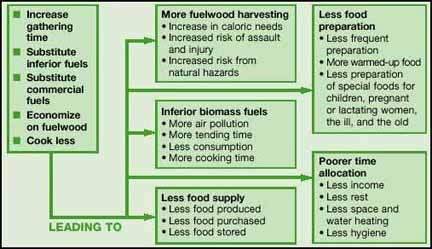
Household coping strategies for
fuelwood shortages
Source: Agarwal, 1985; Brouwer, 1994. |
|
|
BOX 3.3. NATIONAL BURDEN OF DISEASE FROM HOUSEHOLD SOLID
FUEL USE IN INDIA
National surveys, including the 1991 national census, show that
nearly 80% of Indian households use biomass as their primary cooking fuel. As a
result, a large portion of the Indian population is potentially exposed to
indoor and outdoor levels of pollution produced by cooking stoves. Based on
risks derived solely from studies of the health effects of individual diseases
occurring in biomass-using households in developing countries, many in India
itself, it is possible to estimate the total national burden of disease in India
from use of these fuels:
Acute respiratory infection. More than a dozen studies
around the world have found that household use of solid fuels is associated with
acute respiratory infection in young children (although, as with all the
diseases discussed here, there are other important risk factors, including
malnutrition and crowding). Acute respiratory infection is the leading cause of
death of the world’s children and the largest category of ill health in the
world in terms of disease burden. Almost 9 percent of the global burden of ill
health and 12 percent of India’s is due to acute respiratory infection.
Acute respiratory infection linked to solid fuel use is estimated to cause
290,000-440,000 premature deaths a year in Indian children under 5.
Tuberculosis has been associated with household solid
fuel use in a national survey in India involving nearly 90,000 households as
well as in smaller studies. Although this relationship is not yet established
with complete certainty, it would be highly significant because tuberculosis is
on the rise in many developing countries due to HIV infection and the increase
in drug-resistant strains. In India 50,000-130,000 cases of tuberculosis in
women under 15 are associated with solid fuel use.
Chronic respiratory disease, such as chronic bronchitis,
is almost entirely due to smoking in the industrialised world. But studies in
Asia and Latin America have found the chronic respiratory disease develops in
women after long years of cooking with solid fuels. In India 19,000-34,000 women
under 45 suffer from chronic respiratory disease linked to solid fuel use.
Lung cancer, which is also dominated by smoking in
industrialised countries, has been found to result from long-term exposure to
cooking with coal in more than 20 studies in China. No such effect has been
shown for biomass fuels, however. In India 400-800 women under 45 suffer from
lung cancer linked to solid fuel use; the number is small because households
rarely use coal.
Cardiovascular (heart) disease. Although there are
apparently no studies in biomass-using households, studies of urban air
pollution suggest that in India 50,000-190,000 women under 30 suffer from
pollution-related heart disease.
Adverse pregnancy outcomes. Stillbirth and low
birthweight have been associated with solid fuel use by pregnant women in Latin
America and India. Low birthweight is a big problem in developing countries
because it is a risk factor for a range of health problems. In India, however,
there are too few studies to calculate the impacts of solid fuel use on adverse
pregnancy outcomes.
Total. Because there is more uncertainty in the estimates
for tuberculosis and heart disease, only the low ends of the estimated ranges
are used. In India 410,000-570,000 premature deaths a year in women and
children, of 5.8 million total, seem to be due to biomass fuel use. Given the
age distribution of these deaths and the associated days of illness involved,
5-6 percent of the national burden of disease in women and young children can be
attributed to biomass fuel use in households. For comparison, about 10 percent
of the Indian national burden of disease is attributed to lack of clean water
and sanitation. |
Source: Smith, 2000; Smith and others, 2000;
Murray and Lopez,
1996.
Estimated health effects
Considering the sizes of the relevant populations and the
exposures to health-damaging pollutants, there has been relatively little
scientific investigation of the health effects of indoor air pollution in
developing countries relative to studies of outdoor air pollution in cities.
Nevertheless, enough has been done to enable rough estimates of the total impact
of air pollution, at least for women and young children (who suffer the highest
exposures).
Four main types of health effects are thought to occur, based on
studies in households that use solid fuels and corroborated by studies of active
and passive smoking and outdoor air pollution (Smith, 1998):
· Infectious
respiratory diseases such as acute respiratory infections and tuberculosis.
· Chronic respiratory diseases
such as chronic bronchitis and lung cancer.
· Adverse pregnancy outcomes
such as stillbirth and low birth-weight in babies born to women exposed during
pregnancy.
· Blindness, asthma, and heart
disease (less evidence to date).
The best estimates of such effects for developing countries have
been done for India (box 3.3). These indicate that household solid fuel use
causes about 500,000 premature deaths a year in women and children under 5. This
is 5-6 percent of the national burden of ill health, or 6-9 percent of the
burden for these two population groups.3 This is comparable to,
though somewhat less than, the estimated national health impacts of poor water
and sanitation at the household level-and more than the national burdens of such
major health hazards as malaria, tuberculosis, tobacco, AIDS, heart disease, or
cancer (Murray and Lopez, 1996).
Given that India contains about one-quarter of the world’s
solid-fuel cooking stoves, the global impact could be expected to be about four
times larger, or about 2 million deaths a year in women and children. This is
roughly compatible with World Health Organization estimates of about 2.5
million, estimates that were generated by extrapolating studies from
industrialised country cities to developing country conditions (WHO, 1997). The
global burden of disease from major risk factors, including indoor air
pollution, is shown in figure
3.3.
Greenhouse gases
The same incomplete combustion processes that produce emissions
of health-damaging pollutants from household solid-fuel stoves also produce
greenhouse gas emissions. (Greenhouse gas emissions and their global impacts are
described below, in the section on the global scale.) A large amount of fuel
carbon is typically diverted to gaseous products of incomplete combustion, all
of which cause greater global warming per carbon atom than would be the case if
complete combustion occurred and all the carbon was released as carbon dioxide
(see figure 3.2c). The most powerful of these is methane, which over a 20-year
period causes more than 20 times the global warming from the same amount of
carbon as carbon dioxide (equivalent to a discount rate of about 4 percent).
Greenhouse gas emissions from several of the most important
household fuels in developing countries (as measured in India) are shown in
figure 3.4. Because of significant emissions of non-carbon dioxide greenhouse
gases, solid biomass fuels, even though renewable, can have a larger greenhouse
gas commitment per meal than fossil fuels, kerosene, and liquefied petroleum
gas. These relationships have several important policy implications:
· Even if renewably
harvested, many biomass fuel cycles are not greenhouse gas neutral because of
their substantial production of products of incomplete combustion.
· In some situations, therefore,
substitution of fossil fuels for renewable biomass might be recommended to
reduce greenhouse gas emissions.
· To be greenhouse gas neutral,
biomass fuel cycles must be based on renewable harvesting and must have close to
100 percent combustion efficiency (which most do not in their current
configurations).
· Improved biomass stoves should
be designed to increase overall efficiency and to reduce combustion
inefficiency, which is the cause of greenhouse gas and health-damaging
pollutants.
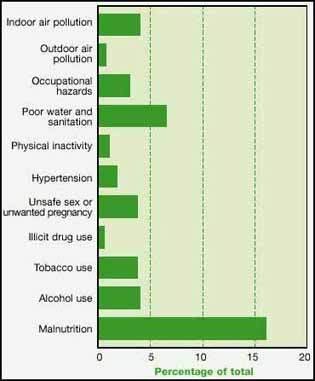
FIGURE 3.3. GLOBAL BURDEN OF
DISEASE FROM SELECTED MAJOR RISK FACTORS, 1995
Note: Burden of indoor air pollution extrapolated
from data for India.
Source: Smith, 2000; Murray and Lopez,
1996.
Stoves using biogas, which is made in household or village
anaerobic digesters from dung (see chapter 10), have by far the least greenhouse
gas emissions per meal-only about 10 percent of those for liquefied petroleum
gas and a factor of 80 less than the average stove burning dung directly (see
figure 3.4). A complete comparison of these fuel-stove combinations would
require evaluating greenhouse gas emissions over the entire fuel cycle in each
case, for example, including methane leaking from biogas digesters and releases
from oil refineries making kerosene. Nevertheless, the extremely low greenhouse
gas emissions from biogas stoves illustrate the potentially great advantage for
greenhouse gas emissions of processed biomass fuels such as biogas. Such fuels
can be both renewably harvested as well as burned as liquids or gases with high
combustion efficiency. (The section on cross-scale impacts, below, discusses
some of the potential opportunities for reducing impacts at the household and
global scales through improvements in household cooking.)
Reducing the human health and global warming impacts of
household stoves will require better stoves with higher efficiency, lower
emissions, and cleaner fuels. These issues are discussed in chapter 10. Of
course, the largest greenhouse gas emissions are from energy systems used in
industrialised countries, as discussed in later
sections.
Workplace scale
The extraction, transport, use, and waste management of energy
sources involve important health hazards related to the work and workplaces
involved in these activities. Many of the jobs involved, such as forestry and
mining for solid fuels, are particularly dangerous. Many workers are engaged in
these jobs, particularly in countries that are rapidly developing their
industries and the energy sources that the industries require. In addition, much
of the work needed for household energy supply in developing countries is
carried out as a household task that does not figure in national statistics as
an ‘occupational issue’.
This section analyses these health issues based on the type of
energy source and give examples of how the effects have been documented in
different countries. The fourth edition of the International Labour
Organisation’s Encyclopaedia of Occupational Safety and Health
(Stellman, 1998) provides additional detail about energy jobs and their health
hazards.
Biomass
As noted, wood, crop residues, dung, and the like are common
energy sources for poor households in developing countries. Wood is also still
widely used in industrialised countries, in some cases promoted in the interest
of reducing greenhouse gas emissions. Wood and agricultural waste are often
collected by women and children (Sims, 1994). Such collection is part of daily
survival activities, which also include water hauling, food processing, and
cooking (see chapters 2 and 10). An analysis in four developing countries found
that women spend 9-12 hours a week on these activities, while men spend 5-8
hours (Reddy, Williams, and Johansson, 1997). Women’s role in firewood
collection is most prominent in Nepal (2.4 hours a day for women and 0.8 hours
for men).
Firewood collection may be combined with harvesting of wood for
local use in construction and small-scale cottage industry manufacturing. This
subsistence work is often seasonal, unpaid, and not recorded in national
economic accounts. Globally about 16 million people are involved in forestry
(Poschen, 1998), more than 14 million of them in developing countries and 12.8
million in subsistence forestry.
A number of health hazards are associated with the basic
conditions of the forest. Forest workers have a high risk of insect bites,
stings from poisonous plants, leech infestation, cuts, falls, and drowning. In
tropical countries the heat and humidity put great strain on the body, while in
temperate countries the effects of cold are a potential hazard. The work is
outside, and in sunny countries ultraviolet radiation can be another health
hazard, increasing the risk of skin cancer and eye cataracts (WHO, 1994). All
forestry work is hard physical labour, with a risk of ergonomic damage such as
painful backs and joints as well as fatigue, which increases the risk of
injuries. Heavy loads of firewood contribute to ergonomic damage (Poschen,
1998). Women carrying heavy loads of firewood are a common sight in areas with
subsistence forestry (Sims, 1994). Falling trees, sharp tools, dangerous
machinery, and falls from heights are the main causes of injuries. In addition,
the living conditions of forestry workers are often poor, and workers may be
spending long periods in simple huts in the forest with limited protection
against the weather and poor sanitary facilities.
Urbanisation leads to the development of a commercial market for
firewood and larger-scale production of firewood from logs or from smaller waste
material left over after logs have been harvested. Energy forestry then becomes
more mechanised, exposing workers to additional hazards (Poschen, 1998).
Motorised hand tools (such as chain saws) become more common, resulting in high
risks of injuries, noise-induced hearing losses, and ‘white finger
disease’ caused by vibration of the hands. In addition, fertilisers and
pesticides become part of the production system, with the potential for
poisoning those who spray pesticides. As forestry develops further, more logging
becomes mechanised, with very large machinery reducing the direct contact
between workers and materials. Workers in highly mechanised forestry have only
15 percent of the injury risk of highly skilled forestry workers using chain
saws (Poschen, 1998). Still, firewood production remains an operation that
requires manual handling of the product at some stage and so tends to remain
hazardous.
Another health aspect of wood-based energy is the risk of
burning wood that has been treated against insect damage with copper-arsenic
compounds or that has been painted with lead paint. Such wood may be harder to
sell and so may be used to a greater extent by firewood production workers in
stoves and open fires. When burned, poisonous arsenic and lead compounds will be
emitted with the smoke. These compounds are health hazards when
inhaled.
Coal
Coal is a major global energy source, accounting for 23 percent
of total energy consumption. It was the primary energy source from 1900 until
1960, when it was overtaken by oil (WHO, 1997). Coal can be produced through
surface (open cast) mining or underground mining. Like mining in general, both
operations are inherently dangerous to the health of the workers. About 1
percent of the global workforce is engaged in mining, but these workers account
for 8 percent of the 15,000 fatal occupational accidents each year. Armstrong
and Menon (1998) offer a detailed review of occupational health and safety
issues in coal mining and other mining.
|
Pollution from household stoves
is released right at the
times and
places where people are present -
that is, in every
household
every day. |
Underground coal miners are exposed to the hazards of excavating
and transporting materials underground. These hazards include injuries from
falling rocks and falls into mine shafts, as well as injuries from machinery
used in the mine. There are no reliable data on injuries of this type from
developing countries (Jennings, 1998), but in industrialised countries miners
have some of the highest rates of compensation for injuries - and the situation
is likely to be worse in developing countries. In addition, much of the
excavation involves drilling into silica-based rock, creating high levels of
silica dust inside the mine. Pneumoconiosis silicosis is therefore a common
health effect in coal miners (Jennings, 1998).
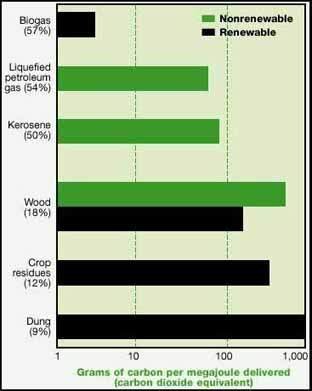
FIGURE 3.4. GREENHOUSE GAS
EMISSIONS FROM HOUSEHOLD FUELS
Note: Includes warming from all greenhouse gases
emitted: carbon dioxide, methane, carbon monoxide, non-methane hydrocarbons, and
nitrous oxide. Weighted by stove distribution in India. Numbers in parentheses
are average stove energy efficiency.
Source: Smith and others, 2000 b.
Other health hazards specific to underground coal mining include
coal dust, which can cause ‘coal worker’s pneumoconiosis’ or
anthracosis, often combined with silicosis. Coal dust is explosive, and
explosions in underground coal mines are a constant danger for coal miners. Coal
inherently burns, and fires in coal mines are notuncommon. Once such a fire has
started, it may be almost impossible to extinguish. Apart from the danger of
burns, the production of smoke and toxic fumes create great health risks for the
miners.
Even without fires, the coal material produces toxic gases when
it is disturbed: carbon monoxide, carbon dioxide, and methane (Weeks, 1998).
Carbon monoxide is extremely toxic because it binds to haemoglobin in the blood,
blocking oxygen transport and creating chemical suffocation (Bascom and others,
1996). Carbon monoxide is a colourless and odourless gas and so gives no warning
before the symptoms of drowsiness, dizziness, headache, and unconsciousness
occur. Carbon dioxide, also colourless and odourless, displaces oxygen in
underground air and can also cause suffocation. Another health hazard in mining
is exhaust from the diesel engines used in underground machinery and transport
vehicles. This exhaust contains very fine particles, nitrogen oxides, and carbon
monoxide, all of which pose serious health hazards (Bascom and others, 1996).
Exposure to fine particles in diesel exhaust increases the risk of lung cancer
(Holgate and others, 1999).
Surface coal mining avoids some of the hazards of working
underground. Still, it involves the risk of injuries from machinery, falls, and
falling rocks. In addition, coal mining is energy-intensive work, and heat,
humidity, and other weather factors can affect workers’ health. The
machinery used is also noisy, and hearing loss is a common among miners. Another
health hazard is the often squalid conditions under which many coal workers and
their families in developing countries live, creating particular risk for the
diseases of poverty. In addition, such workers are likely to receive part of
their compensation in the form of coal for use as household fuel, with
consequent indoor and neighbourhood pollution.
After extraction, coal needs to be processed and transported to
residential areas, power stations, and industries. This creates other types of
occupational hazards (Armstrong and Menon, 1998). For instance, coal for
residential use is often ground and formed into briquettes. This work involves
high levels of coal dust as well as noise hazards. Loading, transportation, and
off-loading of large amounts of coal involves ergonomic, noise, and injury
hazards.
The large-scale use of coal in power stations and industry
creates yet more hazards. One is the conversion of coal to coke in steel
production. This process distils a large number of volatile polycyclic aromatic
hydrocarbons in coal, the so-called coal tar pitch volatiles (Moffit, 1998).
Exposure to these hydrocarbons puts coke oven workers at twice the lung cancer
risk of the general population (IARC, 1984). (This process is not entirely
associated with energy supply, as an important aim is to provide carbon to
reduce iron oxides to elemental iron.) Additional health hazards are created for
workers when the large amounts of ash produced by power stations and industry
need to be transported and deposited. Crane (1998) reviews the health hazards
faced by power generation workers.
|
Solid biomass fuels, even though
renewable, can have a
larger greenhouse
gas commitment per meal than
fossil fuels, kerosene,
and
liquefied petroleum gas. |
Oil and gas
Oil and gas exploration, drilling, extraction, processing, and
transport involve a number of the same hazards as mining: heavy workload,
ergonomic hazards, injury risk noise, vibration, and chemical exposures (Kraus,
1998). This work is often carried out in isolated areas with inclement weather
conditions. Long-distance commuting may also be involved, causing fatigue,
stress, and traffic accident risks.
The ergonomic hazards lead to risks of back pain and joint pain.
Injury hazards include burns and explosions. Skin damage from exposure to oil
and to chemicals used in drilling creates a need for well-designed protective
clothing. In addition, many oil and gas installations have used asbestos to
insulate pipes and equipment. Inhalation of asbestos dust in the installation
and repair of such equipment creates a risk of lung cancer, asbestosis, and
mesothelioma (WHO, 1998a).
A lot of exploration and drilling for oil and gas occur
offshore. This involves underwater diving, which is dangerous. In addition,
weather-related exposures can be extreme, particularly since the work often
requires round-the-clock operations (Kraus,
1998).
Hydropower and other renewables
Major hazards occur when a hydroelectric power station is built,
because this usually requires constructing a large dam, excavating underground
water channels, and building large structures to house the generator. McManus
(1998) lists 28 occupational hazards potentially involved in the construction
and operation of hydroelectric power stations. These include asbestos exposure,
diesel and welding fumes, work in confined spaces or awkward positions,
drowning, electrocution, noise, heat, electromagnetic fields, vibration,
weather-related problems, and chemical exposures from paints, oils, and PCBs
(polychlorinated biphenyls). As in any industry, however, proper attention to
health and safety can keep the risks to acceptable levels.
The manufacture of wind and solar power equipment involves the
typical hazards in manufacturing: injuries, noise, chemical exposures, and so
on. In addition, the technologies for solar electricity generation involve new
chemical compounds, some based on rare metals with poorly known toxic properties
(Crane,
1998).
Nuclear danger
Nuclear power generation has its own hazards due to the
radiation danger involved in mining, processing, and transporting uranium, as
well as the radiation in nuclear power stations. In addition, occupational
hazards will develop as countries start to deal with the backlog of radioactive
waste. Due to the major potential risk to the general public from a
malfunctioning nuclear power station, the safety of stations is always
paramount. This has contributed to a low average occupational health risk for
workers in the stations (Morison, 1998).
The mining of uranium has been an important occupational health
hazard in nuclear power generation, as underground mining for uranium often
entails high exposure to radon, a radioactive gas emitted from uranium. Radon
exposure leads to an increased risk of lung cancer. In addition, the same
occupational hazards in mining noted above occur, although the relatively high
energy content of uranium ore means that there are fewer health effects per unit
of electricity produced.
Until the Chernobyl accident, relatively few nuclear power
station workers had been affected by radiation exposure. In that accident,
however, 40 workers lost their lives in the fire or due to acute radiation
exposure. The long-term impact on workers exposed during the accident in the
form of cancer and other radiation-related effects is not yet known, however.
The clean-up after the accident may eventually create substantially more
effects. As many as 900,000 army, police, and other workers were called on to
take part. Many workers were needed because they were only allowed to work for a
short time, until they had reached the maximum allowable radiation dose. In some
cases this dose was reached in a few minutes. Studies are now being undertaken
to establish the exposure of each clean-up worker and the long-term health
impacts (WHO,
1996).
Number of workers and quantitative health effects estimates
It is difficult to estimate the number of workers involved in
meeting the energy requirements of communities. As noted, in poor communities
much of this work is carried out by family members, particularly women, who are
not formally employed. In addition, much of this work is carried out by small
industries that are not always recorded in national employment statistics.
As noted, an estimated 16 million people are involved in
forestry, most of them in developing countries. In industrialised countries with
reliable statistics, the occupational mortality rate for agricultural workers is
5-10 times the average for all workers (Kjellstrom, 1994). Because of the
additional risks in forestry, mortality rates for these workers are possibly
twice as high again, or 32,000-160,000 at a global level. Not all of this
activity is directly related to fuel demand, however.
As noted, miners are a large occupational group in international
statistics (UN Demographic Yearbooks). They represent up to 2 percent of the
economically active population in certain developing countries. Mining is an
extremely dangerous occupation. Recent data show that occupational mortality
rates for miners are up to 20 times the average for all occupations (ILO, 1998).
The range of mortality rates may be as wide as that for forestry (2-10 per 1,000
workers per year). In most countries the economically active population is 40-60
percent of the population over 15. Thus miners may account for 1 percent of the
population over 15, or about 30 million people world-wide. If half of these
miners are coal miners, the number of miners killed each year in accidents would
be about the same as for forestry workers (30,000-150,000). Another approach to
this calculation is through total coal production. If applied to the
world’s coal production today, about 70 percent of which is in developing
countries, the mean death rate in U.S. mines from 1890-1939 of 3.1 deaths per
million tons produced would predict 16,000 coal mining deaths a year world-wide
(ORNL and RFF, 1994a). This may be low, however, because China alone has about
6,500 coal mining deaths a year according to official statistics, which tend to
be incomplete (Horii, 1999). The estimate of 6,500 of 16,000 deaths, on the
other hand, is roughly consistent with China’s 30 percent share of global
production (BP, 1998).
For energy production and distribution as a whole, occupational
mortality may sum to 70,000-350,000 a year. These numbers are likely to exclude
many cases of occupational disease (such as cancers caused by asbestos or
radiation) and deaths among the many workers in informal workplaces. The upper
limit of the numbers, however, may also be inflated by the crude estimates of
mortality rates and number of workers. Occupational mortality rates in energy
jobs in industrialised countries are generally 10-30 times lower than in
developing countries (Kjellstrom, 1994; ILO, 1998), indicating that more
effective prevention programs could eliminate more than 90 percent of the deaths
referred to above. Still, energy-related jobs have inherent health risks that
need to be considered when assessing the full impact of energy production and
distribution.
Although too often ignored in discussions of environmental
health risks, the burden of occupational disease and injury is substantial on a
global scale. It is conservatively estimated that with well over 1 million
deaths a year, nearly 3 percent of the global burden of ill health is directly
attributable to occupational conditions (Leigh and others, 1996). This is
substantial, accounting for more than motor vehicles, malaria, or HIV and about
equal to tuberculosis or stroke. Although the fraction due directly to supplying
energy is unclear, energy systems employ many millions of people worldwide in
jobs substantially riskier than average-particularly in jobs producing solid
fuels.
Community scale
Energy systems are associated with a vast array of insults and
impacts (see table 3.1). Many of these are expressed at the community scale,
including problems associated with coal and uranium mining, petroleum and gas
extraction, water use and contamination by power plants, thermal pollution, and
noise from wind farms. Here we can only focus on the largest of these impacts
world-wide.
Urban air pollution is the chief environmental impact of energy
systems at the community level. Although there are industrial and other sources
of some pollutants, the vast bulk-whether measured by mass or by hazard-is
generated by fuel combustion or, as in the case of photochemical smog, is
created in the urban atmosphere by precursor chemicals largely released in the
course of fuel use. From the 1930s to the 1950s a number of urban air pollution
episodes in the industri-alised world brought air pollution to the attention of
the public. The first major improvements came by banning the burning of refuse
and coal within city limits. By the early 1970s the infamous London smogs (and
their parallels in other cities), caused by coal combustion, were memories. Two
other community-level impacts are also discussed in this section: those due to
large hydroelectric dams and to nuclear
power.
Fuel-derived air pollution in cities of industrialised countries
During the past 25 years the cities of the industrialised world
have generally brought energy-derived urban air pollutants under even greater
control. In the United States, for example, emissions per unit of useful energy
from power plants and automobiles-the two largest urban energy polluters-have
fallen 65 percent and 50 percent in health hazard (weighted by the relative
standards for each pollutant).4 Japan and Western Europe have
achieved similar results.
In the power sector these achievements have mostly come about by
relying more on nuclear power and natural gas and by requiring smokestack
controls for particles and nitrogen and sulphur oxides at coal-fired power
plants. In addition, thermal power plants have become more efficient, and more
improvements are expected, particularly for those using gas (see chapter 8). For
vehicles, the reductions have come from a mix of improvements in engine
combustion, increases in fuel efficiency (in North America), and the nearly
universal requirement of catalytic converters (devices to help control pollutant
emissions). Thus, despite significant increases in power production and vehicle
use since 1975, overall emissions of most pollutants are now lower.
As a result of these emission reductions, urban air quality has
generally improved throughout the industrialised world. Although fuel combustion
produces a number of health-damaging pollutants, as explained above, small
particles are probably the best single indicator. Suspended small particles are
a mix of primary combustion particles-carbonaceous materials and associated
trace elements-and secondary conversion products such as sulphate and nitrate
aerosols. In many parts of the world, windblown and urban dust can also be
significant contributors to suspended particles.
Small particles are deposited deep in the lungs, where their
clearance is slow and their ability to cause damage is enhanced. Small particles
also carry adsorbed trace metals and carcinogenic hydrocarbons into the lungs,
intensifying the potential for health damage. Assessments of the human health
effects of air pollutants increasingly focus on these small particles. Still,
there are few measurements of these particles in most cities, although more
cities are measuring PM10 (particles less than 10 micrograms), which
is considered a better indicator than simple total particulate levels (National
Research Council, 1998).5 In the late 1990s the mean annual cocentration of
PM10 in North American, Western European, and Japanese cities ranged
from 30-45 micrograms per cubic metre (figure 3.5). (The U.S. standard is 50
micrograms per cubic metre.) In the 1960s particulate levels were probably two
to four times higher. (Small particles were not measured routinely until the
mid-1980s, so previous levels have to be inferred from measurements of total
particles.)
|
About 1 percent of the global
workforce is engaged in
mining,
but these workers account for
8 percent of the 15,000
fatal
occupational accidents
each year. |
Still, industrialised countries face a number of energy-related
air pollution challenges. Nitrogen dioxide and ozone levels exceed standards in
many cities, particularly in sunny cities with large auto fleets such as Los
Angeles (California) and Athens (Greece). The recent evidence suggesting that
small particles (less than 2.5 micrograms) may be even better indicators of ill
health than PM10 has led the United States to propose new regulations
aimed at PM2.5, potentially putting a number of cities out of
compliance. European countries are also considering such regulations. Since
long-term data are not widely available, it is not clear how much
PM2.5 levels have decreased in recent decades, partly because such
particles are transported over much larger areas than larger particles.
This focus on even smaller particles has brought diesel exhaust
particles under more scrutiny. Unlike gasoline, diesel produces a significant
amount of emissions of particles that are not only smaller but may have chemical
properties that make them more dangerous. This feature raises questions about
the future of diesel-fuelled vehicles, even though such vehicles can be slightly
more fuel-efficient and cost-effective than gasoline-fuelled vehicles. The
tendency for many countries to keep diesel prices low relative to gasoline-as a
means of assisting farming, fishing, and other industries-can artificially
promote diesel passenger vehicles. (See the section on cross-scale impacts,
below, for a discussion of the economic implications of diesel particle health
effects.)
Since the 1980s studies have seemed to indicate that there is no
threshold for the health effects of particle pollution. In other words, there no
longer seems to be an identifiable level that can be termed safe. All that can
be said is that the effect is lower at lower levels, but does not seem to
disappear even at the lowest (background) concentrations. Indeed, in the late
1990s European and global offices of the World Health Organization revised their
particle guidelines to reflect the absence of thresholds (figure 3.6).
Because it is rarely (if ever) practical to set a standard of
zero for pollutants with significant natural sources, standard setting is much
harder for pollutants with no threshold for significant effects. Policy-makers
must determine that the benefits of fuel combustion outweigh the extra mortality
produced by the resulting pollution-for example, that the 5 percent increase in
mortality ‘allowed’ by a PM10 standard of 50 micrograms per
cubic metre above background (see figure 3.6) is acceptable given the societal
advantages of fuel use. This is a difficult determination, and much more
politically difficult than endorsing a standard that has some scientific
validity of being below a ‘no effects’ level, which is how most
standards are set. The likely result will be continuous pressure to tighten
particle standards, with stronger incentives for lower particle emissions from
vehicles, power plants, and other fuel-using sources. Indeed, as discussed in
later chapters, emission reductions are the driving forces for new power and
transport technologies.
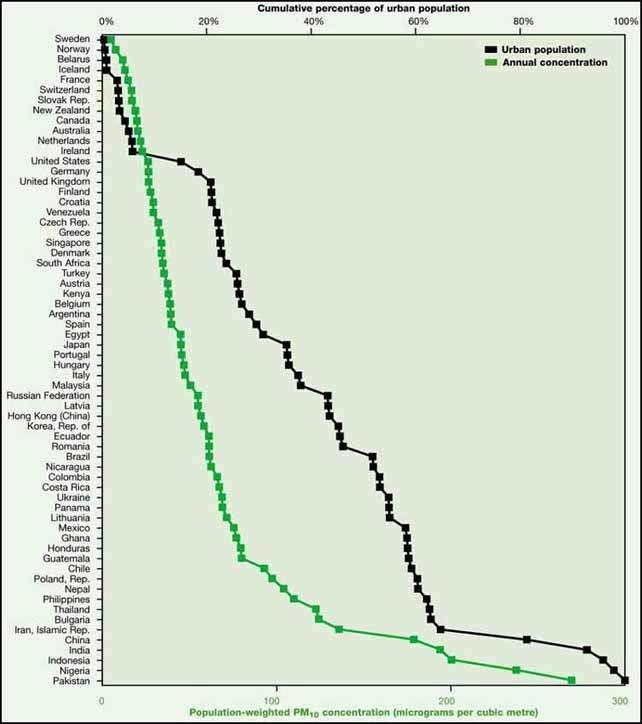
FIGURE 3.5. GLOBAL DISTRIBUTION OF
URBAN PM10 CONCENTRATIONS
Note: In many cases, PM10 levels have
been entirely estimated from measurements of total particles.
Source: WRI, 1998; WHO, 1998b.
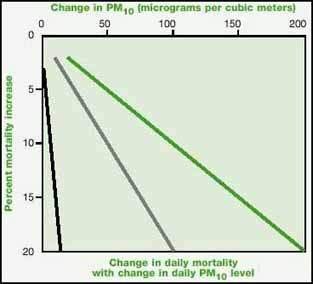
FIGURE 3.6. PROVISIONAL GLOBAL AIR
QUALITY GUIDELINES FOR PARTICLES
Source: WHO, 1999.
As recently as the early 1990s, the main source of lead
emissions throughout the world was tetra-ethyl-lead used as an additive to raise
octane in gasoline. But nearly every country now has a plan to remove lead from
gasoline (box 3.4). Still, significant numbers of children in many
industrialised and developing countries have blood lead levels above those
thought to affect cognitive development (intelligence). These levels will
decline as lead is removed from the rest of the world’s gasoline, although
industrial and other sources must be controlled as
well.
Fuel-derived air pollution in cities of developing countries
Developing country cities have much higher mean pollutant
concentrations than industrialised country cities (see figure 3.5). In cities in
China and India, averages seem to be nearly 200 micrograms per cubic metre of
PM10, though there is much variation by season and city. Such
concentrations must be causing significant premature deaths-perhaps 15 percent
or more above background levels. Indeed, estimates for premature mortality from
urban air pollution range from 170,000-290,000 a year in China (World Bank,
1997; Florig, 1997) and 90,000-200,000 in India (Murray and Lopez, 1996; Saksena
and Dayal, 1997).
|
BOX 3.4. GETTING THE LEAD OUT: A SLOW SUCCESS STORY
“The current consensus is that no amount of Pb [lead] in
the environment can be considered safe” (Schwela and Zali, 1999). Although
this was not the first reason to remove lead from gasoline, it soon became the
driving force. The introduction of catalytic converters spawned the need for
unleaded gasoline to protect the devices. Shortly after, concerns about the
health effects of lead emissions led to an increase in sales of unleaded gas and
a reduction in the lead content of leaded fuel. Since leaded gasoline has been
responsible for about 90 percent of lead emissions, it was the most logical
target for reduction (Lovei, 1998).
Many nations have taken action to phase out lead from fuel.
Canada, Japan, and the United States have completely phased out leaded gasoline
(Lovei, 1998; Schwela and Zali, 1999). Los Angeles (California) saw a 98 percent
reduction in the lead exposure of commuters between 1979 and 1989. In Western
Europe leaded gasoline has a very low lead content, and unleaded fuel has a
large market share in most countries. In addition, a few developing nations have
lowered or even banned lead in gasoline (Lovei, 1998).
Over the past 20 years Singapore has taken significant steps to
phase out lead in fuel. Between 1980 and 1987 the lead content of leaded
gasoline fell to a low 0.15 grams a litre. In 1991 unleaded petrol was
introduced and taxes were changed to make it cheaper than leaded fuel. By the
end of 1997 unleaded fuel accounted for about 75 percent of gasoline sales. In
addition, more stringent exhaust emission standards were implemented for
gasoline-fuelled vehicles, promoting an unleaded fuel market. Finally, oil
companies agreed to phase out leaded gasoline by July 1998.
Mexico has also taken steps to reduce the lead content of fuel,
though it still has far to go. Since 1994 the lead content of leaded fuel has
been cut to 0.15 grams a litre. But it appears that the Mexican National
Petroleum Co. has recently raised lead levels. No government agency has the
authority to ensure fuel quality, making enforcement of low lead levels a
challenge. Unleaded gasoline accounts for 46 percent of sales in Mexico City and
84 percent in Monterrey (which is wealthier and closer to the U.S. border).
Leaded fuel is still cheaper, however. Mexico is implementing new standards
requiring catalytic converters and so unleaded gas.
But large problems remain in many developing countries. The
biggest lead problems are in Africa and in petroleum-exporting nations. These
countries, including Venezuela and those in the Middle East, are dominated by
powerful oil companies and state-owned refineries.
Although in 1994 two-thirds of global gasoline sales were
unleaded, additional efforts are needed. Several mechanisms can encourage the
reduction of lead in gasoline. The most promising is to set fuel taxes so that
unleaded gasoline is cheaper than leaded fuel. Fuel filler inlets should be
required in automobiles to allow only the narrower nozzles of unleaded fuel
pumps to be used. Requiring catalytic converters in vehicles would further
decrease the use of leaded fuel. Emphasising other benefits of using unleaded
gasoline, such as lower exhaust emissions of hydrocarbons, also promotes the
reduction of lead in gasoline (Schwela and Zali, 1999). Finally, as shown in
Brazil, it is possible to substitute 5-10 percent ethanol for lead as an octane
booster, thereby promoting renewable fuels.
An enduring urban myth exists that some older cars need lead to
operate well. As long as the fuel has the correct octane level, no engine needs
lead. Indeed, in many cases the removal of lead will have direct benefits in the
form of less engine maintenance. The persistence of this myth slows the
introduction of low-lead fuels despite technical evidence to the contrary. |
The causes of air pollution in developing country cities are
much more varied than in industrialised countries. Although automobile ownership
rates are much lower, there tend to be many other types of vehicles as well,
including two- and three-wheelers using highly polluting two-stoke engines.
There also tend to be larger portions of light-duty and heavy-duty vehicles
using diesel rather than gasoline. In addition to power plants and large
industries with limited pollution controls, developing country cities tend to
have large numbers of small boilers, engines, and open fires in the commercial
and light-industry sectors, as well as in informal sectors such as street food.
These enterprises tend to rely on the most inexpensive and thus dirty fuels in
inefficient applications without pollution controls-and so have high emissions
per unit of useful energy.
Furthermore, such cities often do not have adequate refuse and
garbage collection, leading to street-side trash burning, a highly polluting
activity. Even when collected, trash often burns uncontrollably in landfills in
or near cities, wasting potential energy and producing clouds of noxious
emissions. Another major non-energy source of particle pollution in many cities
is dust from construction sites and unmanaged empty land. Finally, unlike in
industrialised countries, a large fraction of urban households in developing
countries still use solid fuels for cooking and space heating in inefficient
stoves with no pollution controls (see figure 3.1). Although individually small,
their large number means that these stoves can contribute significantly to urban
pollution.
In addition to dealing with trash, dust, and other non-energy
issues, the most pressing need for pollution control in developing country
cities is to reduce and eventually eliminate small- and medium-scale combustion
of dirty fuels. For stationary sources, this means shifting away from solid
fuels (coal and biomass) and high-sulphur fuels of any kind. For mobile sources,
it means dealing soon with, in order of priority, two-stroke engines, poorly
operating diesel engines, and gasoline-fuelled vehicles without catalytic
converters. In addition, as is happening in Bangkok (Thailand) and New Delhi
(India), there is great advantage in shifting vehicle fleets (taxis, buses,
government vehicles) to clean-burning gaseous fuels such as compressed natural
gas or liquefied petroleum gas (Mage and Zali,
1992).
Urban pollution control in the longer run
Because the best commercial technology in terms of energy
efficiency and emissions has not been deployed completely in industrialised
countries and has been used little in developing countries, much improvement is
possible in the next 20 years without switching to advanced technologies. In the
longer term, however, if air pollution levels are to be brought down to and kept
at low levels given the projected increase in population, urbanisation, economic
activity, and energy use, it will be necessary to develop and deploy new, even
cleaner and more efficient energy-using technologies. A number of advanced power
plant technologies potentially offer such performance (see chapter 8).
|
Dams affect Earth
at scales rivalling other major
human
activities, such as
urbanisation and
road building. |
In addition, some near-commercial vehicle technologies may allow
vehicle densities in developing country cities to grow for several decades and
still meet air quality goals (box 3.5). Strong pollution controls will be needed
to bring these technologies into wide use, however.
In addition to technical changes in vehicles of all types (not
just private cars), a range of other improvements will be needed if the
world’s cities are to accommodate the greater demand for transport that
increases in population and income will bring. These include improvements that
result in significant and sustained enhancement in the attractiveness of public
transport, land-use planning to reduce the need for intraurban trips, and
implementation of policy tools such as time-of-day, congestion, and central-zone
pricing. In addition, significant switches to public transport might occur
through such means as including the cost of vehicle insurance in the price of
fuel and taxing employer-provided parking as income (see chapter
11).
Hydroelectric dams6
Dams, large and small, have brought tremendous benefits to many
regions, including important contributions to development in industrialised
countries. It is important not to deny these benefits to developing countries.
But such dams need to be designed and constructed with care. Although dams
frequently serve many purposes-including flood control, irrigation, navigation,
and recreation-major dams (those over 150 metres high, with 25 cubic kilometres
of storage, or 1,000 megawatts of electricity) tend to have hydropower as one of
the their main objectives. Such dams often have big impacts on the environment.
There are more than 300 major dams world-wide, and nearly all have hydropower as
a major component of their function. The environmental impact per unit of
electricity production, however, can often be smaller for large than for small
dams. The type rather than the size can be the most important factor (Gleick,
1992).
With a total capacity of about 640,000 megawatts of electricity,
hydropower provides about one-fifth of the world’s electricity (Gleick,
1992). In Central and South America hydropower provides about 60 percent of
electricity; in Asia this figure is about 15 percent. Itaipu, on the border of
Brazil and Paraguay, is the most powerful hydropower dam built to date, with a
capacity of 12,600 megawatts of electricity. It cost $20 billion to build. When
finished, China’s Three Gorges Dam will produce about 18,200 megawatts of
electricity and may cost as much as $75 billion (The Economist, 1999).
Thus hydroelectric dams are the most expensive energy projects in the world.
No major river in the world is without existing or planned
hydroelectric dams. Nearly four-fifths of the discharge of the largest rivers in
Canada, Europe, the former Soviet Union, and the United States are strongly or
moderately affected by flow regulation, diversions, and the fragmentation of
river channels by dams (Dynesius and Nilsson, 1994). More than 500,000 square
kilometres-the area of Spain-have been inundated by dam reservoirs world-wide,
though not all for hydropower (Collier, Webb, and Schmidt, 1996). (Indeed, many
hydropower plants have no reservoirs.) Globally, about 200 cubic kilometres of
water a year-about 7 percent of the freshwater consumed by human activities-are
evaporated from the surface of reservoirs due to their increased exposed surface
area (Shiklomanov, 1998). Thus dams affect Earth at scales rivalling other major
human activities, such as urbanisation and road building.
Direct human impacts. During the 20th century 30-60
million people were flooded off their lands by dams (Dunn, 1998). The World
Bank, using Chinese government figures, estimates that 10.2 million people were
displaced by reservoirs in China between 1950 and 1989 (World Bank, 1993). Given
that a number of major dams are under construction or planned in developing
countries, there will be no slackening in the pace of population displacement.
China’s Three Gorges Dam, for example, is expected to displace more than 1
million people, and the proposed Pa Mong Dam between Lao PDR and Thailand is
expected to displace more than 500,000 (Gleick, 1998).
Large population resettlements can have a number of direct
social and health impacts. The social and cultural stress, loss of income,
disruption of traditional support services, and other problems facing displaced
populations often lead to lowered health status. Even when efforts are made to
resettle people in new areas, it is difficult to locate land of similar
productivity because other groups are likely to already occupy the best areas.
Some 13,500 people have been swept to their deaths by the 200 or so dams
(outside China) that have collapsed or been overtopped in the 20th century. In
1975 in Henan, China, about 230,000 people died from a series of dam bursts
(Gleick, 1998).
|
BOX 3.5. ALTERNATIVE VEHICLES
With growing energy and environmental concerns surrounding
today’s conventional vehicles, a great deal of research is going into
alternative vehicles. Four main types of alternative vehicles have the potential
to reduce the environmental and efficiency deficits of conventional vehicles and
to become commercially available in the near future. Electric vehicles are
powered by rechargeable batteries and have no internal combustion engines. The
battery, which can be made of lead-acid, nickel-metal hydride, and
lithium-polymer, can be recharged at home or, in the future, at recharging
stations.
Electric vehicles have several environmental benefits relative
to conventional vehicles, including no tailpipe emissions and lower hydrocarbon,
carbon monoxide, and nitrogen oxide emissions (including emissions from the
production of electricity). Other advantages include lower maintenance costs and
the elimination of the need for complicated tailpipe emission controls.
But electric vehicles also have several disadvantages, such as
the environmental concerns of an increase in electricity use, increasing
emissions of sulphur oxides, and possible contamination from the disposal and
recycling of batteries. There are also disadvantages in terms of convenience and
cost, such as lengthy recharging and lack of infrastructure for recharging
stations, short driving ranges (though electric vehicles are good for local
trips and commuting for two-car households), an inability to maintain high
speeds, and high battery costs. Today electric vehicles cost about $30,000,
which is too expensive for most markets.
Hybrid electric vehicles combine the battery and electric motor
of an electric vehicle with the internal combustion engine and fuel tank of a
conventional vehicle, to obtain the benefits from both technologies. The engine,
which is much smaller than that in a conventional vehicle, operates at a
constant power load and so is more efficient, and less polluting, and generates
only the power required for most operations. Hybrid electric vehicles have
several advantages over conventional vehicles and fewer disavantages than
electric vehicles. Hybrid electric vehicles have higher fuel economy and lower
emissions than vehicles with internal combustion engines, and better range and
more rapid refuelling than electric vehicles. Hybrid electric vehicles also
reduce petroleum consumption and increase energy diversity by using alternative
engines, which can use a range of fuels. But hybrid electric vehicles are still
expensive and not yet fully developed. Programs are in place to develop and
improve hybrid electric vehicles, and several automobile manufacturers are or
will soon be marketing models.
Compressed natural gas vehicles are powered by an abundant,
inexpensive fuel composed largely of methane. Natural gas is a clean-burning
fuel with lower carbon dioxide, carbon monoxide, hydrocarbon, and nitrous oxide
emissions than gasoline. This is partly due to the lower carbon content per unit
of energy in natural gas relative to other fossil fuels. In addition to its
environmental benefits, natural gas vehicles are cheaper to maintain, requiring
service less frequently than conventional vehicles as well as having a lower
cost of refuelling. Converting vehicle fleets such as taxis, three-wheelers, and
buses to natural gas is an important interim way to improve air quality in
developing country cities. Conversion costs are relatively small, although
baggage space is reduced because of the need to add pressurised tanks. It is
hard to use compressed natural gas for private vehicles because of the need to
create many fuelling stations. Urban vehicle fleets, on the other hand, can
operate with relatively few centralised fuelling stations.
Fuel-cell vehicles operate by combining hydrogen and oxygen
gases into an electrochemical device, a cell, that converts them into water and
electricity without using combustion. The hydrogen gas can come from a number of
sources, including multiple forms of pure hydrogen and a variety of hydrocarbon
fuels. Fuel-cell vehicles have many advantages over conventional vehicles. Fuel
cells have a much greater engine efficiency and fuel economy, drastically reduce
pollution emissions (including greenhouse gas emissions), and can use a wide
variety of fuels, promoting energy diversity.
In addition, they are quieter and smoother in operation, have
tested at high performance levels, have long driving ranges, and have about the
same operating costs as conventional automobiles. Still, there are several
drawbacks to fuel-cell vehicles, including the lack of infrastructure to
distribute hydrogen or another fuel (unless gasoline is used), difficult storage
of pure hydrogen, and possible safety concerns. Major automobile companies are
planning to have commercially available fuel-cell vehicles by 2004 and are
currently demonstrating prototypes and improving on them. Large cost reductions
need to occur, however, and fuel infrastructure issues must be resolved before
fuel-cell vehicles are ready for the marketplace.
Of these four alternatives to conventional vehicles, electric
vehicles have the fewest barriers to market entry. But they probably have the
least consumer appeal in terms of environmental improvements and convenience.
Fuel-cell vehicles will probably be found to be the most environmentally
friendly, but they are the furthest from commercial development. Hybrid electric
vehicles also offer a good option in the near future, with convenience and
environmental benefits. All these cars will likely begin to enter the market in
the next 5-10 years, and infrastructure will have to be built to accommodate all
of them as well as today’s automobiles. |
Source: American Honda Motor Company, 1999;
California Energy Commission, 1998; California Environmental Protection Agency,
1999; Ford Motor Company, 1998, 2000; General Motors Corporation, 1999; Global
Toyota, 1999; Gould and Golob, 1997; Hanisch, 1999; Krebs, 1999; Kremer, 2000;
Mark, Ohi, and Hudson, 1994; Matsumoto, Inaba, and Yanagisawa, 1997; Mendler,
1997; National Fuel Cell Research Center, 1999; Natural Gas Vehicle Coalition.
2000a, b; Neil, 1999; Steinbugler and Williams, 1998; USDOE, 1995; USEPA, 1994,
1998b
TABLE 3.2. ECOLOGICAL INSULTS AND IMPACTS OF LARGE DAMS
|
Insult caused by dam |
Impacts seen |
Severity of impact |
Example of impact |
|
Changes in the chemical properties of release water |
Deterioration of downstream ecosystem cased by inability to
process the increased dissolved minerals |
Depends on the sensitivity of the affected ecosystem(tropical
ecosystems are especially sensitive) |
Enhanced algae growth in the reservoir consumes the oxygen in
the epilimnion and, as it decays, the mass sinks to the already oxygen-deficient
hypolimnion, where decay processes reduce the oxygen concentration even further,
resulting in acid conditions at lower levels and the dissolution of minerals
from the reservoir bed. |
|
Changes in the thermal properties of release water |
Thermal pollution often results in species diversity reduction,
species extinction, and productivity changes in the reservoir |
Diversity, biomass, distribution, and density of fish stocks can
be affected, disrupting breeding cycles |
Productivity levels in the surface waters of new reservoirs
often increase before long-term declines occur (Horne, 1994). China’s Three
Gorges Dam may be the final critical factor for driving to extinction the
Yangtze River dolphin. |
|
Changes in the flow rate and timing of release water |
Erosion increases downstream of dam. Settling of sediments in
the reservoir causes high sediment loads to be picked up in the area immediately
below the dam |
Erosion of natural riverbeds can disturb the nurseries and
spawning of many aquatic organisms, disturbing their breeding cycles |
Changes in the downstream river morphology and ecosystem
productivity. |
|
Changes in the sediment load of the river |
High trap efficiencies of dams prevent the natural processes of
sediments and associated nutrients refreshing downstream soils |
Effects often noticed most severely in high-productivity areas
downstream from the dam that no longer receive annual fertilisation |
Before the Aswan High Dam was constructed, the Nile carried
about 124 million tonnes of sediment to the sea each year, depositing nearly 10
million tonnes on the floodplain and the delta. Today 98 percent of the sediment
remains behind the dam, resulting in a drop in soil productivity and depth,
among other serious changes to Egypt’s floodplain agriculture (Pottinger,
1997). |
|
Changes in the dynamics of downstream riverbeds |
Increased likelihood of lower water tables, which can create
problems in areas near the dam where groundwater is a major source |
Reduced access to potable water is a huge problem in many
developing countries |
Within nine years of the closure opening of the Hoover Dam, 110
million cubic metres of material had been washed away from the first 145
kilometres of riverbed below the dam (McCully, 1996). |
|
Changes in the coastal area morphology |
The loss of sediment in the rivers flowing through deltas and
into the sea often results in a gradual process of delta and coastal degradation
|
Financially expensive for many areas where there is a large
population living near the coastal zone. |
Over the past 80 years dams have reduced by four-fifths the
sediment reaching the coasts of southern California. This has reduced the beach
cover at the base of cliffs along these shorelines, causing cliffs to collapse
(Jenkins and others, 1988). |
Disease can spread from vectors that thrive in secondary dam
systems, such as irrigation canals and even dam reservoirs. Mosquitoes carrying
malaria, for example, have thrived in conditions created by dams. The parasitic
disease schistosomiasis has also become more prevalent through the creation of
habitats for snails that act as the disease vector. Nearby populations, for
example, suffered nearly universal infection after several large African dams
were filled, including Aswan (Egypt), Akosombo (Ghana), and Sennar (Sudan)
(Nash, 1993).
Ecosystem impacts. An internal survey of World Bank
hydroelectric dam projects found that 58 percent were planned and built without
any consideration of downstream impacts-even when these impacts could be
predicted to cause coastal erosion, pollution, and other problems (Dixon, 1989).
The main ecological insults and impacts of large dams (not just those producing
hydropower) are summarised in table 3.2.
Dams and greenhouse gases. The work assessing the impacts
of dams on greenhouse gas emissions is incomplete, but some estimates have been
made. The most immediate changes are in the carbon flow between the flooded
vegetation and the atmosphere. The decomposition of plants and soils causes the
gradual release of their stored carbon (Rudd and others, 1993).
From a greenhouse gas standpoint, it might be thought that
vegetation decaying in a reservoir would be no worse than the same amount of
deforestation. Because of the low-oxygen conditions near and in the bottoms of
many reservoirs, however, relative to deforestation a larger fraction of the
biomass carbon is likely to be released as methane rather than as carbon
dioxide. Since methane is a much more powerful greenhouse gas than carbon
dioxide, the global warming impacts are greater than the same amount of carbon
released as carbon dioxide.
The peak greenhouse gas emissions, however, are unlikely to
rival those of a similarly sized fossil power plant, emissions from which would
not decrease with age like those from a reservoir. In addition, it is difficult
to determine the baseline in tropical forests-that is, how much methane and
other non-carbon dioxide greenhouse gases are released in natural conditions. In
colder climates reservoirs apparently emit greenhouse gases at much lower rates
(Gagnon,
1998).
Nuclear power
There are two main environmental concerns about nuclear power,
both mostly with regard to its potential impacts on human health. One involves
the highly radioactive products produced by nuclear fission inside power
reactors. Such products require careful management at the reactor and during and
after disposal. The other concern revolves around the weapons-grade plutonium or
uranium that might be clandestinely derived from the nuclear power fuel cycle to
make bombs or other weapons of mass destruction by nations or subnational groups
(see chapter 8).
The routine (non-accidental) emissions of pollutants from the
harvesting, processing, and conversion of nuclear fuels are not negligible. And
more than many technologies, they are vulnerable to being enhanced by
mismanagement. Still, the impacts of these emissions are generally substantially
less than those involved with producing power with current coal technologies,
the chief competitor in many areas. Although involving different pollutants,
routine emissions from nuclear power systems are probably no more dangerous than
those from new natural gas power systems-with the important exception of carbon
dioxide, which is not produced by nuclear power. If public concerns about
reactor safety, proliferation, and waste disposal can be satisfied, nuclear
power may be able to play a significant role in de-carbonising the world energy
system in the next 50 years (see chapter
8).
Regional scale
Nested between local-scale issues-such as the health effects of
urban pollution-and global-scale issues-such as climate change-are a number of
regional-scale problems that affect human health and ecosystems over areas the
size of countries and continents. The most important regional-scale issues are
acid deposition, tropospheric ozone, and suspended fine particles.
Matched with the regional spatial scale is a temporal scale that
requires air pollutants to remain aloft for periods ranging from days to weeks
and thereby be transported by prevailing winds and transformed by chemical
reactions. Gases and fine particles meet this criterion; larger particles
(greater than 1 micron or so in diameter) tend to settle out quickly and are
considered contributors to local, rather than regional, impacts. Fine particles
may be solid (such as elemental ‘black’ carbon) or liquid (such as
aerosol droplets).
Contributing to regional pollution are a number of precursor
species, most of which are generated by the use of fossil fuels and biofuels.
Prominent among them are sulphur dioxide (SO2) and nitrogen oxides
(NOx). Sulphur dioxide is released during the combustion of the
sulphur found naturally in fossil fuels, while nitrogen oxides originate either
as fuel nitrogen or as atmospheric nitrogen oxidised during combustion. Other
species of importance are particulate matter (PM), carbon monoxide (CO), methane
(CH4), and non-methane volatile organic compounds (NMVOC), released
during incomplete combustion and other activities. Ammonia (NH3) is a
significant regional pollutant, but fuel combustion is not its primary source.
TABLE 3.3. ANTHROPOGENIC EMISSIONS OF IMPORTANT SPECIES BY
REGION, 1990 (MILLIONS OF TONNES)
|
Region |
Sulphur dioxide as sulphur) |
Nitrogen oxides as nitrogen) |
Carbon monoxide |
Non-methane volatile organic compounds |
Methane |
|
Energy- related |
Non- energy- related |
Energy- related |
Non- energy- related |
Energy- related |
Non- energy- related |
Energy- related |
Non- energy- related |
Energy- |
Non- |
|
Western Europe |
8.8 |
2.5 |
3.6 |
0.4 |
45 |
23 |
10.1 |
7.6 |
5.5 |
18.0 |
|
Eastern Europe and former Soviet Union |
13.5 |
3.4 |
3.5 |
0.6 |
47 |
36 |
13.9 |
6.2 |
37.6 |
20.3 |
|
North America |
11.6 |
0.7 |
7.6 |
0.3 |
82 |
24 |
13.2 |
8.7 |
23.9 |
21.5 |
|
Asia |
17.9 |
3.0 |
5.6 |
1.9 |
165 |
132 |
30.7 |
24.2 |
25.7 |
98.6 |
|
Rest of world |
8.8 |
4.1 |
3.2 |
4.4 |
105 |
316 |
31.7 |
31.2 |
15.5 |
54.0 |
|
Total |
60.6 |
13.6 |
23.5 |
7.6 |
444 |
531 |
99.6 |
77.9 |
108.2 |
212.3 |
|
74.2 |
31.1 |
975 |
177.5 |
320.4 |
Note: These numbers are slightly different from
those in table 3.1 because of different assumptions and methods. Energy-related
sources include the combustion, extraction, processing, and distribution of
fossil fuels and biofuels. Non-energy-related sources include industrial
processes, deforestation, savannah burning, agricultural waste burning, and
uncontrolled waste burning.
Source: Olivier and others, 1996.
When emissions of these primary species are released into the
atmosphere, they form a complex, reactive ‘soup,’ the chemical and
physical behaviour of which is determined by such factors as temperature,
humidity, and sunlight. The primary species are transported and deposited,
influencing the health of humans and of natural ecosystems. But these primary
species are also transformed into secondary species-such as sulphate, nitrate,
acids, ozone, and miscellaneous organic compounds-that can have effects even
more damaging than their precursors and in areas far removed from the primary
sources. This can lead to transboundary problems, where a country or regionhas
little control over the emissions that damage its
environment.
Emissions and energy
A snapshot of global and regional anthropogenic (human-caused)
emissions in 1990 is provided in table 3.3. The emissions are partitioned into
those derived from energy-related activities (including combustion, extraction,
processing, and distribution of fossil fuels and biofuels) and those derived
from non-energy activities (which have a wide variety of sources, including
industrial processes, deforestation, savannah burning, agricultural waste
burning, and uncontrolled waste burning). Non-anthropogenic sources (volcanoes,
soils) are not included.
Energy activities account for 82 percent of anthropogenic
emissions of sulphur dioxide and 76 percent for nitrogen oxides. Energy
activities play a less dominant role for the three other species-56 percent for
non-methane volatile organic compounds, 46 percent for carbon monoxide, and 34
percent for methane. The smaller role of energy in emissions of these three
species reflects the important contributions of deforestation, savannah burning,
and agricultural waste burning in the generation of products of incomplete
combustion, coupled with rice cultivation and enteric fermentation in the case
of methane. Nevertheless, table 3.3 demonstrates the critical contribution of
energy to emissions of regional-scale pollutants. It also highlights the
importance of the developing world in current patterns of regional emissions.
Sulphur dioxide and nitrogen oxides play a role in the formation
of acid deposition, because they can be transformed to acids in the atmosphere.
The transformation products are fine particles, solid or aerosol, in the form of
sulphates and nitrates. In addition, nitrogen oxides are a major precursor to
the formation of regional tropospheric ozone. Finally, sulphates and nitrates
have the ability to scatter and absorb radiation and so contribute to global and
regional climate change, probably with a net cooling effect.
Carbon monoxide is an important regional atmospheric pollutant
from several perspectives. It acts as an indirect greenhouse gas with a
potential for global warming (see above, in the section on greenhouse gases) on
a 20-year time horizon of about 4.5 due to its influence on the atmospheric
lifetime of methane (IPCC, 1990). In addition, carbon monoxide is toxic to
humans and is a critical component of many photo-chemical reactions in the
atmosphere. It is a scavenger of hydroxyl radicals and so influences the
production of ozone. There are many relatively easy ways to reduce carbon
monoxide emissions-catalytic converters for automobiles, improved household
stoves, and reuse of carbon monoxide gas in industry.
|
Energy activities account
for 82 percent of
anthropogenic
emissions of sulphur dioxide
and 76 percent for
nitrogen
oxides |
Non-methane volatile organic compounds consist of a variety of
chemical species. In China, for example, the mix of organic compounds is 46
percent paraffins, 32 percent olefins, 21 percent aromatics, and 1 percent
aldehydes (Piccot, Watson, and Jones, 1992). These compounds are important in
the chemistry of the atmosphere because of their influence on the formation and
destruction of ozone and methane. Non-methane volatile organic compounds are a
product of the incomplete combustion of fossil fuels, biofuels, and other
carbonaceous materials. They are also emitted during the extraction, processing,
and handling of gaseous and liquid fossil fuels. And they are released through
the evaporation of miscellaneous organic products in industry and households.
Ammonia is a significant component of regional emissions. Being
an alkaline substance, it neutralises acids in the atmosphere. But once it is
deposited on land, it can be converted to acid through biochemical processes in
the soil. Ammonia emissions are largely derived from animal waste, fertiliser
application, and fuel combustion. In 1990 energy-related activities accounted
for just 5 percent of global ammonia emissions-2.7 of 52.0 teragrams (Olivier
and others, 1998). Most ammonia emissions are from Asia and other developing
countries, due to the rural nature of these countries, the intensive use of
fertiliser for food production, and the heavy use of fossil fuels. In 1990
ammonia emissions in Asia were 22.5 teragrams, compared with 3.5 teragrams in
Western Europe and 4.1 teragrams in North
America.
Future emissions
Sulphur dioxide. The latest energy projections indicate
that global sulphur dioxide emissions will likely stay roughly constant between
1990 and 2020, at about 59 teragrams of sulphur (Nakicenovic, Grübler, and
McDonald, 1998). This ‘middle-course’ scenario incorporates modest
economic growth, continued reliance on fossil fuels, and the elimination of
trade barriers. At the regional level, however, a distinctive pattern emerges
for all the important species. Emissions will decline in the industrialised
regions of the Northern hemisphere-Europe, the former Soviet Union, North
America-and increase sharply the developing regions of the Southern hemisphere
and the Far East-Latin America, Africa, Asia (figure 3.7).
In Western Europe strong national environmental policies,
changes in national energy policies, and implementation of the 1985 Helsinki
Protocol and 1994 Oslo Protocol (under the 1979 Convention on Long-range
Transboundary Air Pollution) have driven down sulphur dioxide emissions. As a
result the region could see a 60 percent drop in sulphur dioxide emissions
between 1990 and 2020. Similarly, in North America the adoption by the United
States of the 1990 amendments to the Clean Air Act has reduced sulphur dioxide
emissions. North America’s sulphur dioxide emissions in 2020 are expected
to be about 35 percent below 1990 levels. In Central and Eastern Europe and the
former Soviet Union, a 50 percent reduction is anticipated.
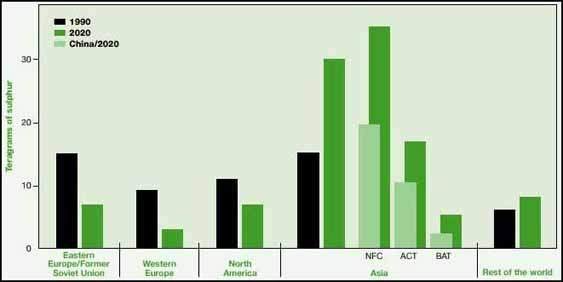
FIGURE 3.7. SULPHUR DIOXIDE
EMISSIONS BY REGION, 1990 AND 2020 (PROJECTED)
Source: Nakicenovic, Grübler, and McDonald, 1998;
Foell and others, 1995.
The problem of sulphur dioxide emissions has shifted to the
developing world, with emissions in Latin America, Africa, and the Middle East
expected to increase by about 30 percent between 1990 and 2020. The main problem
region is Asia, where emissions are already high-with 17 teragrams of sulphur
emissions in 1990-and could double by 2020. If that happens, Asia will account
for 58 percent of global emissions, much of them from China.
Three emission scenarios from the RAINS-ASIA model are also
shown in figure 3.7 (Foell and others, 1995; Arndt and others, 1997; Streets and
others, 1999). Driven by a similar energy forecast, the model projects that
Asia’s sulphur dioxide emissions in 2020 will be bounded by an upper value
of 40 teragrams of sulphur (under the assumption of no further control policies
beyond those in place in 1990-the NFC scenario) and a lower value of 6 teragrams
of sulphur (with the assumption of very tight controls, similar to those in
Western Europe). A mid-range estimate is 20 teragrams of sulphur, to be achieved
if all large, new facilities are fitted with flue-gas desulphurisation units and
other fossil-fuel users switch to low-sulphur fuels.
China continues to be the largest contributor to Asia’s
sulphur dioxide emissions, emitting about half of the continental total. But the
establishment in 1997 of China’s Two Control Zone policy for sulphur
dioxide emissions has generated optimism that emissions will not grow as fast as
once thought. Emissions of 11.9 teragrams of sulphur in 1995 are used as a
baseline, and the plan is to limit national emissions to 12.3 teragrams of
sulphur in 2000 by capping emissions in certain provinces at their 1995 levels.
While implementation and enforcement questions linger, there is a commitment at
the highest level in China to holding down sulphur dioxide emissions. The
official (but undocumented) estimate for China’s emissions in 2020 is 19.5
teragrams of sulphur.
The message from figure 3.7 is one of opportunity. With rapid
growth in Asia, many of the coal-fired plants projected to be needed after 2000
have yet to be built. Thus the opportunity exists to fit these plants with
emission controls or lower-emission technology at the time of construction. The
incremental cost of emission reduction is then the only hurdle to be
overcome-though it is a high hurdle ($25 billion a year for the ACT scenario,
rising to $65 billion a year for the BAT scenario). Substitution of natural gas
for coal is an attractive interim measure, and any possibilities for increasing
the efficiency of energy use and moving towards renewable energy would reduce
emissions of sulphur, nitrogen, and other species. The ecologically driven
scenario (chapter 9), for example, would lower global 2020 emissions from 59
teragrams of sulphur to 34 teragrams.
Nitrogen oxides. The situation for nitrogen oxides
emissions is even more challenging, because of the added emissions from
transportation. Though nitrogen emissions were not estimated by Nakicenovic,
Grübler, and McDonald (1998), other analyses suggest a regional pattern similar
to that of sulphur dioxide. An earlier study, Energy for Tomorrow’s
World (WEC, 1993), which was more optimistic about economic growth, forecast
a 13 percent increase in global emissions of nitrogen oxide between 1990 and
2020 (from 24 teragrams of nitrogen to 27 teragrams) under case B assumptions.
The increase in Asia was 70 percent (from 6.8 teragrams of nitrogen to 11.5
teragrams). Use of the RAINS-ASIA model, with its daunting view of the growth of
fossil-fuel-based energy systems in Asia, yields an estimated increase of more
than 300 percent in this period (van Aardenne and others, 1999).
Carbon monoxide and non-methane volatile organic compounds.
Though there are no published projections for emissions of carbon monoxide
and non-methane volatile organic compounds, carbon monoxide emissions are
unlikely to increase in Asia, because inefficient combustion of biofuels will
fall and inefficient vehicles will be replaced. On the other hand, emissions of
non-methane volatile organic compounds may grow rapidly as expanding industrial
production calls for greatly increased solvent use, increased vehicle use
generates more hydrocarbons, and rising living standards increase the demand for
domestic and commercial paints and solvents. Together, the expected rise in
emissions of nitrogen oxides non-methane volatile organic compounds bodes ill
for the formation of regional ozone in the developing
world.
Acid deposition
Acid deposition-or acid precipitation in its ‘wet’
form-is perhaps the most important regional-scale manifestation of energy
generation through fuel combustion. Acid deposition occurs when sulphur dioxide
and nitrogen oxides are oxidised in the atmosphere to - sulphuric acid
(H2SO4) and nitric acid (HNO3), respectively,
and dissolved in rainwater. Clean rainwater is naturally acidic, with a pH of
about 5.6. In the industrialised regions of Europe, North America, and Asia,
rainfall pH values of 4.0-6.0 are common-and values as low as 3.0 have been
measured in isolated events.
Acid deposition is a problem because it causes damage to natural
and human-made surfaces with which it comes into contact. If soils contain
insufficient alkali to neutralise the acid, damage can be caused to vegetation,
particularly sensitive tree species and agricultural crops. Lakes can become
acidified, leading to the demise of fish populations. Over time the entire
natural structure and function of ecosystems can change. Manufactured materials
can be attacked: metal surfaces rust, and alkaline materials like concrete,
limestone, and marble are eroded (box 3.6).
In Europe forest damage has long been attributed to acid
deposition. Despite emission reductions, the health of European forests still
seems to be deteriorating (UNECE, 1996). In a 1995 survey of 117,000 trees in 30
countries, more than 25 percent showed signs of significant defoliation, and
more than 10 percent showed significant leaf discoloration. Both direct and
indirect effects of air pollution, of which acid deposition is but one part, are
considered the cause. Surveys of forest soils show that, while sulphur
deposition has dropped drastically since the 1970s, nitrogen deposition is still
high, impairing soil chemistry and nutrient status. For acidification of surface
waters, there appears to be an overall improvement (with higher pH, for
example), probably as a result of reductions in acid deposition (UNECE, 1997).
With projected reductions in sulphur and nitrogen emissions through 2020,
continued progress is expected towards healthier ecosystems in Europe.
|
BOX 3.6. ENVIRONMENTAL IMPACTS OF ACID DEPOSITION
In general, the exposure-response relationships between acid
deposition and impacts on ecosystems, materials, visibility, and human health
are complex. Some are reasonably well understood, but others involve poorly
known relationships involving climate, geography, other chemicals, and time.
Much research has been devoted to studies in North America and Western Europe,
while relatively little has been done in Asia-where most of the growth in
acid-depositing emissions is expected over the next few decades.
Acid deposition has harmful effects on many lakes and rivers,
hurting aquatic life. In affected regions such as eastern Canada, lakes have
acid levels that are unsafe for fish and other aquatic life. While species of
fish vary in their sensitivities to acidification, those with low tolerance
decline in population, at times to the point of extinction. This not only
affects the species directly harmed, but loss of species diversity damages the
ecosystem as a whole due to the interdependence among species (Curren and Nixon,
1992).
Although the impacts of acid rain on terrestrial systems are
known with less certainty, several aspects are likely outcomes of acid
deposition. Effects on soil include reducing the availability of nutrients and
enhancing the solubility of metals. But nitrogen deposition into the soil can
enhance its nutrient content, and some soils are fairly resistant to damage.
Acid deposition can cause damage to foliage of trees and crops, however (Curren
and Nixon, 1992). Forests, especially those at high elevations, are also
affected by acid deposition directly through increased susceptibility to natural
stresses and indirectly through a loss of nutrients obtained from soil (USEPA,
1999). Considerable uncertainty relates to long-term impacts that may not yet
have been observed (NAPAP, 1998).
Several human health problems are linked to acid deposition. For
example, many respiratory diseases, including bronchitis and emphysema, are
likely caused or aggravated by sulphur particulates and nitrogen oxides.
Respiratory problems are particularly noted in sensitive populations, such as
children and asthmatics, as in Hong Kong, China (Hong Kong Municipal Government,
1999). Another potential human health problem comes from increased levels of
toxic metals leached from soil, especially aluminium, into drinking water in
rural areas (Environment Canada, 1999).
Acid precipitation is also known to have negative non-ecological
consequences. It causes the erosion of materials and structures, leading to
aesthetic and functional damage as well as increased maintenance costs. This
damage to structures includes those that have a great deal of historical
significance and are considered highly valuable. Another impact of acid
deposition is haze, or a lesseningof visibility, largely an aesthetic problem
(USEPA, 1999).
The largest documented economic disruptions have been to
fishery, forestry, and agricultural industries. The damage occurring to their
products is causing a loss of productivity and jobs (Environment Canada, 1999).
Furthermore, recreational use of aquatic regions and forests has diminished,
causing a loss in revenue (NAPAP, 1998). |
North America has seen significant reductions in the sulphate
concentration and pH of precipitation as a result of the 1990 amendments to the
Clean Air Act. Reductions in nitrate concentration have not been observed,
however, because requirements for lower nitrogen oxide emissions did not go into
effect until 1996 (NAPAP, 1998). On the whole, it is too early to tell if there
has been significant improvement in the health of ecosystems. There is evidence
of recovery in some New England lakes, but the U.S. Environmental Protection
Agency has reported that additional reductions in sulphur and nitrogen
deposition will be needed to fully restore the health of sensitive Adirondack
lakes (USEPA, 1999). High-elevation spruce fir forests in the eastern United
States continue to show signs of damage. But, as in Europe, there is reason to
hope for improvement.
Asia is the region of greatest concern. Acid deposition is being
reported throughout Asia (Wang and Wang, 1995), with many areas receiving levels
that exceed the carrying capacity of their soils. Long-range transport is
receiving scientific and political attention as countries receive increasing
pollution from neighbouring and even distant countries (Huang and others, 1995;
Ichikawa and Fujita, 1995; Streets and others, 1999). By far the worst episodes
of acid deposition occur in southwestern China (Zhao and Xiong, 1988). Average
rainwater pH values of 4.0-5.0 are observed in the Sichuan Basin, and values
below 3.0 have been recorded in individual episodes. Atmospheric conditions in
Sichuan and Guizhou provinces, with weak winds and frequent temperature
inversions, are conducive to high pollutant concentrations. Emissions are also
high there because of the widespread burning of high-sulphur coal in small
stoves and medium-size industrial boilers.
Southwestern China has seen damage from acid deposition. Sulphur
deposition levels are more than 10 grams of sulphur per square metre per year,
making the situation comparable to the worst parts of the former Czechoslovakia
in the 1960s and 1970s. Zhao and Xiong (1988) report the following effects in
the vicinity of Chongqing and the provinces of Sichuan and Guizhou:
· A 50 percent
dieback of pine forests on Nanshan Mountain, about 20 kilometres from Chongqing,
attributed to acid deposition and air pollution.
· A more than 50 percent
reduction in biomass production in commercial spruce forests in areas
experiencing rain with a pH of less than 4.5.
· A yellowing of rice in large
areas near Chongqing after rainfalls with a pH of less than 4.5.
Seip and others (1995) sampled soil water and stream water in a
7-hectare catchment near Guiyang in Guizhou Province, about 350 kilometres south
of Chongqing. Sulphate concentrations were very high, pH values were as low as
4.3, and aluminium concentrations were elevated. Despite these factors, no
apparent damage to vegetation was observed. It appears that neutralisation of
acid inputs by deep soils and underlying bedrock may be averting ecosystem
damage. Because of the heterogeneity of Chinese soils, however, local
acidification and damage may be occurring in sensitive areas that have not been
studied. A more recent survey of acidification in China by the Norwegian
Institute for Water Research (Lydersen and others, 1997) reported severe effects
of acid deposition on soils, water bodies with high loadings showing typical
signs of acidification, and observed effects on surface water organisms.
Zhao and Xiong (1988, p. 342) describe some of the severe
materials damage observed in Chongqing: “Metal structures are scraped of
rust and painted once every 1-3 years. Shells of buses are generally replaced
every 1-2 years. Structural components made of stainless steel become rusty
after a few years. Some concrete works built in the 1950s have corroded in such
a manner that the gravel is exposed. It is estimated that the corrosion depth
reaches 0.5 cm in less than 30 years”.
In northern China, by contrast, rainwater pH values are
typically 6.0-7.0. Although emissions are high in many parts of northern China,
meteorological conditions are more conducive to pollutant dispersion, and
windblown dust from central Asian deserts tends to neutralise the acidity. The
line delineating acid precipitation in China (pH of 5.6) extends just west of
Beijing and along the eastern edge of the Greater Khingan mountain range. Since
1982 the area receiving acid deposition may have expanded by 600,000-700,000
square kilometres (Wang and Wang, 1995).
Acidification is responsible for much of the air
pollution-related damage in China, though the relative roles of acid rain, dry
deposition of sulphur dioxide, nitrates, particulates, ozone, and other factors
have not been determined. Areas with lower rain acidity see much less damage
than Chongqing and neighbouring cities of southwestern China. Acid rain damage
to crops, forests, materials, and human health in China in 1995 is estimated to
total more than $13 billion (China Daily, 9 March 1998).
In Asia there is also considerable concern about the fate of
cultural materials as pollution levels rise. Concerns about the deterioration of
the Taj Mahal were raised as far back as 1981 (Lal, Gauri, and Holdren, 1981).
Throughout Asia, cultural buildings and monuments made of alkaline-based
materials are vulnerable to attack. Glass, paper, textiles, and archives are
also subject to accelerated deterioration in the warm, moist, polluted
atmospheres of Asia. These problems are greatly under-appreciated and should be
given high priority in future research before rich areas of cultural heritage
are destroyed.
Finally, although not yet major emitters, Sub-Saharan Africa and
Latin American have the potential for significant sulphur emissions as fossil
fuel use
increases.
Tropospheric ozone
Ozone is an important air pollutant that can cause damage to
crops, trees, and human health. It is a major component of the harmful smog that
forms in urban areas during periods of high temperature, intense solar
radiation, low wind speed, and an absence of precipitation. In the polluted air
mass, ozone is produced by a complex set of chemical reactions involving
nitrogen oxides and non-methane volatile organic compounds. North America and
Europe are developing coordinated strategies to reduce emissions of ozone
precursors and thereby reduce some of the health and ecosystem damage attributed
to it. Although there is still progress to be made in these regions, it is again
in Asia that concern is greatest.
Episodes of high ozone concentrations are now common in the
megacities (cities containing more than 10 million people) of southern Asia that
have industrial emissions (producing volatile organic compounds), transportation
(producing nitrogen oxides), and conducive climates-Bangkok (Thailand), Hong
Kong (China), Mumbai (India), and Shanghai (China), to name a few. In addition,
the formation and transport of regional ozone have been observed in measurement
campaigns such as PEM-West (Akimoto and others, 1996; Jaffe and others, 1996).
Ozone concentrations were observed to be regionally enhanced by photochemical
activity in continental air masses passing through areas with high nitrogen
oxides emissions.
The potential effects of elevated ozone concentrations on human
health and crop production in Asia are just beginning to be explored (Chameides
and others, 1994). Studies in the West have established that crop yields are
depressed by repeated exposures to ozone levels above 50-70 parts per billion;
these concentrations are exceeded in fall and winter throughout large areas of
southern China. There is concern that damage to winter wheat and other crops in
the Yangtze Delta may endanger China’s ability to meet increasing food
demands. These analyses are still in their infancy, however, and much more work
is needed on meteorological analysis, the gathering of monitoring data, field
studies on crop responses to elevated concentrations, and regional assessments
of economic impact. Until more of this work is done in Asia, a definitive
statement cannot be made about the relationship between regional emissions of
non-methane volatile organic compounds and nitrogen oxides and impacts on human
health and
vegetation.
Suspended fine particles
Particulate emissions are relatively well controlled in the
industrialised world. Control systems on stationary and mobile sources are
effective in limiting the release of primary particles, and secondary fine
particles (such as aerosols) are being checked by reductions in emissions of
their precursors. In the outdoor environments of many Asian cities, however,
concentrations of fine particles are very high, exacerbated by domestic
solid-fuel combustion, small-scale industrial activities, and inefficient
transportation systems (see above). In many parts of the world the build-up of
secondary fine particles over large regional areas during hot, dry spells leads
to regional haze, impaired visibility, inhalation health effects, and related
ecosystem problems.
|
Acid deposition is being
reported throughout Asia,
with
many areas receiving levels that
exceed the carrying capacity
of
their soils |
Alkaline dust is also important in Asia because of its ability
to neutralise the acidity of precipitation and deposition. In the spring (March,
April, May) large dust storms build in the Taklamakan and Gobi deserts and the
loess plateau areas of China and Mongolia. These storms are associated with
strong cold fronts and prevailing westerly winds. Dust particles are lifted as
high as 6 kilometres into the atmosphere and transported over long distances to
eastern China, the Republic of Korea, Japan, the Pacific Ocean, and even North
America. The dust contains high concentrations of calcium, which neutralises
part of the acidity in rainfall. Thus, while sulphate levels in northeast Asian
deposition are high and similar to those in North America and Europe, pH values
are less acid (typically 5.3-7.0+).
Although large amounts of carbonaceous particles are emitted
from the burning of coal, most of the larger particles fall to ground quickly
and are not part of the regional emissions picture. Similarly, a large portion
of particles is collected, for even in the most polluted regions some form of
particulate collection is usually employed. Nevertheless, a certain portion of
fine particles from fuel combustion is carried aloft and transported over long
distances. These particles are usually less than 1 micron in diameter and
consist of carbonaceous solids-so-called black carbon-and organic compounds in
aerosol form. These particles can participate in chemical reactions, contribute
to reduced visibility, and lead to soiling of surfaces. They scatter and absorb
solar radiation and hence play a role in global warming. They also affect cloud
albedo (ability to reflect sunlight), because their hydrophilic qualities
increase the number of cloud condensation nuclei. On balance, black carbon is
thought to contribute a net warming of about 0.5 degrees Celsius (C) globally
(Penner, Ghan, and Walton, 1991).
The combustion of biofuels and coal in rural households and
diesel fuel in vehicles is a prime contributor to these fine particles. There is
an urgent need to better characterise the anthropogenic emissions of primary
particles from Asian sources, both by size and chemical and physical
characteristics. Diesel vehicles that are poorly designed, operated, and
maintained emit large quantities of fine particles in much of the developing
world.
Forest fires are a large source of particle emissions in all
size ranges. Some of these fires are of natural origin (caused by lightning
strikes), while others are caused by human activities such as forest clearing.
The fires in Indonesia in the summer of 1997 caused a months-long regional air
pollution episode in Indonesia, Malaysia, Singapore, and parts of Thailand and
the Philippines. The health of tens of millions of people was affected.
Increases in acute respiratory infections, asthma, and conjunctivitis were noted
in Kuala Lumpur (Malaysia), Sarawak (Malaysia), and Singapore. Tests on school
children in Malaysia noted significant decreases in lung function, the chronic
effects of which will not be known for a long time (Brauer and Hisham-Hashim,
1998). Fine particles from such fires can be transported thousands of kilometres
if atmospheric conditions are
conducive.
Regional climate change
In the early 1990s it was recognised that sulphate aerosols can
influence the global climate by scattering and absorbing incoming solar
radiation (Charlson and others, 1992) and hence exerting a cooling effect. The
role of sulphate aerosols has now been clarified (IPCC, 1996a). Indeed, sulphate
aerosols contribute negative radiative forcing (of about -0.4 watts per square
metre) that offsets the positive forcing of carbon dioxide and other greenhouse
gases. Hence a reduction in sulphur dioxide or nitrogen oxide emissions would be
expected to reduce sulphate aerosol concentrations and increase the potential
for global warming. The radiative forcing is spatially inhomogeneous, with
values as large as -11 watts per square metre over heavily polluted areas such
as Central Europe and eastern China.
Lal and others (1995) have suggested that sulphate aerosols can
also interfere with local climates. The cooling effect of the aerosol haze
reduces the difference between land and sea temperatures and weakens the
monsoon. In addition, the cooler land surface reduces evaporation and lowers the
amount of water vapour in the atmosphere. The authors estimate that sulphate
aerosols in the Asian atmosphere will reduce monsoon rainfall over India and
parts of China by the middle of this century. The calculated reduction of 7-14
percent over the fertile north and central Indian plains would be a serious
threat to agricultural production. It also appears that large-scale forest fires
can reduce rainfall
regionally.
Global scale: climate change from greenhouse gases
The two most important human-caused problems associated with
environmental processes operating at the global scale are:
· The disruption of
climate as the result of energy-related emissions of heat-trapping (greenhouse)
gases with long atmospheric residence times.
· The depletion of stratospheric
ozone as a result of emissions of chlorofluorocarbons and related compounds from
air-conditioning and refrigeration equipment (among other sources).
The character and origins of the first of these are discussed in
this section. Stratospheric ozone is not addressed here because it is not
primarily an energy issue, although it has connections to energy end-use
technologies.7
It has been known since the work of Swedish scientist Gustav
Arrhenius at the end of the 19th century that certain gases present in
Earth’s atmosphere in trace quantities exert a thermal blanketing effect
that keeps the planet’s surface much warmer than it would otherwise be.
These are called ‘greenhouse gases’ because they work in a way
analogous to one of the functions of the glass in a greenhouse, letting sunlight
in but trapping outgoing heat by absorbing it and re-radiating some of it back
to the ground.
The most important greenhouse gas naturally present in
Earth’s atmosphere is water vapour. Next in importance is carbon dioxide
(CO2), followed by methane (CH4) and nitrous oxide
(N2O). The concentrations of these gases in the atmosphere before the
start of the industrial revolution kept the mean global surface air temperature
about 33 degrees Celsius warmer than it would have been in absence of an
atmosphere with such natural levels of greenhouse gases. (This natural
‘greenhouse effect’ is highly beneficial to life on Earth, since
without it the average temperature would be far below freezing.8)
Although water vapour contributes the largest part of the
natural greenhouse effect, its concentration in the atmosphere globally-on which
the size of the water-vapour contribution to the greenhouse effect depends-is
not significantly affected by emissions of water vapour from human activities.
The most important anthropogenic greenhouse gas emissions are those of carbon
dioxide (CO2), which arise mainly from combustion of fossil and
biomass fuels and from deforestation (see below).9, 10 An important
indirect effect of human activities on the atmospheric concentration of water
vapour results from increased evaporation of water from the surface of Earth
because of the warming caused by increasing concentrations of anthropogenic
greenhouse gases in the atmosphere. The resulting increase in atmospheric
water-vapour content further warms Earth’s surface-a significant
‘positive feedback’ in the anthropogenic greenhouse
effect.11
Concerns developed many decades ago that human-caused increases
in the carbon dioxide content of the atmosphere might accentuate the natural
greenhouse effect enough to disturb the global climatic patterns to which human
habitation, agriculture, forestry, and fisheries had become accustomed. As a
result, in 1958 scientists began to take direct measurements of the atmospheric
concentration of carbon dioxide at locations far from its main human
sources.12 The continuous record of such measurements, at various
remote locations on land and from ships and aircraft, has revealed a steady
increase in the global atmospheric inventory of carbon dioxide, reaching 14
percent above the 1958 level by 1995.
Reconstruction of the earlier history of atmospheric carbon
dioxide content (by analysis of air bubbles trapped in layered cores taken from
polar ice sheets) has established that the increase from pre-industrial times to
1958 was about 13 percent. Thus the ratio of the 1995 concentration to the
pre-industrial one is 1.14 x 1.13 = 1.29, representing an increase of 29 percent
(figure 3.8). The rise in the atmosphere’s inventory of carbon dioxide
closely tracks the rise in global fossil-fuel burning over the past 150 years.
Moreover, studies based on relatively abundant carbon isotopes confirm the role
of fossil-fuel-derived carbon in the observed increase. There is reason to
believe that the slower increase in the 100 years before that was due mainly to
widespread deforestation for timber, fuelwood, and charcoal.
Not all of the carbon added to the atmosphere by human
activities stays there. A substantial part is absorbed by dissolution into the
surface layer of the world’s oceans (from which oceanic mixing processes
gradually transport the dissolved carbon dioxide into the much larger volume of
water in the deep oceans). And part is absorbed into forests and soils in areas
where the forest ‘standing crop’ or soil carbon inventory is
growing.13 Estimates for the balance of sources, sinks, and
atmospheric accumulation of anthropogenic carbon during the 1980s are summarised
in table 3.4. The mean residence time in the atmosphere of carbon dioxide
contributed by human activities, relative to the processes that remove it, is
more than 100 years.

FIGURE 3.8. ATMOSPHERIC
CONCENTRATIONS OF CARBON DIOXIDE, 1850-1995
Source: OSTP, 2000.
Measurements and analyses over the past 20 years have revealed
that the atmospheric concentrations of two other naturally occurring greenhouse
gases-methane (CH4) and nitrous oxide (N2O)- have
increased by 145 percent and 14 percent since pre-industrial times. Apparently
these increases are at least partly due to direct inputs from human activities
as well as to alteration of ecological conditions. The wholly anthropogenic
chlorofluorocarbons (CFCs) implicated in the depletion of stratospheric ozone
are potent greenhouse gases as well. The warming effect of ozone, itself a
greenhouse gas, has been increased in the troposphere (as a result of
anthropogenic emissions of hydrocarbons and nitrogen oxides) by more than CFCs
have decreased it in the stratosphere.
Changes in the atmospheric concentrations of methane, nitrous
oxide, chlorofluorocarbons, and ozone since pre-industrial times are thought to
have increased by about 75 percent the warming potential that would be expected
from the observed increases in carbon dioxide concentrations alone. Increases
over this same period in the atmospheric concentrations of particulate matter
produced by combustion of fossil fuels and biomass have offset part of the
warming effect of the greenhouse gas increases.14 This offset, for
which the best estimate is about half of the overall warming effect that would
otherwise have occurred through 1995, is likely to diminish as emissions of
particulates and their precursors are more tightly regulated.15
Estimated effects of the various anthropogenic greenhouse gases on
Earth’s energy balance are shown in table 3.5, together with estimates of
other changing influences on this balance.
TABLE 3.4. SOURCES AND FATES OF ANTHROPOGENIC CARBON
EMISSIONS, 1980S
|
Source |
Billions of tonnes of
contained carbon |
|
Emissions from fossil fuel combustion and cement production
|
5.5 ± 0.5 |
|
Emissions from tropical deforestation |
1.6 ± 1.0 |
|
Total anthropogenic emissions |
7.1 ± 1.1 |
|
Fate |
|
|
Storage in the atmosphere |
3.3 ± 0.2 |
|
Uptake by the oceans |
2.0 ± 0.8 |
|
Uptake by terrestrial ecosystems |
1.8 ± 1.6 |
Source: IPCC, 1996.
TABLE 3.5. CHANGES IN EARTH’S ENERGY BALANCE,
PRE-INDUSTRIAL TIMES-1992
|
Effect |
Global average watts
per square metre |
|
Direct effect of increasing carbon dioxide |
1.6 ± 0.2 |
|
Direct effect of increasing methane |
0.5 ± 0.1 |
|
Direct effect of increasing halocarbons |
0.25 ± 0.04 |
|
Direct effect of increasing tropospheric ozone |
0.4 ± 0.2 |
|
Direct effect of decreasing stratospheric ozone |
0.1 ± 0.02 |
|
Direct effect of tropospheric aerosols |
-0.5 ± 0.3 |
|
Indirect effect of tropospheric aerosols |
-0.8 ± 0.8 |
|
Direct effect of natural changes in solar output (since 1850)
|
0.3 ± 0.1 |
Source: IPCC, 1996b.
Are the changes in climate being observed in the forms and
magnitudes that theory predicts for the measured increases in greenhouse gases?
Although natural fluctuations in climatic variables would tend to mask
human-caused disruption in its early stages, a variety of evidence indicates
that the ‘signal’ of anthropogenic change is becoming visible despite
the ‘noise’ of these fluctuations. Specifically:
· Near-surface air
temperatures around the globe have increased by 0.3-0.6 degrees Celsius since
the late 19th century.16 The 11 hottest years since 1860 have all
occurred since 1983 (notwithstanding the multiyear cooling effect of particulate
matter injected into the stratosphere by a major volcanic eruption in 1991).
· Directly measured ocean
surface-water temperatures have also increased by 0.3-0.6 degrees Celsius on a
global average over the past century. In the same period the global sea level,
as determined from tidal-range measurements, rose 10-25 centimetres (4-10
inches). Mountain glaciers have generally been in retreat all over the world,
and mid- to high-latitude cloudiness and precipitation have generally been
increasing.
These observed changes in climatic variables are consistent, in
overall magnitudes and in the general pattern of their geographic distribution,
with the predictions of basic theory for the effects of the changes in
greenhouse gas and particulate matter concentrations known to have occurred over
this period.
The observed climatic changes are also similar to the
predictions of the most sophisticated computer models of global climate, when
these models include the observed build-up of greenhouse gases (corrected for
the effect of atmospheric particulate matter).17 This agreement among
theory, observation, and computer modelling extends, moreover, to a variety of
subtler trends for which reliable measurements have become available only for
the past 15-25 years, such as cooling in the lower stratosphere, reduction of
day-night temperature differences, and maximum surface warming in northern high
latitudes in winter. Taken together, these phenomena are
‘fingerprints’ of greenhouse gas-induced climate change-consistent
with the hypothesis that increases in those gases explain the observed changes,
and inconsistent with alternative hypotheses.
Based on the evidence and arguments summarised here, the
Intergovernmental Panel on Climate Change (IPCC) concluded in its Second
Assessment that “the balance of evidence suggests a discernible human
influence on climate” (IPCC, 1996b, p. 4). In that report the IPCC also
extended its earlier analyses of how the human influence on climate would be
expected to grow under a business-as-usual trajectory of future greenhouse gas
emissions and under higher and lower trajectories. The panel found that, under
the range of trajectories considered (and taking into account the uncertainty in
the global temperature response to a given increase in greenhouse gas
concentrations), the global average surface air temperature would be 1.0-3.5
degrees Celsius higher in 2100 than in 1990.18
In all these cases, according to the IPCC (1996b, p. 5), the
average rate of warming in the 21st century “would probably be greater than
any seen in the last 10,000 years”. In the IPCC’s
‘business-as-usual’ emissions scenario, the average global temperature
increase between 1990 and 2100 is 2.0 degrees Celsius-about 2.5 degrees Celsius
above the temperature a century ago-which would make the world warmer than it
has been at any time in the last 125,000 years. In this scenario the sea level
would rise 50 centimetres between 1990 and 2100, then “continue to rise at
a similar rate in future centuries beyond 2100, even if concentrations of
greenhouse gases were stabilized by that time, and would continue to do so even
beyond the time of stabilization of global mean temperature” (IPCC, 1996b,
p. 5).
The IPCC assessment gives due consideration to the range of
possible outcomes and to the size of the uncertainties attached to the
group’s best estimates. Still, the range of expected ecological and social
impacts of climate changes in the next century leaves little room for
complacency even at the lower end of the range. And the uncertainties include
the possibility of unpleasant surprises that would extend the upper end:
Further unexpected, large and rapid climate system
changes (as have occurred in the past) are, by their nature, difficult to
predict. This implies that future climate changes may also involve
“surprises”. In particular these arise from the non-linear nature of
the climate system. When rapidly forced, non-linear systems are especially
subject to unexpected behavior. Progress can be made by investigating non-linear
processes and subcomponents of the climate system. Examples of such non-linear
behavior include rapid circulation changes in the North Atlantic and feedbacks
associated with terrestrial ecosystem changes (IPCC, 1996b, p.
6).19
Since the IPCC’s Second Assessment, scientific evidence has
continued to accumulate concerning human influences on the global climate
system.20 In particular, the data and analyses show more compellingly
than ever that Earth’s average surface temperature is increasing and that
this increase can largely be attributed to the accumulation of greenhouse gases
in the atmosphere caused by human activities. Among the recent findings:
· 1998 appears to
have been the warmest year in a millennium, and the 1990s were the warmest
decade in 1,000 years for the Northern hemisphere. Scientists have reconstructed
the millennial temperature record in the Northern hemisphere using proxy data
for temperatures, such as ice cores, lake sediments, corals, and tree rings
(Mann, Bradley, and Hughes, 1999).
· Greenhouse gases from human
activities are the driver of these temperature increases. While solar
variability, volcanic eruptions, and El Nińo cycles also contribute to these
global temperature patterns, the 20th century record cannot be explained solely
by invoking these phenomena (Mann, Bradley, and Hughes, 1998).
· Regional patterns of
temperature change across Earth’s surface and vertical patterns of
temperature change in the atmosphere provide further evidence of human-induced
global warming. These patterns are consistent with what is expected under
anthropogenic climate change-and are inconsistent with hypotheses that suggest
that solar variability or the urban-heat island effect can be used to explain
the instrumental temperature record (see Wigley, Smith, and Santer, 1998; Wentz
and Schabel, 1998; and Peterson and others,
1999).
Consequences of greenhouse gas-induced climate change
There is a natural tendency to suppose that an average global
warming of 2.5 degrees Celsius-around the mid-range projection for the year 2100
relative to 1900-would not be such a bad thing. Raising Earth’s average
surface temperature from 15.0 to 17.5 degrees Celsius (from 59.0 to 63.5 degrees
Fahrenheit) does not, at first glance, seem to be especially problematic. Some
regions would have longer growing seasons, and some would have shorter seasons
of freezing weather. What would be so bad about that?
Such complacency is unwarranted for several reasons. Most
important, small changes in the average global surface temperature will cause
many changes in other climatic variables-latitudinal temperature differences,
frequency of extreme temperatures, atmospheric circulation patterns,
precipitation patterns, humidity, soil moisture, ocean currents, and more-that
affect human wellbeing in myriad ways. Climatic conditions are the
‘envelope’ in which all other environmental conditions and processes
exist and operate. Thus climate exerts powerful influences over, for example,
the productivity of farms, forests, and fisheries, the geography of human
disease, and the abundance and distribution of the plants, animals, and
microorganisms constituting biodiversity, as well as determining the
availability of water, the productivity of farms, forests, and fisheries, the
geography of human disease, and the abundance and distribution of the plants,
animals, and microorganisms constituting biodiversity, as well as determining
the availability of water, the productivity of farms, forests, and fisheries,
the geography of human disease, and the abundance and distribution of the
plants, animals, and microorganisms constituting biodiversity, as well as
determining the availability of water, the frequency and intensity of damage
from storms and floods, the combination of heat and humidity that determines
liveability (and requirements for air conditioning) in warm regions in summer,
and the potential property loss from rising sea level.
|
Mountain glaciers
have generally been
in retreat all
over
the world |
The average global surface temperature, then, is not a number
that by itself reveals the features of climate that matter most-the spatial and
temporal patterns of hot and cold, wet and dry, wind and calm, frost and thaw
that constitute the climate locally and regionally, where people live. Rather,
it is a single, highly aggregated index of the global climatic state that is
correlated in complicated ways with those crucial local and regional climatic
features. When the average global temperature increases, the regional increases
will be greater on land than on the ocean surface, greater inland than near the
coasts, and greater at high latitudes than near the equator. In mid-latitude,
mid-continent regions-the midwestern United States, for example-the increase in
average temperature is expected to be 1.3-2.0 times the average global increase
(hence as much as a 5 degree Celsius increase when the global average has gone
up by 2.5 degrees; Wigley, 1999 and IPCC, 1996b). At higher latitudes-central
Canada, northern Russia-the increase could be three times the global average, or
more.
Evaporation and, hence, precipitation are expected to increase
about 3 percent for each 1 degree Celsius increase in the average global
temperature. (Thus a 2.5 degree Celsius increase in the average global
temperature would produce a 7.5 percent increase in precipitation.) In addition,
a larger fraction of the precipitation is expected to occur during extreme
precipitation events, leading to an increase in flooding.21
Notwithstanding the increase in precipitation, the increase in evaporation
will likely reduce summer soil moisture over large regions, increasing the
frequency and severity of droughts in some. At the same time, humid regions will
likely become more so. Climate simulations conducted at the Geophysical Fluid
Dynamics Laboratory of the U.S. National Oceanographic and Atmospheric
Administration show that the average heat index (a discomfort indicator
combining temperature and humidity) for the southeastern United States in July
will increase from about 30 degrees Celsius (86 degrees Fahrenheit) today to
about 35 degrees Celsius (95 degrees Fahrenheit) by the time the average global
surface temperature has increased 2.5 degrees Celsius (GFDL, 1997).
As the average temperature and average heat index go up, the
frequency of days with extremely high temperature and humidity increases
disproportionately. An average warming of 1 degree Celsius might increase the
number of days over a particular threshold by 10 percent, while a 2 degree
Celsius increase would increase the number of days over that threshold by
substantially more than 20 percent (Wigley, 1999; IPCC, 1996b). This result
portends not only much higher summer discomfort in a greenhouse gas-warmed
climate but also a possibility of substantial increases in death rates from heat
stress in areas that are already hot and humid in summer. A decrease in
cold-related deaths in winter would partly offset this effect, but for a variety
of reasons seems unlikely to offset it entirely (IPCC, 1996a).
An increase in sea level at the mid-range value of 50
centimetres between 1990 and 2100 would be devastating to low-lying islands and
seriously damaging to coastal wetlands and many coastal communities. As with
temperature, the damage will come not just from the increase in the average but
from the increase in extremes. In the case of sea level, this refers to the
damage done by storm surges and storm waves starting from a higher baseline
(IPCC, 1996a).
As for the frequency and intensity of damaging storms
themselves-hurricanes and typhoons in particular-some lines of argument and
evidence suggest increases in a greenhouse gas-warmed world, but the origins and
dynamics of such storms are complicated. The higher sea surface temperatures and
higher atmospheric moisture contents associated with a warmer world tend to
produce more powerful storms, all else being equal, but other relevant factors
that could be affected by climate change might offset this tendency. There is
evidence of an increase in the frequency of Atlantic hurricanes based on a
correlation with sea surface temperatures, and there are simulation results
indicating higher wind speeds and lower pressures in tropical storms world-wide
under global temperature increases in the range expected for the 21st century
(see Wigley, 1999 and Knutson, Tuleya, and Kurihara, 1998).
Also subject to considerable uncertainty are the effects of
global warming on the large-scale patterns of atmospheric and oceanic
circulation that are so crucial in determining regional climates. One thinks
particularly of the El Nińo/Southern Oscillation phenomenon that affects
climates across the central Pacific and the Americas and all the way to Africa,
the monsoons that are so critical across Africa and South Asia, and the North
Atlantic thermohaline circulation that drives the Gulf Stream and greatly
moderates the winter climate in Western and Northern Europe. Although there is
every reason to expect that global warming would influence these phenomena,
neither historical correlations nor the ocean-atmosphere models used to simulate
global climate have proven adequate for predicting with confidence what the
exact effects will be.
There are, however, some suggestive preliminary findings. Some
modelling results, for example, indicate a substantial weakening of the North
Atlantic thermohaline circulation from greenhouse gas-induced warming, setting
in well before the pre-industrial carbon dioxide concentration has doubled
(Broecker, 1997; GFDL, 1997). Such a weakening would, somewhat paradoxically,
make Europe much colder in winter in a world that was warmer overall.
And even bigger changes, such as some that might ensue from
ocean-atmosphere-ice interactions, cannot be ruled out. One such scenario
involves the complete melting of the Arctic sea ice (with no effect on sea
level, since floating ice displaces its weight in water, but with large
potential effects on oceanic and atmospheric circulations). Another involves the
collapse of the largely land-borne but ocean-anchored West Antarctic Ice Sheet,
the slow slide of which into the ocean if the anchor points melted away could
raise sea level by 5 metres in 500 years (Oppenheimer, 1998).
|
In a range of cases considered by
the IPCC, the average
rate of warming
in the 21st century "would probably
be greater than any
seen in
the last 10,000 years." |
If the ways in which global warming will affect regional
climates are uncertain, the ecological consequences of those regional changes
are even more so. Certainly both the averages and extremes of temperature,
humidity, and precipitation are critical in governing the distribution and
abundance of terrestrial animals, plants, and microorganisms, just as the
averages and extremes of ocean temperatures, salinities, and current patterns
are critical to marine life. The organisms in question include, of course, the
plants that are the foundation of all terrestrial and oceanic food
chains-including all those that support the human population-and they include
the pests and pathogens that can destroy crops, fell farm animals, ravage
forests, and bring debilitating diseases to humans. Even without the capacity to
predict specific effects in detail (which is lacking because of inadequacies in
ecological as well as climatological understanding), it is worth noting that:
· The conditions
governing what grows where on land are generally the result of co-evolution of
soils, vegetation, and climate. Adjusting to climate change is therefore not
just a matter of allowing cropping patterns and forest characteristics to
rapidly migrate to a rearranged set of climatic zones; reaching a new
equilibrium could take centuries. And where drastic changes in agricultural
practices are required to deal with climate change, the capital- and
infrastructure-poor developing world will be differentially disadvantaged.
· Winter is the best pesticide
(which is why crop pests and many disease vectors and pathogens are more
problematic in the tropics than in temperate zones). This means that warmer
winters outside the tropics will be problematic for food production and for
human disease.
· The warmer, wetter conditions
that global warming will bring to many of the world’s temperate zones will
expand the ranges of a variety of diseases (including, quite probably, malaria,
cholera, and dengue fever). Industrialised countries’ technological and
biomedical defences against these diseases may prove less robust than optimists
predict, not least because of the continuing emergence of drug-resistant
strains.
The conclusions of the IPCC Second Assessment about the
consequences of the greenhouse gas-induced warming expected over the 21st
century include the following (IPCC, 1996a):
· Agricultural
productivity “is projected to increase in some areas and decrease in
others, especially the tropics and subtropics”.22
“Low-income populations depending on isolated agricultural systems,
particularly dryland systems in semi-arid and arid regions, are particularly
vulnerable to hunger and severe hardship” (p. 6).
· “As a consequence of
possible changes in temperature and water availability under doubled equivalent
of CO2 equilibrium conditions, a substantial fraction (a global
average of one-third, varying by region from one-seventh to two-thirds) of the
existing forested area of the world will undergo major changes in broad
vegetation types-with the greatest changes occurring in high latitudes and the
least in the tropics” (pp. 5-6).
· “Climate change is likely
to have wide-ranging and mostly adverse impacts on human health, with
significant loss of life...Net climate-change-related increases in the
geographic distribution (altitude and latitude) of the vector organisms of
infectious diseases (e.g., malarial mosquitoes, schistosome-spreading snails)
and changes in the life-cycle dynamics of both vector and infective parasites
would, in aggregate, increase the potential transmission of many vector-borne
diseases...Increases in non-vector-borne infectious diseases such as cholera,
salmonellosis, and other food- and water-related infections also could occur,
particularly in tropical and subtropical regions, because of climatic impacts on
water distribution, temperature, and microorganism proliferation... [H]otter
temperatures in urban environments would enhance both the formation of secondary
pollutants (e.g., ozone) and the health impact of certain air pollutants. There
would be increases in the frequency of allergic disorders and of
cardiorespiratory disorders and deaths caused by various air pollutants”.
· “Climate change and the
resulting sea-level rise can have a number of negative impacts on energy,
industry, and transportation infrastructure; human settlements; the property
insurance industry; tourism; and cultural systems and values”.
Nearly all attempts to predict the consequences of greenhouse
gas-induced climate change, including those of the IPCC, have confined
themselves to addressing the changes associated with roughly a doubling of
pre-industrial carbon dioxide concentrations. This has been done so that the
results of studies by different investigators would be readily comparable,
inasmuch as they were all looking at a similar degree of climate change-not
because there is any particular reason to believe that no more than a doubling
of pre-industrial carbon dioxide will occur. Indeed, as the next section
indicates, the world could end up with carbon dioxide levels three or even four
times the pre-industrial value. But the prevalence of studies that look only at
the effects of a doubling seems to have led many people to suppose that these
are the most that could occur.
In reality, as the few studies of higher levels of warming make
plain, the uncertainties and controversies surrounding whether a doubling of
atmospheric carbon dioxide would have overwhelmingly negative consequences are
of much less importance when one contemplates a quadrupling. A study of
quadrupling by one of the main U.S. climate study centres concluded, for
example, that the average temperature increases in Northern hemisphere
mid-continent regions would be 8-12 degrees Celsius (15-22 degrees Fahrenheit);
that mid-continent soil moisture in summer would fall about 50 percent from
1990s levels; that the sea level rise from thermal expansion alone (not allowing
for the melting of any of the Greenland or Antarctic ice sheets) would approach
2 metres; that the North Atlantic thermohaline circulation would shut down
completely; and that the July heat index for the southeastern United States
would reach 44 degrees Celsius (110 degrees Fahrenheit). The ecological
consequences of such changes-and their influence on humans-would be immense.
Greenhouse gas-induced climate change could also affect energy
systems, potentially influencing their cost and reliability. The attractiveness
of hydropower, windpower, and biomass energy systems, for example, depends on
favourable and stable, or at least predictable, climate conditions at their
sites over decades. Energy demand is also a function of climate, and changes in
temperature, precipitation, wind, and the like will affect it. Thus it is
conceivable that climate-change-related reductions in the attractiveness of
renewables combined with increases in energy demand could act as positive
feedback mechanisms-increasing greenhouse gas emissions faster than they would
otherwise because of greater use of fossil
fuels.
Alternative energy futures and greenhouse gas emissions
According to the IPCC, in 1990 global emissions of carbon
dioxide from fossil fuel burning totalled about 5.9 billion tonnes of contained
carbon. (It is customary to keep track of carbon dioxide emissions in terms of
their carbon content rather than their total mass, to facilitate comparisons
with other stocks and flows in the global carbon cycle, in which carbon may be
in a variety of chemical compounds.) Carbon dioxide emissions from tropical
deforestation totalled about 1.5 billion tonnes, with an uncertainty of plus or
minus 1.0 billion tonnes. The IPCC assumes that rates of tropical deforestation
will decline in the 21st century, becoming even smaller relative to fossil fuel
carbon dioxide emissions. In 1997 fossil fuel combustion produced about 6.3
billion tonnes of carbon emissions (table 3.6).
The geographic distribution of industrial emissions of carbon-
that is, emissions from fossil fuel combustion (including flaring of natural
gas) and cement manufacturing-is shown in figure 3.9 for 1995 and projects for
2035 under a business-as-usual energy future. In 1995 nearly three-quarters of
these emissions came from industrialised countries. Under the business-as-usual
scenario, the developing country share will equal that of industrialised
countries by 2035. (The cumulative contribution of developing countries to the
atmospheric burden of anthropogenic carbon dioxide will remain smaller than that
of industrialised countries for some time thereafter, however, and per capita
emissions from developing countries will remain smaller than those from
industrialised ones for longer still.)
TABLE 3.6 SOURCES OF INDUSTRIAL CARBON EMISSIONS, 1997
(BILLIONS OF TONNES)
|
Combustion of petroleum products |
2.70 |
|
Combustion of coal |
2.40 |
|
Combustion of natural gas for energy use |
1.20 |
|
Cement manufacturing |
0.20 |
|
Flaring of natural gas |
0.05 |
|
Total |
6.60 |
Source: Authors’ calculations based on
energy data from BP, 1998; USEIA, 2000.
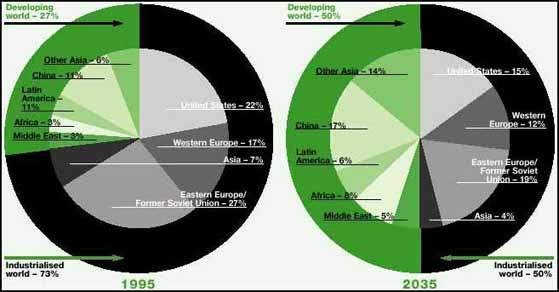
FIGURE 3.9. SOURCES OF INDUSTRIAL
CARBON DIOXIDE EMISSIONS, 1995 AND 2035
Source: OSTP, 2000.
The IPCC analysis and its scenarios for future emissions also
take into account the other anthropogenic greenhouse gases-methane, tropospheric
ozone, nitrous oxide, and halocarbons-and anthropogenic particulate matter in
the atmosphere that partly offsets the heat-trapping effect of the greenhouse
gases by screening out incoming sunlight. As noted, the IPCC found that, as of
the mid-1990s, the non-carbon dioxide greenhouse gases had added about 75
percent to the heat-trapping effect that would have resulted from the build-up
of carbon dioxide alone. But the IPCC’s best estimate of the effect of
increasing particle concentrations was that these had approximately cancelled
out the effect of the increases in non-carbon dioxide greenhouse gases. In one
of the six scenarios developed by the IPCC in 1992, the ‘central’
scenario, designated IS92a, increases in the effects of atmospheric particles
over the next 100 years continue to roughly counterbalance the effects of
increases in the non-carbon dioxide greenhouse gases. Thus the net increase in
the heat-trapping effect over this period is about what would be expected from
the carbon dioxide build-up alone.
The IS92a scenario is very similar to the
‘unsustainable’ IIASA-WEC (International Institute for Applied Systems
Analysis - World Energy Council) A2 scenario presented in chapter 9. Both are
based on World Bank ‘medium’ population projections; the IS92a
scenario uses an older median projection in which the world population reaches
11.3 billion by 2100 and the IIASA-WEC uses a newer projection of 10.7 billion
by 2100. The IS92a scenario assumes that real economic growth world-wide
averages 2.9 percent a year from 1990 to 2025 and 2.0 percent a year from 2025
to 2100, resulting in overall growth of 2.3 percent a year from 1990-2100
compared with 2.5 percent a year in the A2 scenario. Both scenarios assume that
the energy intensity of economic activity (energy per unit of real GDP) declines
by 1.0 percent a year from 1990-2100 and that the carbon intensity of energy
supply (kilograms of carbon emitted in carbon dioxide per unit of energy
supplied) decreases by 0.2 percent a year over this period. The result is that
global carbon emissions increase in both scenarios from 7.4 billion tonnes a
year in 1990 to 20.0 billion tonnes a year in 2100, and cumulative carbon
emissions between 1990 and 2100 total 1,500 billion tonnes.
The carbon content of the atmosphere in 2100 under the IS92a and
A2 scenarios would be some 1,500 billion tonnes, or about 715 parts per million
of carbon dioxide by volume, 2.5 times the preindustrial level, and still rising
steeply. (Only about half of the 1,500 billion tonnes of carbon added between
1990 and 2100 would have remained in the atmosphere, the rest having been taken
up by oceans and by vegetation according to the IPCC’s carbon cycle model.)
This is the scenario for which the IPCC obtained the surface temperature and sea
level estimates mentioned above. Because of the thermal lag time of the oceans
and the continuing melting of polar ice under warmer conditions, both
temperature and sea level would continue to rise after 2100 even if the growth
of atmospheric carbon dioxide were halted at that point.
The challenge of stabilising the carbon dioxide content of the
atmosphere is illustrated in the IPCC’s Second Assessment with emission
trajectories that would be able to achieve stabilisation at concentrations
ranging from 450-1,000 parts per million by volume (ppmv). (The pre-industrial
concentration was about 280 ppmv; today’s is 365 ppmv.) These trajectories
can be characterised by the cumulative and average emissions they entail between
1990 and 2100 (although what happens after that also matters). The results are
summarised in table 3.7.
The IPCC’s IS92a scenario and the IIASA-WEC A2 scenario,
with cumulative emissions of 1,500 billion tonnes of carbon between 1990 and
2100 and annual emissions of 20 billion tonnes of carbon in 2100, are both above
even the highest of these stabilisation trajectories. Such emissions would
nearly triple pre-industrial atmospheric carbon content by 2100 and create a
situation in which an eventual quadrupling or more could not be avoided no
matter what measures were taken thereafter. (These levels are so high as to
render irrelevant the current controversies over exactly how severe the climatic
consequences of a doubling of atmospheric carbon might be; a quadrupling would
transform Earth’s climate beyond recognition; see GFDL, 1997.)
To illustrate the challenge associated with reducing emissions
to the levels being debated in the context of the United Nations Framework
Convention on Climate Change (UNFCCC), consider what the numbers above imply for
the stabilisation target for atmospheric carbon dioxide of 550 ppmv, about twice
the preindustrial level. (While there can be no confidence that this level would
avoid climate change seriously disruptive of human wellbeing throughout much of
the world, a doubled carbon dioxide target is widely discussed because it is, at
least arguably, near the upper limit of what is tolerable and near the lower
limit of what seems achievable.) This would require that cumulative emissions
between 1990 and 2100 be less than two-thirds those in the IS92a scenario. It
would also require that emissions begin to decline after peaking at about 11
billion tonnes of carbon a year around 2030.
This more sustainable development path and the challenge of
achieving the transition towards such a path are illustrated by the IIASA-WEC C
scenario presented in chapter 9. That scenario leads to the stabilisation of
atmospheric carbon concentrations at about 430 ppmv and cumulative emissions of
some 540 billion tonnes of carbon from 1990-2100. Perhaps more important, the
development path that leads to atmospheric stabilisation of carbon at a
relatively benign level also leads to the fulfilment of most of the other
criteria for sustainable development discussed in this report.
The difficulty of achieving this goal becomes particularly
apparent when one views it in terms of the roles of industrialised and
developing countries. In 1990 industrialised countries emitted about 4.5 billion
tonnes of carbon from fossil fuel burning (three-quarters of the world total, or
3.6 tonnes per inhabitant of these countries). Developing countries emitted 1.5
billion tonnes (about 0.37 tonnes per capita). In 1992, as part of the UNFCC,
industrialised countries agreed to try to limit their carbon emissions in 2000
to 1990 levels (see below). But few are on a track towards achieving this. For
example, in 1997 U.S. carbon emissions were about 9 percent higher than in 1990.
Considerably more effort is required. For example, assume that
industrialised countries were willing and able to return to their 1990 carbon
emissions by 2010-a decade after the initial UNFCCC target (and a performance
considerably weaker than called for in the 1997 Kyoto Protocol; see below)-and
were also willing and able to reduce these levels by 10 percent a decade
thereafter. Even then, stabilising atmospheric carbon dioxide concentrations at
550 ppmv would still require that per capita emissions in developing countries
not exceed 1 tonne of carbon in the global peak-emissions year of 2030. (This
assumes that emissions from deforestation have been eliminated by 2030 and that
the population of developing countries is about 7.5 billion at that time,
consistent with the ‘medium’ World Bank projection.) As shown in later
chapters, with vigorous promotion of renewables and energy-efficient
technologies, such a per capita level could produce much higher living
standards.
TABLE 3.7. IPCC SCENARIOS FOR STABILISING CARBON DIOXIDE
LEVELS, 2075-2375
|
To stabilise concentrations at (parts per million by volume)
|
450 |
550 |
650 |
750 |
1,000 |
|
By about the year |
2075 |
2125 |
2175 |
2200 |
2375 |
|
Cumulative emissions in 1990-2100 would need to be in the range
of (billions of tonnes of carbon) |
550-750 |
750-1,100 |
970-1,270 |
1,090-1,430 |
1,220-1,610 |
|
Average emissions in 1990-2100 would be in the range of
(billions of tonnes of carbon per year) |
5.7-5.9 |
7.9-9.0 |
10.2-10.8 |
10.0-11.8 |
12.7 |
|
And peak emissions (billions of tonnes of carbon per year) |
9.5 |
11 |
12.5 |
13.5 |
15 |
|
In the year |
2012 |
2030 |
2050 |
2060 |
2075 |
Source: IPCC, 1996b.
Even more challenging, given the justifiable economic
aspirations of developing countries, the unwillingness of many industrialised
countries to take the steps needed to reduce emissions, and the common
expectations of all countries to rely heavily on expanded fossil fuel use, is
that the per capita emissions of both industrialised and developing countries
would need to fall sharply after 2030 to stay on this 550 ppmv stabilisation
trajectory. (See chapter 9 for more discussion of carbon emission scenarios,
particularly the C scenario, which achieves the required emissions reduction
discussed
here.)
International agreements to address global climate change
The UNFCCC is the first binding international legal instrument
that deals directly with the threat of climate change. Since its enactment at
the 1992 ‘Earth Summit’ in Rio de Janeiro, the convention has been
signed by more than 165 states (plus the European Union). It came into force in
March 1994.
Signatory countries agreed to take action to realise the goal
outlined in article 2 of the convention, namely the “stabilization of
greenhouse gas concentrations in the atmosphere at a level that would prevent
dangerous anthropogenic interference with the climate system.” To achieve
this, all parties to the convention, both industrialised and developing, are
committed under article 4 to adopt national programs for mitigating climate
change; to promote the sustainable management and conservation of greenhouse gas
‘sinks’ (such as forests); to develop adaptation strategies; to take
climate change into account when setting relevant social, economic, and
environmental policies; to cooperate in technical, scientific, and educational
matters; and to promote scientific research and information exchange.
|
BOX 3.7. GREENHOUSE GASES AND NATURAL DEBT
Countries take on national debt when they spend money faster
than their economies produce it. Building up national debt is essentially a way
of borrowing from the country’s future earnings. A little national debt can
be beneficial, by providing resources so that the economy grows faster than it
otherwise might. But a lot of national debt can be quite disruptive. Countries
can also take on ‘natural debt’ by putting pollutants into the
environment faster than they are naturally removed. In this way they borrow from
the environment’s future assimilative capacity.
Humanity has been adding greenhouse gases to the atmosphere
faster than they can be naturally removed. As a result the global atmospheric
burden of carbon dioxide and other greenhouse gases has been rising. The extra
burden of greenhouse gases in the atmosphere above pre-industrial levels is a
measure of the global natural debt. Indeed, this natural greenhouse gas debt is
the principal driver of climate change, since it determines the extra radiative
forcing (warming).
Although most discussions of greenhouse gas control address the
current emissions of countries, cumulative emissions (natural debt) are the
chief determinant of the impact on the climate. The natural debts of countries
differ substantially more than do current emissions, because some countries have
been emitting large amounts for much longer than others have. The largest
natural debts have been accrued by industrialised countries, which started
burning large amounts of fossil fuels early in the 20th century. Some of those
greenhouse gases have been removed naturally from the atmosphere, but some
remain because of long residence times. The table below compares the natural
debts of a number of countries that together account for 55 percent of the
world’s population and about 75 percent of global carbon dioxide emissions.
It has been argued that it would be more appropriate to
determine a country’s responsibility for reducing emissions based on its
natural debt relative to that of other countries rather than on current
emissions, since natural debt (cumulative greenhouse gases in the atmosphere) is
more closely related to actual climate impact. Such proposals are not welcomed
by negotiators for most industrialised countries.
|
|
Natural debt: Carbon as carbon dioxide remaining in the
global atmosphere from fossil fuel combustion |
|
Current emissions 1996
(tonnes per capita)
|
Cumulative emissions 1950-96
(tonnes per
capita) |
|
United States |
5.3 |
119 |
|
Canada |
4.2 |
91 |
|
Germany |
3.3 |
87 |
|
Russia |
3.9 |
78 |
|
United Kingdom |
2.7 |
78 |
|
Australia |
4.1 |
70 |
|
Sweden |
1.7 |
54 |
|
France |
1.8 |
49 |
|
Japan |
2.4 |
41 |
|
Korea, Dem. Rep. |
3.0 |
32 |
|
Korea, Rep. |
1.7 |
16 |
|
China |
0.6 |
8 |
|
India |
0.2 |
3 |
|
One argument against using natural debt as a measure of
responsibility is that it would be unfair. After all, it is argued, the
ancestors of today’s populations in industrialised countries did not know
they were causing a problem by emitting greenhouse gases. Thus today’s
populations, who did not do the polluting, should not have to pay for past
mistakes. This view is partly accounted for in the table, which only shows
emissions from 1950. But there are two important counter-arguments:
· Today’s rich
populations have enjoyed the (considerable) benefits derived from past use of
fossil fuels and other greenhouse gas-generating activities and thus should
accept the debts that go along with those benefits. It is not a matter of
punishment, but one of recognising the debits as well as the credits (the
polluter pays principle).
·
Saying that if someone did not know they were doing a risky thing that they need
not be held responsible is a sure way to encourage people not to make the effort
to discover whether their activities might cause problems for future
generations. It essentially rewards ignorance. A sustainable world energy
system, on the other hand, is one in which cross-generational responsibility is
accepted by all. |
Source: Smith, 1991a; Hayes and Smith, 1994;
Smith, 1997.
The UNFCCC also establishes more demanding obligations for
industrialised countries, which agreed to try to reduce emissions of carbon
dioxide and other greenhouse gases to 1990 levels by 2000. OECD countries are
also committed to facilitating the transfer of financial and technological
resources to developing countries, beyond those already available through
existing development assistance. The convention requires industrialised
countries to take the lead in adopting measures to combat climate change,
recognising that they are mainly responsible for historic and current emissions
of greenhouse gases, and that developing countries will need assistance to meet
the treaty’s obligations (box 3.7).
The structure provided by the UNFCCC is being built on with
additions agreed in a series of conferences of the parties. Most notably:
· The first
conference of the parties, held in Berlin (Germany) in March 1995, focused on
the need to reinforce the commitments in article 4 of the UNFCCC with
“quantified limitation and reduction” objectives for annex 1 countries
after 2000.24 The mandate did not call for new commitments for
developing country parties but only for enhanced efforts at implementing the
existing commitments relating to these countries in article 4.
· The third conference of the
parties, held in Kyoto (Japan) in December 1997, produced a protocol to the
framework convention codifying commitments for reductions in greenhouse gas
emissions after 2000. The protocol commits annex I parties (except Australia,
Iceland, New Zealand, Norway, Russia, and Ukraine) to reduce greenhouse gas
emissions by 5-8 percent below 1990 levels between 2008 and 2012 and to make
“demonstrable progress” towards achieving these commitments by 2005.
Overall emissions are to be computed on a net basis, accounting for
afforestation, reforestation, and deforestation as well as emissions from energy
supply and other industrial activities. (See box 3.7 for a discussion of another
approach to measuring a country’s greenhouse gas
contributions.)
The Kyoto Protocol, having not yet been ratified by the
requisite number of nations, is not in force. It has been criticised by some
(especially in the United States) as demanding too much too soon of
industrialised nations while not requiring anything of developing countries. It
has been criticised by others as not requiring enough of anyone, representing
only a small ‘down payment’ on the kinds of emission reductions that
will be required over the 21st century to avoid intolerable climate change from
greenhouse
gases.
Cross-scale impacts
Some types of pollutants are created and create problems at
every scale and easily transfer between scales. Aerosols (particulates) are a
good example. At the household and community scales, they are probably the chief
source of human ill health from energy systems. At the workplace scale, in the
form of coal dust for example, they are a principal contributor. At the regional
scale, secondary particulates from sulphur and nitrogen gases contribute to ill
health and form the basis for acid deposition. At the global scale, they
contribute to climate change through local warming or cooling, depending on
particle composition and ground characteristics. Overall, it is believed that
human-caused aerosols had a net cooling effect during the 20th century, masking
some of the warming that would have occurred through greenhouse gas build-up.
|
Climate change is likely
to have wide-ranging and
mostly
adverse impacts on human
health, with significant
loss of life.
|
The transfer of aerosols from one scale to another is governed
by complicated processes involving geography, elevation, wind, moisture, size,
composition, and so on. Nevertheless, in general it can be said that reducing
emissions at one scale will have impacts at other scales. In most cases these
benefits are beneficial. As particulates and their precursors such as sulphur
oxides are brought under control because of concerns at other scales, however,
greenhouse gas warming may actually become greater than in the immediate past
because of the apparent net cooling effect in the
atmosphere.
Environmental risk transition
During development, societies tend to push off environmental
problems from smaller to larger scales (Smith, 1990, 1997). For energy,
household hazards dominate fuel cycles in the poorest parts of the world, while
community impacts dominate fuel cycles in middle-income cities through
industrial and vehicular pollution. In the richest countries, household and
community problems have mostly been pushed off to the global level in the form
of greenhouse gases (figure 3.10). In all countries, however, occupational risks
per worker-hour tend to be much higher than risk per hour of public exposure. As
with other exposures, however, occupational risks also tend to be higher in
poorer countries (box 3.8).

FIGURE 3.10. ENVIRONMENTAL RISK
TRANSITION
Source: McGranahan and others, 2000; Smith and
Akbar, 1999.
The environmental risk transition curves in figure 3.10 should
not be considered fixed in the sense that today’s developing nations will
be forced to go through them in the same way that today’s industrialised
countries have done. Rather, the curves should be viewed as a management
framework by which to judge the progress of development policy. The task in
developing countries is to avoid the excesses of the past, to continue to push
down the household curve, and to not let the community curve rise out of hand.
This might be considered a kind of ‘tunnelling’ through the curves to
avoid climbing over the peaks by applying cleaner, more efficient energy supply
and use technologies earlier in the development process than has occurred to
date.
Win-win strategies to link environmental improvements at different scales
The most convincing argument for spending resources to reduce
current greenhouse gas emissions is that the benefits from reduced impacts of
climate change will be greater than the costs. Among the important benefits are
avoiding or reducing the direct impacts on human health that might accompany
climate change, and avoiding ecosystem effects that could have significant
indirect impacts on humanity. Reducing current greenhouse gas emissions could
generate long-term health benefits such as fewer malarial mosquitoes, fewer
extreme climatic events (including tropical cyclones and heat episodes), shifts
in atmospheric composition towards less pollution, reduced impacts on food
production, and decreasing refugee populations from reduced sea level rise and
other factors (McMichael and others, 1996). Similarly, reduced greenhouse gas
emissions could lead to less damage to important ecosystems.
Each step of the causal chain from greenhouse gas emissions to
global warming to direct effects on health and ecosystems is not understood with
certainty, however. As a result of that uncertainty, many observers are still
unconvinced that the potential but distant health and ecosystem benefits justify
large spending on greenhouse gas reductions today. Although the consensus
scientific opinion (as represented by the IPCC) is that such ill effects are
likely if current trends in greenhouse gas emissions continue, scepticism holds
back international agreements to significantly alter current greenhouse gas
emissions. This is particularly so in developing countries, which must contend
with many urgent problems related to human health and welfare. But it also
applies to many groups in industrialised countries.
|
BOX 3.8. THE KUZNETS ENVIRONMENTAL CURVE: FACT OR
FALLACY?
An illustration of the environmental risk transition between
scales is seen in the figure below, which plots the relationship between urban
PM10 (particulates smaller than 10 microns in diameter)
concentrations and countries’ development status as indicated by their UNDP
human development index (a function of income, literacy, and life expectancy).
Superficially, urban PM10 concentrations seem to follow the so-called
Kuznets environmental curve-that is, they first rise during development, reach a
peak, then decline (Grossman and Kruger, 1994). (The curve is named after the
Nobel Prize-winning economist Simon Kuznets, who noted in the 1960s that many
countries go through a period of increasing income inequality during development
before becoming more equitable.) From the standpoint of the risk transition,
however, this curve only addresses the community scale in the form of ambient
urban air pollution. It ignores what happens at other scales, which may be more
important.
The main concern about particulates is their impact on human
health. From a health standpoint, it is not so much urban concentrations that
are critical but human exposure, which is a function of not only where the
pollution is but also where the people are. Because people spend a lot of time
indoors and in other places close to local sources of pollution, exposure
patterns can be quite different from patterns of ambient pollution. Thus, as
shown in the figure, because household sources dominate exposure in the poorest
countries, the pattern of exposures is quite different than that of urban
ambient concentrations. Instead of rising and then falling, exposures decline
continuously-illustrating that the Kuznets curve misses the actual trend, which
is that overall risk tends to fall even though community risk rises, because of
the shift of household to community impacts (Smith, 1993)
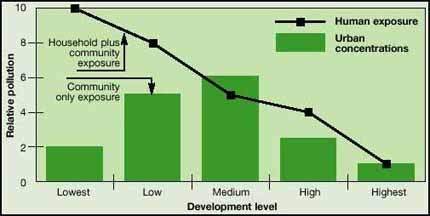
Urban particulate concentrations,
human exposure, and national development
|
|
BOX 3.9. WIN-WIN CROSS-SCALE ENVIRONMENTAL STRATEGIES IN
CHINA
A recent study found that greenhouse gas reductions resulting
from changes in energy use would generally be accompanied by substantial
near-term human health benefits in China (Wang and Smith, 1998). But the level
of health benefits would vary greatly with the choice of energy technologies and
sectors. Shifting from conventional coal-fired power plants to natural gas, for
example, has larger health benefits than reducing global warming potential,
while shifting from coal power to hydropower results in the same percentage
reduction in emissions of health-damaging pollutants and greenhouse gases.
This variation in health benefits is even larger between
sectors. The conservative estimates in the study show that the health benefits
of a 1 tonne reduction in particulate emissions from household stoves are at
least 40 times those from reduction of the same amount from coal-fired power
plants. In terms of human health benefits, the choice of energy technologies and
sectors in which to conduct greenhouse gas reduction efforts is more important
than choice of a particular target for greenhouse gas reduction.
In many developing country households the particulate emissions
from burning unprocessed solid fuels (biomass and coal) routinely exceed by an
order of magnitude or more the safe levels specified by the World Health
Organization. Thus a 15 percent reduction by 2020 in Chinese households’
greenhouse gas emissions below the ‘business-as-usual’ level would
avoid more than 100,000 premature deaths a year. Reduced emissions of
health-damaging pollutants through household improvements in energy efficiency
and changes in the fuel mix would also reduce greenhouse gases. Thus reducing
greenhouse gas emissions at the global scale could significantly ease human
health impacts at the household scale.
On a national scale, a 15 percent reduction in greenhouse gases
below business as usual by 2020 would result in 125,000-185,000 fewer premature
deaths in both the power and household sectors, depending on different control
pathways (energy efficiency or fuel substitution). This range represents about 1
percent of the total mortality in China by 2020. Other countries with high
household and industrial dependence on solid fuels, such as India, could be
expected to see similar benefits.
Acid deposition is increasingly serious in many regions,
damaging forests, crops, and aquatic animals. The RAINS-ASIA model (Foell and
others, 1995) indicates that large areas in Asia have acidity levels in excess
of critical loads due to sulphur deposition, posing significant environmental
threats to a variety of ecosystems. The model also projects that sulphur
deposition will eventually exceed critical loads by a factor of more than 10 in
many parts of Asia as a result of the growing dependence on fossil fuels. This
increase will threaten the sustainability of many natural and agricultural
ecosystems in the region. The model develops a series of emission control
scenarios and shows that energy efficiency and fuel substitution pathways, which
are also the main mitigation options for greenhouse gases, can be important
instruments for controlling acid-forming emissions |
One approach to resolving this impasse is to promote ‘no
regrets’ scenarios for reducing greenhouse gases. Such scenarios achieve
significant near-term benefits for human health and ecosystems in addition to
reducing greenhouse gases. Thus such immediate actions can be justified even if
climate sensitivity to additional greenhouse gases turns out to be less than is
now thought (Repetto and Austin, 1997). Examples of such near-term benefits
include the environmental and energy-security advantages that would accrue
through less dependence on fossil fuels, and the human welfare benefits that
could emerge if an international greenhouse gas control regime were oriented
towards assisting economic development and reducing vulnerability among poor
populations (Hayes and Smith, 1994).
Among the significant near-term benefits of greenhouse gas
reductions are the human health benefits resulting from changes in the
efficiency and structure of energy use that would be a large part of most
greenhouse gas reduction scenarios. Although fuel cycles have several effects on
health and ecosystems-for example, through water pollution, the potential for
large accidents, and occupational health and safety-the largest and most
sensitive to change are probably those related to pollutant emissions from the
processing and burning of fuels. The same combustion processes that produce
greenhouse gas emissions such as carbon dioxide and methane also generate local
and regional airborne health-damaging and acid-precursor pollutants such as
particulates and sulphur oxides. Thus a reduction in greenhouse gases at the
global scale, through improvements in energy efficiency and changes in the mix
of fuels, can be expected to reduce health-damaging and acid-precursor
pollutants as well, potentially bringing immediate environmental improvements at
the household, community, and regional scales. This is a win-win strategy to
link environmental improvements between scales.
The potential health benefits from reduced greenhouse gases can
be estimated from the global burden of ill health from air pollution. Using
airborne particulates as the indicator pollutant, the World Health Organization
estimates that air pollution causes 2.7-3.0 million premature deaths a year, or
5-6 percent of global mortality (WHO, 1997). Since most of this pollution comes
from the combustion of fossil and biomass fuels, which would be among the main
targets of any effort to control greenhouse gases, the potential reduction in
health-damaging emissions would seem to be at least as great as the target
reduction in greenhouse gas emissions. Arguably it is even greater, however,
since switching from dirty, less efficient fuels (such as coal) to cleaner, more
efficient fuels (such as natural gas) reduces emissions of health-damaging
pollutants even more than greenhouse gas emissions. With greenhouse gas
reduction targets on the order of 10-20 percent, the scale of emissions of
health-damaging pollutants and associated reduction of ill health could be in
the same range or somewhat higher-perhaps a 250,000-750,000 annual reduction in
premature deaths world-wide.
To more accurately estimate these near-term health benefits, it
is necessary to link each technological option in a particular greenhouse gas
reduction scenario with the accompanying reduction in emissions of
health-damaging pollutants. The health impact of these emissions, however,
depends on the sector of the economy in which they are taken. This is because
the degree of human exposure created by a unit of emissions of health-damaging
pollutants depends on where they are released relative to where people spend
time, their ‘exposure effectiveness’. Thus a tonne of emissions
averted in the household or transportation sectors close to where people spend
much of the time will generally cause a much greater reduction in human exposure
(and improvement in health) than a tonne averted in the industrial or power
sectors. An example of such a win-win possibility in China is presented in box
3.9.
On a community scale, more than 1.1 billion people living in
urban areas world-wide are exposed to particulate or sulphur dioxide levels in
excess of World Health Organization guidelines (Schwela, 1995). These pollutants
are released by industrial, household, and transportation energy use. Air
pollution is particularly severe in megacities. Again, reducing greenhouse gas
emissions by changing energy use and structure can also reduce the particulate
and sulphur dioxide emissions that cause severe urban air pollution.
The same principle applies in the cities of the industrialised
world, although the scale of absolute benefits is less because air pollution
levels are lower. From an economic standpoint, however, there can still be
substantial secondary benefits from greenhouse gas controls through associated
reductions in health-damaging pollutants, acid precipitation, and the like. The
value of these benefits could in many cases rival the costs of the greenhouse
gas controls, making a win-win result (Elkins, 1996; Burtraw and Mansur, 1999).
As noted, the near-term health and ecosystem benefits of
reducing greenhouse gases provide the opportunity for a true no-regrets
reduction policy in which substantial advantages accrue at various scales even
if the risk of human-induced climate change turns out to be less than many
people now fear. Increases in energy production and end-use efficiency and
changes in the mix of fuels can reduce environmental impacts at the household,
community, regional, and global scales, while meeting greenhouse gas targets. To
achieve these benefits effectively, however, considerations of health and other
secondary benefits should be included from the start in designing greenhouse gas
control strategies.
This no-regrets strategy also has important implications for
emissions trading in the form, for example, of joint implementation and clean
development mechanisms. Because the near-term health improvements are local,
they accrue almost entirely to the nation in which greenhouse gas control
projects are undertaken-unlike the benefits of greenhouse gas reductions, which
accrue globally. These large local benefits may provide a significant extra
incentive for other developing countries to enter into arrangements in which
local greenhouse gas controls are financed externally and the emission credits
are shared. Indeed, a greenhouse gas reduction strategy can be consistent with
such critical national development objectives as reducing local air pollution,
increasing energy efficiency, and improving social equity by providing energy
services to remote areas through renewable energy.
|
The World Health Organization
estimates that air pollution
causes
2.7-3.0 million premature deaths
a year, or 5-6 percent
of
global mortality |
Assessment methods
A number of methods have been developed to compare the disparate
effects of energy systems on a common basis. Here we discuss perhaps the two
most common, economic valuation and fuel-cycle analysis. In both cases there is
still much uncertainty and some controversy on the fundamental nature of the
analyses and on the data inputs required. Thus we present these examples not as
definitive, but as illustrative of the type of information they can provide.
How much is clean air worth? Because it generally becomes
increasingly expensive to reduce pollution as emission controls tighten, a
fundamental question is how much money each bit of emissions control is worth.
If the value of averting damage were known, then the degree of control could be
set such that the total cost (control cost plus residual damage cost) is
minimised. Normally, the cost of control is fairly well known. Similarly, damage
is fairly easy to value for simple property destruction, such as corrosion of
buildings and reduction of crop yields. But valuing damage to critical
ecosystems or human health is not straightforward. As a result there are no
universally accepted methods.
Several approaches are used to value human health, including:
· Human capital-the
value of lost wages and associated medical costs from illness or injury and
premature death.
· Value of statistical life-the
imputed value from extrapolating human risk-averting behaviour. For example, if
the labour market shows that inducing a worker to accept a job with an
additional death risk of 1/1,000 a year requires extra wages of X dollars a
year, then X multiplied by 1,000 would equal the value of a lost life.
· Willingness to pay-in which
people are asked how much they would be willing to pay to avoid certain risks.
These amounts are then extrapolated to find the equivalent value of a
life.
In recent years the willingness to pay approach has become more
widely used, because it holds more theoretical appeal for economists than other
approaches. But beyond the obvious difficulty of finding accurate data, there
are three important problems with this approach. First, measured willingness to
pay can be quite different for the same issue depending on how the question is
phrased, raising doubt about the measure’s intrinsic utility. Second,
willingness to pay to avoid a certain risk depends on the respondent’s
knowledge about the risk, which varies dramatically by geography, demography,
education, and time, and which is quite difficult to account for in surveys.
Finally, although it is clear that willingness to pay varies with income, it is
not clear by how much. As people grow richer, their willingness to pay to avoid
a given risk generally increases even faster. But this relationship is not clear
across different periods and cultures.
Consider some examples of how willingness to pay has been used
to value air pollution in developing and industrialised countries. In China, the
dirtiest fossil fuel, coal is widely used, its use is expected to grow rapidly
in the next few decades, and effective pollution controls are not widely used. A
recent study estimated that air pollution cost China about $48 billion in 1995
(7 percent of GDP), including impacts of acid deposition as well as health
effects from outdoor and indoor air pollution (World Bank, 1997). The study
found that the dominant cost came from health costs for urban residents, some
$32 billion (5 percent of GDP). Moreover, it projected that under
business-as-usual conditions, pollution-related health costs for urban residents
would increase to $98 billion by 2020 at current income levels, or $390 billion
(13 percent of GDP) with adjustments to willingness to pay related to growth in
income. This is substantially more than the estimated economic damage of
greenhouse gas emissions from the same facilities.
China’s high pollution-related health costs are partly due
to relatively limited pollution controls. Even in countries with relatively
extensive pollution controls, however, pollution-related health costs can be
high because aggregate energy-related emissions can be high even if emissions
per unit of energy provided are low. Moreover, the willingness to pay to avoid
pollution damages will be high in high-income countries. And in densely
populated regions such as Europe and Japan, large populations are generally
exposed to air pollution.
Recent studies in Europe have shown that health impacts dominate
the external social costs of pollution, and estimate that the costs of health
impacts due to fine particle air pollution are especially high (Rabl and
Spadaro, 2000; Spadaro and Rabl, 1998; Spadaro and others, 1998; Krewitt and
others, 1999). These economic calculations reflect recent epidemiological
studies indicating that fine particles are associated with serious health
effects, including premature death (see the section on community scale).
Although considerable uncertainty remains about health impacts
from small particles, the economic value of these impacts is expected to be
high-at least in densely populated regions of high-income countries, where large
populations are exposed to air pollution that can shorten lives by a few months.
These populations are willing to pay considerable amounts to avoid this life
shortening. Table 3.8 presents recent estimates of the health impacts of coal
and natural gas power plants equipped with the best available control
technologies. For natural gas combined-cycle plants the only significant health
costs are associated with nitrogen oxide emissions, and these costs are
relatively low (typically about 5 percent of the electricity generation cost).
But for coal the estimated health costs (mostly due to health damage from fine
particle air pollutants) are large and comparable to the electricity generation
cost. These estimates are quite uncertain, however.
Table 3.9 presents estimates of health costs in France for air
pollution from gasoline-fuelled cars equipped with pollution controls and for
diesel-fuelled cars. The estimated health impacts, measured per litre of fuel
sold, are high (though, as with power generation, quite uncertain), especially
for urban driving-about twice the retail price (excluding retail taxes) for
gasoline cars and 25 times the retail price for diesel cars. As in China, the
economic costs of greenhouse gas emissions from European cars and power plants
would seem to be much lower.
These costs will vary significantly by region depending on the
mix of rural and urban driving, whether emissions are at ground level or from
tall stacks, local and regional population densities, and income, which affects
willingness to pay. Applying the results in table 3.9 to developing countries,
where per capita income averaged about $2,800 in 1995, the imputed health costs
would be 0.1-0.5 times those estimated for France when all other factors are
equal, depending on how willingness to pay varies with income.
If willingness to pay continues to increase more rapidly than
income, health impacts will become increasingly important for developing
countries even if emission controls are put in place. That is because their
income and energy consumption levels will rise more rapidly than energy
consumption levels, even with emission controls in place. To illustrate,
consider the WEC projection that in developing countries the number of cars will
increase 6-fold between 1990 and 2020 (WEC, 1995). Even if all were
gasoline-fuelled cars equipped with three-way catalytic converters, health costs
in developing countries would increase to $40-120 billion in 2020, depending on
the rate of increase in willingness to pay. If all cars were diesel, health
costs would be six times as high. These health cost estimates do not include
health impacts associated with buses, trucks, and locomotives.
TABLE 3.8. AIR POLLUTANT EMISSIONS AND ESTIMATED HEALTH
COSTS FOR EUROPEAN POWER PLANTS EQUIPPED WITH THE BEST AVAILABLE CONTROL
TECHNOLOGIES
|
Siting |
Unit health cost (cents per gram) |
Emission rate (grams per kilowatt-hour) |
Unit health cost (cents per kilowatt-hour) |
|
|
Pulverised coal steam-electric |
Natural gas combined cycle |
Pulverised coal steam-electric |
Natural gas combined cycle |
|
Sulphur dioxide |
Nitrogen oxides |
PM10 |
Sulphur dioxide |
Nitrogen oxides |
PM10 |
Nitrogen oxides |
Sulphur dioxide |
Nitrogen oxides |
PM10 |
Total |
Nitrogen oxides |
|
Typical |
1.0 |
1.6 |
1.7 |
1.0 |
2.0 |
0.2 |
0.1a |
1.0 |
3.2 |
0.3 |
4.5 |
0.16 |
|
Urban |
1.6 |
2.3 |
5.1 |
1.0 |
2.0 |
0.2 |
0.1a |
1.6 |
4.6 |
0.5 |
6.7 |
0.23 |
|
Rural |
0.7 |
1.1 |
0.5 |
1.0 |
2.0 |
0.2 |
0.1a |
0.7 |
2.2 |
0.1 |
3.0 |
0.11 |
Note: These calculations were carried out as part of
the European Commission’s ExternE Program. Studies under the program have
estimated the economic values of health impacts by assessing people’s
willingness to pay to avoid adverse health effects. The health cost estimates
shown are median values; the 68 percent confidence interval is 0.25-4.0 times
the median cost.
Source: Rabl and Spadaro, 2000.
TABLE 3.9. AUTOMOTIVE NITROGEN OXIDE AND PARTICULATE
EMISSIONS AND ASSOCIATED PUBLIC HEALTH COSTS IN FRANCE
|
Fuel and driving environment |
Fuel economy (kilometres per litre) |
Emission rate(grams per kilometre) |
Health costs (dollars) |
|
|
|
Per gram |
Per kilometre |
Per litre of fuel |
|
|
Nitrogen oxides |
Particulates |
Nitrogen oxides |
Particulates |
Nitrogen oxides |
Particulates |
Total |
Nitrogen oxides |
Particulates |
Total |
|
Gasoline |
|
Urban |
8.7 |
0.68 |
0.017 |
0.022 |
2.750 |
0.015 |
0.047 |
0.062 |
0.13 |
0.41 |
0.54 |
|
Rural |
10.3 |
0.79 |
0.015 |
0.027 |
0.188 |
0.021 |
0.003 |
0.024 |
0.22 |
0.03 |
0.25 |
|
Diesel |
|
Urban |
10.4 |
0.75 |
0.174 |
0.022 |
2.750 |
0.017 |
0.479 |
0.496 |
0.17 |
4.98 |
5.15 |
|
Rural |
12.7 |
0.62 |
0.150 |
0.027 |
0.188 |
0.017 |
0.028 |
0.045 |
0.21 |
0.36 |
0.57 |
Note: These calculations were carried out as part of
the European Commission’s ExternE Program. Studies under the program have
estimated the economic values of health impacts by assessing people’s
willingness to pay to avoid adverse health effects. The health cost estimates
shown are median values; the 68 percent confidence interval is 0.25-4.0 times
the median cost. The gasoline cases are for cars equipped with catalytic
converters.
Source: Spadaro and Rabl, 1998; Spadaro and others,
1998.
Health costs might end up being much higher than these estimates
because real world emission levels tend to be considerably higher than regulated
emission levels (Ross and others, 1995). That happens for a variety of reasons,
including that regulated emissions are for well-maintained cars and that
regulations tend to be for driving cycles that often do not reflect the way
people actually drive.
These high estimated future health costs argue for much tighter
emission controls than can be achieved with widely used current technologies.
How much additional control will be needed? This is one of the critical
questions for providing sustainable transport systems for the world’s
cities. Nevertheless, despite large uncertainties due to the willingness to pay
method as well as to basic understanding of air pollution health effects, it
seems safe to conclude that the economic value of air pollution abatement is
substantial in developing and industrialised countries alike.
Fuel cycle analysis. Supplying modern energy often
involves processes at a chain of facilities that may be quite physically
distinct from one another. These processes are usually referred to as ‘fuel
cycles’, although they rarely rely on any cycling. Comparisons based on
fuel cycles are useful for organising impact analyses of energy supply and
demand.
Consider the fuel cycle supporting the operation of an electric
appliance. It may involve a coal mine, coal washery, coal train, coal power
plant, and transmission lines, as well as ancillary facilities such as coal
tailings piles, washery settling lagoons, and power-plant ash disposal. Each of
these facilities has environmental impacts and is, in a sense, ‘switched
on’ whenever the appliance is used even though it may be physically
unconnected and thousands of kilometres away. Furthermore, environmental impacts
occur not only during normal operations of these facilities, but also during
their construction, repair, and dismantling-what is called their life cycle.
Even non-fuel energy systems, such as photovoltaic power plants, have fuel
cycles and life cycles, including the harvesting, processing, and transport of
the materials used to construct the facility.
Comparative risk assessment is one term used for studies of the
life-cycle impacts of alternative fuel cycles, such as different ways to produce
electric power. Such studies are usually normalised according to an appropriate
unit of energy output-for example, impacts may be scaled per kilowatt-hour or
per barrel of oil equivalent. The idea is that in this way all the impacts can
be fairly compared across alternative energy systems, giving full and consistent
information to decision-makers. Such studies first account for insults over the
life cycle of each part of the fuel cycle, such as land used, tonnes of
pollution released, long-term waste generated, water consumed, and labour
required per unit of output. Then most comparative risk assessments try to
convert as many insults as possible into impacts with common measures, such as
deaths, injuries, illnesses, and financial damage costs. Since the occupational
impacts of energy systems can be significant (see the section on workplace
scale), often both public and worker risks are determined (box 3.10).
In addition to the methodological and other problems of
fuel-cycle analysis and comparative risk assessment mentioned in box 3.10, there
are some fundamental concerns with these kinds of comparisons that revolve
around this unit of analysis-that is, the production of a certain amount of
energy. For occupational impacts, for example, the number of accidents or
illnesses per unit of energy output is just as much a measure of labour
intensity as of safety. Indeed, from a societal standpoint, putting many people
to work in low-risk activities is much better than employing a few people in
high-risk activities. But both may look the same in the comparisons.
In addition, by using energy as the output measure, such
analyses reveal little about the impact of such facilities on overall public
health, which uses time as the risk denominator. It may be that one way of
producing electricity has slightly different public health implications than
another, but neither may have much significance overall or, conversely, neither
may be acceptable. Entirely different kinds of analyses are needed to evaluate
these kinds of
questions.
Implications for the future
As noted in the introduction, there has not been space in this
chapter to present what is known and suspected about the many environmental
insults of different energy systems and the resulting impacts on ecosystems and
human health. But we have addressed a large fraction of the most important ones.
The central task of this report is to outline the main characteristics of a
sustainable energy future. Thus it is appropriate to examine the main categories
of insults and impacts discussed in this chapter to see what requirements they
impose on such a
future.
Household scale
About half of the world’s households use solid fuels
(biomass and coal) for cooking and heating in simple devices that produce large
amounts of air pollution. Because the pollution is released at the times and
places where people spend time, the health impact is high, accounting for 4-5
percent of the global burden of disease. The chief ecosystem impact relates to
charcoal production and urban fuelwood harvesting, which puts pressure on
forests near cities and may account for a few percentage points of global
deforestation.
It is difficult to envisage a sustainable energy future in which
unprocessed solid fuels remain an important source of energy for a significant
fraction of the world’s households. Gases, liquids, and electricity are the
main clean alternatives. Although today these alternatives mostly derive from
fossil fuels, this need not be the case in the future. In the future these
alternatives may be made from renewable biomass fuels such as wood and crop
residues (see chapters 7, 8, and 10). Indeed, a further criterion for
sustainable energy is that any biomass harvested to make household fuels should
be done on a renewable basis to ease pressure on forests and other natural
ecosystems.
Workplace scale
The harvesting of solid fuels (biomass, coal, uranium) creates
the highest risks per energy worker and the largest impacts on the energy
workforce world-wide. Risks to coal miners, for example, are many times those
for the average industrial worker. To be sustainable, average miner risks will
probably have to be lowered to those in the safest mines today.
|
It is difficult to envisage a sustainable
energy future in
which unprocessed
solid fuels remain an important
source of energy for a
significant
fraction of the world's
households |
Community scale
Fuel use is the chief cause of urban air pollution, though there
is substantial variation among cities in the relative contributions of vehicles
and stationary sources. Diesel-fuelled vehicles, which are more prominent in
developing countries, pose a growing challenge to meeting urban health-related
pollution guidelines (responsible for about 1 percent of the global burden of
disease).
To be sustainable, mean urban air pollution around the world
will need to be no greater than what is common in rich countries today-for
example, less than 30 micrograms per cubic metre of PM10. An
additional requirement for sustainability is that urban ambient ozone levels not
rise as vehicle fleets grow. Sufficiently clean power generation by fossil and
nuclear sources is technically feasible, although costs are uncertain (see
chapter 8). Similarly, hybrid vehicles are substantially cleaner than current
types (see box 3.5). Achieving sustainability, however, will probably require
moving most of the world’s fleet to fuel cells or comparably clean systems
by the middle of the 21st
century.
Regional scale
The problem of regional atmospheric emissions will not go away
quickly. The increasing demand for energy, especially in developing countries,
will put heavy pressure on cheap and easily obtainable fossil fuels such as coal
and oil. Prospects for constraining increases in regional emissions are better
for some pollutants and source types. An ambitious goal for sulphur dioxide
emissions, for example, would be a 50 percent reduction world-wide by 2050. This
goal could be achieved by reducing the sulphur content of fossil fuels and using
emission controls on new, large power plants and industrial facilities.
Switching to natural gas in developing countries would also considerably aid the
achievement of this goal. Increases in sulphur dioxide emissions in the
developing world will be offset by legislatively driven reductions in
industrialised countries.
Nitrogen oxide emissions are a bigger problem. The expansion of
transportation systems in developing countries will add to the nitrogen oxide
burden from industrial production and power generation. Moreover, nitrogen
oxides are much harder to control than sulphur dioxide. An ambitious goal would
be to stabilise nitrogen oxide emissions at current levels by 2050. Only a major
shift away from fossil fuels in all parts of the world or a shift to alternative
energy carriers such as hydrogen derived from fossil fuels will enable this goal
to be achieved.
Carbon monoxide emissions will likely fall significantly as
developing countries move away from biofuels and as automobiles become more
efficient world-wide. Emissions of volatile organic compounds from energy
sources will likely be reduced, but large increases can be expected from
non-energy sources, particularly as the commercial and residential use of
solvents increases in the developing world. Holding global emissions of volatile
organic compounds to a 20-50 percent increase by 2050 will be a challenge. The
faster that clean and efficient vehicles and fuels can replace current vehicles
and fuels, the greater will be the reduction in emissions of nitrogen oxides,
carbon monoxide, and volatile organic compounds.
|
BOX 3.10. COMPARATIVE RISK ASSESSMENT USING FUEL-CYCLE
ANALYSIS
A number of concerns drive the need to assess the environmental
and human health damage associated with electricity production. These include
informing utility planning decisions in terms of total social costs,
enlightening cost-benefit analyses of pollution mitigation technologies,
facilitating formulation of regulatory procedures, and delineating the secondary
benefits of reducing greenhouse gas emissions. Attempts to quantify damages
incurred by electricity generation technologies date to the 1970s and are known
as fuel-cycle analyses or comparative risk assessments. Most fuel-cycle analyses
have been undertaken in industrialised countries, but a few have considered
electricity production in developing countries (such as Lazarus and others,
1995).
Fuel-cycle analyses attempt to account for all damages caused by
physical and chemical processes and activities undertaken to generate
electricity from a specific fuel or resource, from fuel acquisition to waste
disposal in a steady-state operations approach, or from construction to
decommissioning in a facility lifetime approach. Because different insults exert
their impacts over different temporal and spatial scales, the geographic extent
and time horizon of an analysis must be carefully defined to cover all
significant impacts. Contemporary fuel-cycle analyses generally follow a damage
function or impact pathway approach whereby dominant impacts are identified;
stresses (incremental population exposures to air pollution, occupational
hazards, transportation risks) are quantified; stresses are translated to
impacts, typically through exposure-response functions or actuarial data; and
impacts are quantified and aggregated in terms of the study’s chosen metric
(ORNL and RFF, 1992; Curtiss and Rabl, 1996). The study design stage entails a
number of choices on impacts to be considered (public and occupational health,
ecological damage, agricultural losses, material corrosion, visual amenity),
temporal and spatial assessment boundaries, models and hypotheses for analysis,
economic parameters such as the discount rate, and the treatment of accident
scenarios for which no actuarial data exist (such as expected and worst case).
A fuel-cycle analysis typically results in a list of impacts per
unit of output in the form of premature deaths, ecosystem damage, global
warming, and the like. To provide a common metric for comparison, many studies
then attempt to monetise these impacts. This process introduces substantially
more uncertainty and controversy into the process.
Fuel-cycle analyses have typically generated ‘total
cost’ figures in terms of m$ ($0.001) or mECU per kilowatt-hour, with
recent (post-1990) European and U.S. estimates ranging from 0.016-80 m$ per
kilowatt-hour for coal and from 0.002-23 m$ per kilowatt-hour for nuclear (Rabl
and Spadaro, 2000). Given the four orders of magnitude spanned by these fuel
chain damage costs, it is clear that they are sensitive to the particular
designs and metrics of the studies. Accordingly, interpretation of studies’
results requires extensive supplementary information to illuminate, for example,
the specific impacts assessed and the study-specific approaches to valuation of
life, valuation of non-fatal outcomes, weighting of public and occupational
health outcomes, and discount rates. Thus fuel-cycle analysis damage costs
cannot stand alone and are difficult to compare, despite the fact that they may
superficially appear to be based on comparable metrics (dollars per
kilowatt-hour).
Although comparative risk assessment using fuel-cycle analysis
cannot yet indicate unambiguous preferences or even readily allow for
comparisons between studies, recent studies suggest that public health and
occupational health effects dominate the externalities associated with the
nuclear fuel chain. Health effects and global warming dominate conventional coal
technologies (Rabl and Spadaro, 2000). Biomass as an energy resource is less
easily characterised even in terms of dominant impacts because it is highly
dispersed, the nature of its production and use is extremely site-specific, and
its associated damages and benefits depend on other local activities such as
agriculture (Lazarus and others, 1995). Similarly, hydroelectric utilities elude
concise generalisation due to the wide range of sophistication among
technologies and the site-specificity of ecological and human health risks.
Fuel-cycle analyses yield widely disparate conclusions for solar thermal and
dispersed photovoltaic technologies. Some studies, particularly those focusing
on operation of energy systems, suggest that these solar technologies confer
negligible human health and ecological risks (Rabl and Spadaro, 2000). Other
studies assert that the occupational risks and short-term environmental damage
associated with solar technologies can exceed those of conventional electricity
generation methods (Hallenbeck, 1995; Bezdek, 1993).
Pitfalls associated with fuel-cycle analysis include the use of
poorly defined or inconsistent study boundaries, confusion of average and
marginal effects, underestimation of the uncertainty associated with
quantification of damages, neglect or inadequate treatment of environmental
stochasticity, and focus on what is easily quantified rather than on what is
actually significant (Koomey, 1990).
A number of outstanding issues remain for streamlining
approaches to fuel-cycle analysis. These issues include identifying the
functional relations and key parameters defining uncertainty, the variation in
damages with key parameters, the degree of accuracy and resolution with regard
to atmospheric modelling and receptor distribution (needed to capture the
site-specificity of impacts), and the magnitude of error incurred by using
‘typical’ average values rather than detailed, site-specific data
(Curtiss and Rabl, 1996). In addition, metrics used in fuel-cycle analysis to
deal with incommensurate impacts-such as the soiling of buildings, crop damage,
and human morbidity and mortality-are not uniform between studies
A sampling of results from fuel-cycle analyses, which have been
used in a variety of contexts, follows:
· An investigation
of externalities of electricity production from biomass and coal in the
Netherlands suggests that while average private costs for the biomass strategy
assessed are projected to be about twice those for coal in 2005, internalisation
of external damages and benefits would yield about equal social costs. The most
important distinguishing factors between coal and biomass are differences in
carbon dioxide emissions and indirect economic effects such as employment (Faaij
and others, 1998).
· A comparison of fuel-intensive
combustion-based utilities (coal, oil, gas, and biomass), selected renewable
energy technologies (solar thermal, photovoltaic, wind, and hydroelectric), and
nuclear technologies (light water reactor, fast breeder reactor, and
hypothetical fusion reactor) suggests that coal inflicts the greatest delayed
occupational health burden (such as disease), with a central estimate of 0.1
fatalities per gigawatt-year of electricity and an upper estimate of about 3
fatalities per GWy(e). Acute occupational risks (such as accidents) posed by
combustion technologies are purported to be marginally less than those
associated with renewable energy technologies-with central estimates on the
order of 1 fatality per GWy(e)-but greater by an order of magnitude than those
associated with fission technologies and comparable to those for fusion. In the
public health domain, with central estimates of about 2 fatalities per GWy(e),
coal and oil appear to confer greater delayed mortality burdens by a factor of
two (relative to photovoltaic systems) to three or four orders of magnitude
(relative to wind, hydroelectric, and nuclear technologies). While acute risks
associated with renewable energy technologies are highly uncertain, this study
places them as comparable to or somewhat higher than those associated with
fuel-intensive combustion technologies, at 0.1-1.0 fatalities per GWy(e)
(Fritzsche, 1989).
· A study by the Stockholm
Environmental Institute suggests that in terms of greenhouse gas emissions,
natural gas is preferred to residual fuel for electricity generation in
Venezuela, even under the assumption of relatively high methane emissions
through natural gas system losses. In this context the global warming potential
per kilowatt-hour of natural gas electricity generation is projected to be 12-27
percent lower than that associated with residual fuel (Lazarus and others,
1995).
· Since the early
1990s several studies have tried to quantify greenhouse gas emissions associated
with different fuel cycles (see table below). Some of the variability arises
from the different conversion efficiencies of the technologies assessed-for
example, biomass configurations include a wood steam boiler, an atmospheric
fluidised bed combustor, and an integrated gasifier combined-cycle turbine. But
methodological issues and assumptions associated with activities outside the
generation stage account for a large portion of the variability. For example,
one study credits product heat from cogeneration cycles for displacing
greenhouse gases from gas heating systems (Fritsche, 1992). In this framework
the greenhouse gas intensity of biomass can become negative, and that of natural
gas fuel cycles can be reduced 50 percent below the next lowest estimate. Among
fossil fuels, the greenhouse gas intensity of natural gas is most variable,
primarily due to different assumptions about methane emissions during drilling,
processing, and transport. For non-fossil fuels, estimates generally span at
least an order of magnitude, primarily because of the sensitivity of these
cycles to assumptions on the operation life of the facility and the greenhouse
gas intensity of the electric and manufacturing sectors on which equipment
production depends. In addition, the hydroelectric cycle’s greenhouse gas
intensity is sensitive to the area of land flooded and, for projects with
multiple generating units per reservoir, the boundary of the system considered
|
|
Greenhouse gas emission intensities for selected fuels
(grams of carbon dioxide equivalent per kilowatt-hour) |
|
Conventional coal |
Advanced coal |
Oil |
Gas |
Nuclear |
Biomass |
Photovoltaic |
Hydroelectric |
Wind |
|
960-1,300 |
800-860 |
690-870 |
460-1,230a |
9-100 |
37-166a |
30-150 |
2-410 |
11-75 |
Note: These estimates encompass a range of
technologies and countries as described in Pearce and Bann, 1992; Fritsche,
1992; Yasukawa and others, 1992; ORNL and RFF, 1992-98; Gagnon and van de Vate,
1997; and Rogner and Khan, 1998.
a. Natural gas and biomass fuel cycles were also
analysed in cogeneration configurations, with product heat credited for
displacing greenhouse gas emissions from gas heating systems. That approach
reduced greenhouse gas emissions to 220 grams of carbon dioxide equivalent per
kilowatt-hour for natural gas and -400 for biomass (Fritsche, 1992). Other
cycles could incorporate cogeneration and be analysed in this
manner.
It seems that acid deposition world-wide will increasingly
become a nitrogen oxide (and possibly an ammonia) problem rather than a sulphur
dioxide problem. On balance, reductions in acidification in Europe and North
America are likely to continue, but hotspots of damage in the developing world
(such as southwestern China) may persist for years and worsen. Regional ozone
will increasingly be the biggest problem because of the expected difficulties in
mitigating emissions of nitrogen oxides and volatile organic compounds, the two
main precursors of ozone. Only small improvements in regional ozone levels may
occur in North America and Europe in the next 10-20 years. And considerable
deterioration is likely in Asia, Africa, and Latin America, endangering human
health and agricultural production.
Large dams will continue to provide potential for significant
benefits and severe environmental impacts, depending on their location and
design. For sustainability, much better evaluation will be needed to maximise
the benefits and minimise the environmental
impacts.
Global scale
Energy systems generate two-thirds of human-caused greenhouse
gases. Thus energy use is the human activity most closely linked to the
potential for climate change. Climate change is feared to entail significant
direct impacts on human health as well as on Earth’s ecosystems. As noted,
there has been a tendency for environmental problems at the local level to be
solved partly by pushing off the impacts to larger scales. Greenhouse gases and
their potential for global climate change represent the final and, in many ways,
most challenging of the stages. Although there are promising technologies for
fossil systems that capture and sequester the greenhouse gases resulting from
combustion, as well as fossil, nuclear, and solar systems releasing no
greenhouse gases, their prospects are not entirely understood (see chapters 7
and 8).
It is difficult to define a sustainable level of greenhouse
warming above the natural background. Achieving something akin to the natural
background, on the other hand, will not be possible for many centuries, barring
major, unprecedented, and unforeseen technical breakthroughs, global
catastrophes, or changes in human behaviour. What then, might be considered a
workable definition of ‘sustainable’ for the climate change impacts of
the world energy system?
The coming climate change can be considered in two parts:
magnitude (total warming) and rate (annual increase). Some types of impacts are
more sensitive to one than the other. For example, sea level rise is more
sensitive to magnitude, and ecosystem damage is more sensitive to rate. Perhaps
the most worrisome aspect of human-engendered warming, however, is that it
threatens to cause warming at rates completely unprecedented in Earth’s
recent geologic history. The magnitude of potential change is somewhat less
unprecedented. Thus it may be reasonable to establish a somewhat less stringent
definition of sustainability for greenhouse gas emissions-one that calls for
stabilising atmospheric levels as quickly as possible, recognising that the
resulting levels (and their warming) will be considerably higher than the
natural background.
Achieving stable atmospheric levels during the 21st century will
require bringing human greenhouse gas emissions to annual rates substantially
below those today. Doing so will not be easy. Indeed, it will require major
commitments of resources and political will (see the section on the global scale
and chapter 9). The longer such efforts are delayed, the higher and longer will
be the eventual stable warming level and accompanying impacts.
Reaching emission levels in 2050 below those in 2000 will
probably require annual declines in energy intensity of at least 1.4 percent and
in carbon intensity of energy of at least 0.4 percent. With the assumptions in
table 9.1, even these major accomplishments would still allow emissions growth
of 0.4 percent a year to 22 percent above 2000 emissions by 2050. With such
modest growth, however, and 50 years of experience promoting efficient and
low-carbon energy sources, it might be possible to achieve emissions below 2000
levels within a few years after
2050.
Cross-scale
There are important opportunities for ‘no regrets’
strategies that achieve benefits at more than one scale. For example, if
greenhouse gas controls are targeted towards reducing solid fuel use in
households and in other energy systems with large health impacts (such as
vehicle fleets), significant improvements can occur at the local, community, and
global scales. Fine particles are generated and have impacts at all scales, so
control measures will benefit from integrated approaches. Similarly, the
regional impacts from sulphur and nitrogen emissions can be reduced in
conjunction with control efforts at the community and global scales. Much
additional effort is needed to identify environmental control pathways that
optimise these multiple
benefits.
Conclusion
Impacts other than those discussed in this chapter need to be
considered, particularly in local situations. But if the environmental insults
and their ecosystem and health impacts focused on here were controlled as
indicated, the world would have moved most of the way towards a sustainable
energy system.
Among the other impacts requiring careful consideration are the
relationships between energy systems and military, political, and economic
security-the subjects of the next chapter.
Notes
1. Insult is defined here as the physical stressor (such
as air pollution) produced by an energy system. Impact, in contrast, is
defined as the potential negative (or positive) outcome (such as respiratory
disease or forest destruction) affecting humanity. As with other useful terms
(diagnosis, prognosis, pathology) the term insult is borrowed from medicine,
where it is defined as “a generic term for any stressful stimulus, which
under normal circumstances does not affect the host organism, but may result in
morbidity when it occurs in a background of pre-existing compromising
conditions” (Segen, 1992). It has been used in environmental discussions,
however, since at least the mid-1970s (see Ehrlich and others, 1977).
2. Modern fuels involve extensive fuel cycles with relevant
environmental impacts and energy efficiencies at several points. The air
pollution exposures per meal are still lower than that from solid fuels,
however.
3. The burden of disease refers to the total healthy life years
lost due to this risk factor. It is composed of two parts that are added
together: life years lost to deaths and life years lost to diseases and injuries
weighted by a severity factor.
4. These include the main gaseous pollutants as well as
particulates. For lead emissions, the overall reduction in hazard per vehicle
mile was about 75 percent (US Census Bureau, 1996; USEPA, 1996).
5. PM10 are particles less than 10 microns
(millionths of a meter) in size, which penetrate deeper into the respiratory
system than larger particles.
6. The World Commission on Dams, which began deliberating in
1998, is publishing its reports in mid-2000 (WCD, 1999). These will include 8-10
case studies examining social, economic, environmental, energy, financial,
managerial, and other aspects plus a database of 150 dams in different
countries.
7. This section draws heavily on IPCC (1996a, b). The IPCC was
established by the World Meteorological Organization and United Nations
Environment Programme in 1988 to assess the scientific, technological, economic,
and social aspects of anthropogenic climate change. Some 2,000 scientists and
other specialists from more than 40 countries served as authors and reviewers of
the 17 volumes of exposition and analysis issued by the IPCC through 1996. The
IPCC’s first assessment report, completed in late 1990, served as the basis
for the negotiations of the United Nations Framework Convention on Climate
Change, concluded in 1992 and discussed below.
8. The mean global surface temperature of the Earth is about 15
degrees Celsius (59 degrees Fahrenheit). Without greenhouse gases, it would be
-18 degrees Celsius (0 degrees Fahrenheit).
9. Combustion emits water vapour and carbon dioxide in
comparable quantities. But the rate of water addition to the global atmosphere
by combustion is tens of thousands of times smaller than the rates of addition
and removal by evaporation and precipitation. And because the added water
remains in the atmosphere only a few days, these human additions cause at most
local effects and no long-term build-up. In contrast, the quantity of carbon
dioxide added by combustion is only about 10 times smaller than what is added
and removed by natural photosynthesis and decomposition, and a large part of the
anthropogenic increment remains in the atmosphere for decades. Thus it has time
to become uniformly distributed around the globe, irrespective of where it was
emitted, and to accumulate over long periods (as long as the sum of the natural
and anthropogenic addition rates is greater than the removal rate).
10. There is no net accumulation of carbon dioxide in the
atmosphere from combustion of wood and other biomass fuels, as long as new plant
growth replaces what is burned. This is because a growing plant removes from the
atmosphere exactly as much carbon dioxide as is released when the plant
decomposes or burns. When new growth does not replace what is burned or
decomposed, as in deforestation, a net addition of carbon dioxide to the
atmosphere results. (See the section on greenhouse gas emissions at the
household scale, for a discussion of non-carbon dioxide greenhouse gas emissions
from incomplete biomass combustion.)
11. Feedbacks are phenomena wherein the consequences of a
disturbance act back on its cause, making the disturbance either bigger
(positive feedback) or smaller (negative feedback) than it started out.
12. The first and longest-running series of measurements was
initiated by Charles Keeling at a monitoring station atop the Mauna Loa volcano
on the island of Hawaii.
13. The main such terrestrial ‘sinks’ for atmospheric
carbon are in the Northern hemisphere (see Houghton, 1996; Fan and others,
1998).
14. Particles in the atmosphere exert both cooling and warming
effects on the Earth’s surface temperature, depending on the
characteristics of the specific particles in terms of absorption and scattering
of incoming solar and outgoing terrestrial radiation, and on the roles of
different particles in cloud formation. Averaged over the globe and the
different types of anthropogenic particles, the net effect is cooling.
15. Because particulate matter and its gaseous precursors have
much shorter residence times in the atmosphere than any of the major greenhouse
gases, its offset of part of the greenhouse effect will shrink in line with
declining particulate and precursor emissions.
16. This range corresponds to 0.54-1.08 degrees Fahrenheit, but
the two-significant-figure precision resulting from applying the exact
conversion (1 degree Celsius = 1.8 degrees Fahrenheit) is illusory. The warming
is not uniform, however, being generally greater near the poles than near the
equator. And because of the complexity of the heat transfer processes of the
climatic system, some regions may get colder even as the globe gets warmer on
average.
17. The most sophisticated models demonstrate the fundamental
soundness of their representations of global climatic processes by simulating
quite accurately the undisturbed climate of the planet in respects such as the
variation of geographic patterns of temperature and precipitation with the
changes of the seasons.
18. Temperatures would continue to rise thereafter, even in the
cases in which the atmospheric concentrations of greenhouse gases had been
stabilised by then, because of the climate-response lag time caused by the
thermal inertia of the oceans.
19. Non-linear means that small disturbances can have
large consequences. Forcing is the technical term for an externally
imposed disturbance, such as a change in greenhouse gas concentrations. An
example of a potential positive feedback on global warming from terrestrial
ecosystems is that the warming could increase the rate of release of greenhouse
gases into the atmosphere from decomposition of dead organic matter in forests
and swamps.
20. The discussion here is drawn from a treatment prepared by
one of the authors (Holdren) for the report of the Panel on International
Cooperation in Energy Research, Development, Demonstration, and Deployment,
President’s Committee of Advisors on Science and Technology (PCAST, 1999).
21. See IPCC (1996b). Both trends-an increase in rainfall and an
increase in the fraction of it occurring in extreme events-have been
convincingly documented for the period since 1900 in the United States (Karl and
Knight, 1998).
22. The improvements in agricultural productivity foreseen for
some regions by the IPCC are due partly to carbon dioxide fertilisation of plant
growth, partly to increased water availability from increased precipitation, and
partly to technological change. Although the IPCC discusses at length how plant
pests and pathogens could prove increasingly problematic in a greenhouse
gas-warmed world, these possibilities do not seem to be fully reflected in the
productivity projections.
23. This section draws heavily on material written by one of the
authors (Holdren) for the report of the Panel on Federal Energy Research and
Development, President’s Committee of Advisors on Science and Technology
(PCAST, 1997).
24. Annex 1 countries, as defined in the UNFCCC, are OECD
countries plus the countries of Eastern Europe and some of those of the former
Soviet Union (the Baltics, Belarus, Russia, Ukraine).
References
Agarwal, B. 1985. Cold Hearths, Barren Slopes. New Delhi: Allied
Pubs.
Akimoto, H., H. Mukai, M. Nishikawa, K. Murano, S. Hatakeyama,
C. Liu, M. Buhr, K.J. Hsu, D.A. Jaffe, L. Zhang, R. Honrath, J.T. Merrill, and
R.E. Newell. 1996. “Long-range Transport of Ozone in the East Asian Pacific
Rim Region.” Journal of Geophysical Research 101: 1999-2010.
Albright, D., and H.A. Feiveson. 1988. “Plutonium Recycling
and the Problem of Nuclear Proliferation.” Annual Review of Energy
13: 239-65.
American Honda Motor Company. 1999. “Honda Hybrid To Be
Called ‘Insight’-Will Feature (IMA) Integrated Motor Assist System,
Lightweight Aluminum Body Structure.”
https://www.honda2000.com/insight/press.html
Armstrong, J., and R. Menon. 1998. “Mining and
Quarrying.” In J.M. Stellman, ed., Encyclopaedia of Occupational Health
and Safety. 4th ed. Geneva: International Labour Organization.
Arndt, R.L., G.R. Carmichael, D.G. Streets, and N. Bhatti. 1997.
“Sulfur Dioxide Emissions and Sectoral Contributions to Sulfur Deposition
in Asia.” Atmospheric Environment 31: 1553-72.
Arthur, E.A., ed. 1997. “Technology Development Examples
Applicable to Nuclear Energy and Fuel-Cycle Improvement.” Report
LA-UR-97-2989. Los Alamos National Laboratory and Sandia National Laboratory,
Los Alamos, N.M.
Bascom, R., and others. 1996. “Health Effects of Outdoor
Air Pollution. American Journal of Respiratory Critical Care Medicine
153: 477-98.
Bezdek, R. H. 1993. “The Environmental, Health, and Safety
Implications of Solar Energy in Central Station Power Production.”
Energy 18 (6): 681-85.
Bolin, B. 1998. “The Kyoto Negotiations on Climate Change:
A Science Perspective.” Science 279: 330-31.
Bourke, G. 1988. “Subduing the Sea’s Onslaught.”
South (July).
Bower, B.T., and others. 1987. “Guide for Analysis for
Integrated Residuals Management.” Draft final report. Resources for the
Future, Washington, D.C.
BP (British Petroleum). 1998. BP Statistical Review of World
Energy 1998. London.
Brauer, M., and J. Hisham-Hashim. 1998. “Fires in
Indonesia: Crisis and Reaction.” Environmental Science and Technology
9: 404A-407A.
Braunstein, H.M., and others. 1981. Biomass Energy Systems
and the Environment. New York: Pergamon Press.
Brimblecombe, P. 1987. The Big Smoke: A History of Air
Pollution in London since Medieval Times. London: Methuen.
Broecker, W.S. 1997. “Thermohaline Circulation, the
Achilles Heel of Our Climate System: Will Man-made CO2 Upset the
Current Balance?” Science 278: 1582-88.
Brouwer, I.D. 1994. “Food and Fuel: A Hidden Dimension in
Human Nutrition.” Diss. Wageningen University, Netherlands.
Burtraw, D., and E. Mansur 1999. “Environmental Effects of
SO2 Trading and Banking.” Environmental Science &
Technology 33 (20): 3489-94.
California Energy Commission. 1998. “Electric
Vehicles.” https://www.energy.ca.gov/afvs/ev/q_a.html
California Environmental Protection Agency. 1999. “Fuel
Cell Electric Vehicles Fact Sheet.” Air Resources Board Zero-Emission
Vehicles Program. https://www.arb.ca.gov/msprog/zevprog/fuelcell/fcell_fs.pdf
Carpenter, L., and others. 1990. “Health Related Selection
and Death Rates in the United Kingdom Atomic Energy Authority Workforce.”
British Journal of Industrial Medicine 47 (4): 248-58.
Carpenter, R.A., and others. 1990. Environmental Risk
Assessment: Dealing with Uncertainty in Environmental Impact Assessment.
Manila: Asian Development Bank.
Chameides, W.L., P.S. Kasibhatla, J. Yienger, and H. Levy. 1994.
“Growth of Continental-scale Metro-agro-plexes, Regional Ozone Pollution,
and World Food Production.” Science 264: 74-77.
Charlson, R.J., S.E. Schwartz, J.M. Hales, R.D. Cess, J.A.
Coakley, J.E. Hansen, and J. Hoffman. 1992. “Climate Forcing by
Anthropogenic Aerosols.” Science 255: 423-30.
Charpak, G., and R.L. Garwin. 1997. Feux Follets et
Champignons Nucleaires. Paris: Editions Odile Jacob.
Collier, M., R.H. Webb, and J.C. Schmidt. 1996. “Dams and
Rivers: Primer on the Downstream Effects of Dams.” Circular 1126. U.S.
Geological Survey, Branch of Information Services, Tucson, Ariz., and Denver,
Colo.
Crane, M. 1998. “Power Generation and Distribution.”
In J.M. Stellman, ed., Encyclopaedia of Occupational Health and Safety.
4th ed. Geneva: International Labour Organization.
Curren, T., and A. Nixon. 1992. “Current Issue Review: Acid
Rain.” Library of Parliament, Research Branch, Ottawa, Canada.
Curtiss, P.S., and A. Rabl. 1996. “Impacts of Air
Pollution: General Relationships and Site Dependence.” Atmospheric
Environment 30: 3331-47.
Dixon, J.A., and others. 1989. Dams and the Environment:
Considerations in World Bank Projects. Washington, D.C.: World Bank.
Dohan, M.R., and others. 1974. “The Effect of Specific
Energy Uses on Air Pollutant Emissions in New York City.” Brookhaven
National Laboratory, Upton, NY.
Dunn, S. 1998. “Hydroelectric Power Up Slightly.”
In VitalSigns. New York: Norton and Co.
Dvorak, A.J., and B.G. Lewis. 1978. “Impacts of Coal-fired
Power Plants on Fish, Wildlife, and Their Habitats.” Argonne National
Laboratory, Division of Environmental Impact Studies, Ann Arbor, Mich.
Dynesius, M., and C. Nilsson. 1994. “Fragmentation and Flow
Regulation of River Systems in the Northern Third of the World.” Science
266 (4): 759-62.
Ehrlich, P.R., and others. 1977. Ecoscience: Population,
Resources, Environment. San Francisco, Calif.: W.H. Freeman.
EIA (Energy Information Administration). 1995. Electricity
Generation and Environmental Externalities: Case Studies. Washington, D.C.:
U.S. Department of Energy.
Elkins, P. 1996. “How Large a Carbon Tax Is Justified by
the Secondary Benefits of CO2 Abatement?” Resource and Energy
Economics 18: 161-87.
Environment Canada. 1999. “A Primer on Environmental
Citizenship.” https://www.ns.ec.gc.ca/aeb/ssd/acid/acidfaq.html
Evans, J.S. 1991. “Radiological Health Effects Models for
Nuclear Power Plant Accident Consequence Analysis: An Update (1990).”
Nuclear Technology 94 (2): 204-12.
Faaij, A., and others. 1998. “Externalities of Biomass
Based Electricity Production Compared with Power Generation from Coal in the
Netherlands.” Biomass and Bioenergy 14 (2): 125-47.
Fearnside, P. 1995. “Hydroelectric Dams in the Brazilian
Amazon as Sources of ‘Greenhouse’ Gases.” Environmental
Conservation 22(1).
Florig, H.K. 1997. “China’s Air Pollution Risks.”
Environmental Science and Technology 31(6): 276A-79A.
Foell, W., M. Amann, G. Carmichael, M. Chadwick, J. Hettelingh,
L. Hordijk, and D. Zhao, eds. 1995. RAINS-ASIA: An Assessment Model for Air
Pollution in Asia. Washington, D.C.: World Bank.
Ford Motor Company. 1998. “1998 Ford Ranger Electric
Vehicle Specifications.”
https://wwwu.ford.com/electricvehicle/rangspecs.html
Ford Motor Company. 2000. “Crown Victoria Natural Gas
Vehicle Specifications.” https://www.ford.com/default.asp?pageid=429
Fritsche, U. 1992. “TEMIS: A Computerized Tool for Energy
and Environmental Fuel and Life-Cycle Analysis.” Paper presented at an
International Energy Agency expert workshop on Life-Cycle Analysis of Energy
Systems: Methods and Experience, Paris.
Fritzsche, A.F. 1989. “The Health Risks of Energy
Production.” Risk Analysis 9 (4): 565-77.
Fthenakis, V.M., and others. 1995. “An Assessment of
Mercury Emissions and Health Risks from a Coal-Fired Power Plant.”
Journal of Hazardous Materials 44 (2-3): 267-83.
Funk, K., and A. Rabl. 1999. “Electric Versus Conventional
Vehicles: Social Costs and Benefits in France.” Transport and
Environment 4 (6): 397-411.
Gagnon, L. 1998. “Greenhouse Gas Emissions from Hydro
Reservoirs: The Level of Scientific Uncertainty in 1998.” Hydro-Quebec,
Montreal.
Gagnon, L., and J.P. van de Vate. 1997. “Greenhouse Gas
Emissions from Hydropower.” Energy Policy 25 (1): 7-13.
General Motors Corporation. 1999. “EV1 Electric:
Specs/Pricing.” https://www.gmev.com/specs/specs.htm
GFDL (Geophysical Fluid Dynamics Laboratory). 1997. Climate
Impact of Quadrupling Atmospheric CO2. National Oceanic and
Atmospheric Administration, Princeton, N.J.
Gilinksy, V. 1977. “Plutonium, Proliferation, and
Policy.” Technology Review 79(4): 58-65.
Gleick, P.H. 1992. “Environmental Consequences of
Hydroelectric Development: The Role of Size and Type”. Energy
17:735-47.
Global Toyota. 1999. “Future Vehicles: RAV4 EV.”
https://www.toyota.com
Gould, J., and T.F. Golob. 1997. “Clean Air Forever? A
Longitudinal Analysis of Options about Air Pollution and Electric
Vehicles.” University of California at Irvine, Institute of Transportation
Studies.
Grossman, G., and A. Krueger. 1994. “Economic Growth and
the Environment.” NBER Working Paper 4634. National Bureau of Economic
Research, Cambridge, Mass.
Gupta, N. 1989. “Health Implications of Nuclear
Energy.” Economic and Political Weekly 24 (39): 2166.
Habegger, L.J., and others. 1982. Direct and Indirect Health
and Safety Impacts of Electrical Generation Options. Vienna: International
Atomic Energy Agency.
Haefele, W. 1990. “Energy from Nuclear Power.”
Scientific American 9: 136-44.
Hallenbeck, W.H. 1995. “Health Impact of a Proposed
Waste-to-Energy Facility in Illinois.” Bulletin of Environmental
Contamination and Toxicology 54 (3): 342-48.
Hanisch, C. 1999. “Powering Tomorrow’s Cars.”
Environmental Science and Technology 33 (11): 458A-62A.
Hayes, P., and K.R. Smith, eds. 1994. Global Greenhouse
Regime: Who Pays? London and Tokyo: Earthscan and United Nations University
Press.
Hiraoka, T. 1994. “Nuclear Electricity Generation by
Seawater Uranium. Journal of the Atomic Energy Society of Japan 36(7):
644-45.
Holdren, J.P. 1983. “Nuclear Power and Nuclear Weapons: The
Connection Is Dangerous.” Bulletin of the Atomic Scientists 1.
Holdren, J.P. 1989. “Civilian Nuclear Technologies and
Nuclear Weapons Proliferation.” In C. Schaerf, B. Holden-Reid, and D.
Carlton, eds., New Technologies and the Arms Race. London: Macmillan.
Holdren, J.P. 1992. “The Transition to Costlier
Energy.” In L. Schipper and S. Meyers, eds., Energy Efficiency and Human
Activity: Past Trends, Future Prospects. Cambridge: Cambridge University
Press.
Holgate, S.T., and others, eds. 1999. Air Pollution and
Health. San Diego, Calif.: Academic Press.
Holland, M. 1996. “Quantifying the Externalities of Fuel
Cycle Activities outside the European Union.” Maintenance Note 1 for the
ExternE CORE Project, Energy Technology Support Unit. Didcot, Oxfordshire.
Hong Kong Municipal Government. 1999. “Air Pollution
Components, Effects and Causes.” Planning, Environment, and Lands Bureau.
https://www.plb.gov.hk/cleanair/cne.htm
Horii, N. 1999. “Evolution of Energy Demand after
China’s Economic Reform.”
Horne, A. J., and C.R. Goldman. 1994. Limnology. New
York: McGraw-Hill.
Houghton, J.T., and others, eds. 1994. Climate Change 1994:
Radiative Forcing of Climate Change and an Evaluation of the IPCC IS92 Emission
Scenarios. Cambridge: Cambridge University Press.
Huang, M., Z. Wang, D. He, H. Xu, and L. Zhou. 1995.
“Modeling Studies on Sulfur Deposition and Transport in East Asia.
Water, Air and Soil Pollution 85: 1921-26.
IARC (International Agency for Research on Cancer). 1984.
Carcinogenicity Monographs 1984.
Ichikawa, Y., and S. Fujita. 1995. “An analysis of Wet
Deposition of Sulfate Using a Trajectory Model for East Asia.” Water,
Air and Soil Pollution 85: 1927-32.
ILO (International Labour Organization). 1998. Yearbook of
Labour Statistics. Geneva.
IPCC (Intergovernmental Panel on Climate Change). 1990.
Climate Change: The IPCC Scientific Assessment. Cambridge: Cambridge
University Press.
IPCC (Intergovernmental Panel on Climate Change). 1995.
Climate Change 1994: Radiative Forcing of Climate Change. Cambridge:
Cambridge University Press.
IPCC (Intergovernmental Panel on Climate Change). 1996a.
Climate Change 1995: Impacts, Adaptations, and Mitigation of Climate Change:
Scientific-Technical Analyses. Cambridge: Cambridge University Press.
IPCC (Intergovernmental Panel on Climate Change). 1996b. The
Science of Climate Change: Summary for Policymakers and Technical Summary of the
Working Group I Report. Cambridge: Cambridge University Press.
Jaffe, D.A., R.E. Honrath, L. Zhang, H. Akimoto, A. Shimizu, H.
Mukai. K. Murano, S. Hatakeyama, and J. Merrill. 1996. Journal of Geophysical
Research 101: 2037-48.
Jenkins, S.A., and others. 1988. “The Impacts of Dam
Building on the California Coastal Zone.” California Waterfront Age
(September).
Jennings N.S. 1998. “Mining: An Overview.” In J.M.
Stellman, ed., Encyclopaedia of Occupational Health and Safety. 4th ed.
Geneva: International Labour Organization.
Johnson, C.E., and R.G. Derwent. 1996. “Relative Radiative
Forcing Consequences of Global Emissions of Hydrocarbons, Carbon Monoxide and
Nitrogen Oxide from Human Activities Estimated with a Zonally-Averaged
Two-Dimensional Model.” Climatic Change 34 (3-4): 439-62.
Johnson, F.R., and W. H. Desvousges. 1997. “Estimating
Stated Preferences with Rated-pair Data: Environmental, Health, and Employment
Effects of Energy Programs.” Journal of Environmental Economics and
Management 34 (1): 79-99.
Karl, T.R., and R.W. Knight. 1998. “Secular Trends of
Precipitation Amount, Frequency, and Intensity in the USA.” Bulletin of
the American Meteorological Society 79: 231-41.
Kiehl, J.T., and others. 2000. “Radiative Forcing due to
Sulfate Aerosols from Simulations with the National Center for Atmospheric
Research Community Climate Model, Version 3.” Journal of Geophysical
Research-Atmospheres 105 (D1): 1441-57.
Kjellstrom, T. 1994. “Issues in the Developing World.”
In L. Rosenstock and M. Cullen, eds., Textbook of Clinical Occupational and
Environmental Medicine. Philadelphia, Pa.: W.B. Saunders and Co.
Kjellstrom, T., J.P. Koplan, and R.B. Rothenberg. 1992.
“Current and Future Determinants of Adult Ill Health. In R. Feachem and
others, eds., The Health of Adults in the Developing World. Oxford:
Oxford University Press.
Knutson, T.R., R. E. Tuleya, and Y. Kurihara. 1998.
“Simulated Increase of Hurricane Intensities in a CO2-warmed
Climate.” Science 279: 1018-20.
Koomey, J. 1990. “Comparative Analysis of Monetary
Estimates of External Environmental Costs Associated with Combustion of Fossil
Fuels.” University of California, Lawrence Berkeley Laboratory, Applied
Science Division.
Kraus, R.S. 1998. “Oil Exploration and Drilling.” In
J.M. Stellman, ed., Encyclopaedia of Occupational Health and Safety. 4th
ed. Geneva: International Labour Organization.
Krebs, M. 1999. “Promise, and Pitfalls, of Fuel
Cells.” The New York Times, 2 April, F1.
Kremer, J. 2000. “MOBILE6 and Compressed Natural Gas
Vehicles.” U.S. Environmental Protection Agency, Office of Mobile Sources,
Washington, D.C.
Krewitt, W., T. Heck, A. Truckenmueller, and R. Friedrich. 1999.
“Environmental Damage Costs from Fossil Electricity Generation in Germany
and Europe.” Energy Policy 27: 173-83.
Krewitt, W., and others. 1998. “Health Risks of Energy
Systems.” Risk Analysis 18 (4): 377-83.
Lal, M, K. Gauri, and G.C. Holdren. 1981. “Pollutant
Effects on Stone Monuments.” Environmental Science and Technology
15: 386-90.
Lal, M., U. Cubasch, R. Voss, and J. Waszkewitz. 1995.
“Effect of Transient Increase in Greenhouse Gases and Sulphate Aerosols on
Monsoon Climate.” Current Science 69: 752-63.
Lazarus, M., and others. 1995. The SEI/UNEP Fuel Chain
Project: Methods, Issues and Case Studies in Developing Countries. Boston,
Mass.: Stockholm Environment Institute-Boston.
Leach, Gerald. 2000. Personal communication.
Leigh, J., P. Macaskill, C. Corvalan, E. Kuosma, and J. Mandryk.
1996. “Global Burden of Disease and Injury Due to Occupational
Factors.” WHO/EHG/96.20. World Health Organization, Geneva.
Lelieveld, J., and others. 1997. “Terrestrial Sources and
Distribution of Atmospheric Sulphur.” Philosophical Transactions of the
Royal Society of London Series B-Biological Sciences 352 (1350): 149-58.
Lerman, Y., A. Finkelstein, and others. 1990. “Asbestos
Related Health Hazards among Power Plant Workers.” British Journal of
Industrial Medicine 47 (4): 281-82.
Lew, C.S., and others. 1996. “Use of the Pisces Database:
Power Plant Aqueous Stream Compositions.” Water, Air and Soil Pollution
90: 113-22.
Lovei, M. 1998. Phasing Out Lead from Gasoline: Worldwide
Experience and Policy Implications. World Bank Technical Paper 397.
Washington, D.C.
Lydersen, E., V. Angell, O. Eilertsen, T. Larssen, J. Mulder,
I.P. Muniz, H.M. Seip, A. Semb, R.D. Vogt, and P. Aagaard. 1997. “Planning
of an Integrated Acidification Study and Survey on Acid Rain Impacts in
China.” Norwegian Institute for Water Research Report SNO 3719-97. Oslo,
Norway.
MacKenzie, J. 1997. Climate Protection and the National
Interest: The Links among Climate Change, Air Pollution, and Energy
Security. Washington, D.C.: World Resources Institute.
Mage, D.R., and O. Zali, eds. 1992. “Motor Vehicle Air
Pollution: Public Health Impact and Control Measures.” WHO/PEP/92.4. World
Health Organization, Geneva.
Mann, M.E., R.S., Bradley, and M.K. Hughes. 1998.
“Global-scale Temperature Patterns and Climate Forcing over the Past Six
Centuries.” Nature 392: 779-87.
Mann, M.E., R.S., Bradley, and M.K. Hughes. 1999. “Northern
Hemisphere Temperatures during the Past Millennium: Inferences, Uncertainties,
and Limitations.” Geophysical Research Letters (15 March).
Mark, J., J. M. Ohi, and D.V. Hudson, Jr. 1994. “Fuel
Savings and Emissions Reductions from Light Duty Fuel Cell Vehicles.”
NREL/TP-463-6157. National Renewable Energy Laboratory, Golden, Colo.
Matsumoto, S., A. Inaba, and Y. Yanagisawa. 1997.
“Technology Assessment of Alternative Fuels by CO2 Fixation Use
in Passenger Cars.” Energy Conversion and Management 38: S455-60.
McCully, P. 1996. Silenced Rivers: The Ecology and Politics
of Large Dams. London: Zed Books.
McGranahan, G., and others. 2000. Citizens at Risk: From
Urban Sanitation to Sustainable Cities. London: Earthscan.
McManus, N. 1998. “Hydroelectric Power Generation.” In
J.M. Stellman, ed., Encyclopaedia of Occupational Health and Safety. 4th
ed. Geneva: International Labour Organization.
McMichael, A.J., E. Haines, R. Slooff, and S. Kovats, eds. 1996.
“Climate Change and Human Health.” Assessment Prepared by a Task Group
on behalf of the World Health Organization, World Meteorological Organization,
and United Nations Environment Programme. Geneva, Switzerland.
Mendler, C. 1997. “Taking a New Look at Hybrid Electric
Vehicle Efficiency.” Automotive Engineering 105 (2): 67-70.
Mills, W.B., and others. 1998. “Predictions of Potential
Human Health and Ecological Risks from Power Plant Discharges of Total Residual
Chlorine and Chloroform into Rivers.” Environmental Science &
Technology 32 (14): 2162-71.
Moffit, A. 1998. “Iron and Steel.” In J.M. Stellman,
ed., Encyclopaedia of Occupational Health and Safety. 4th ed. Geneva:
International Labour Organization.
Morison, W.G. 1998. “Nuclear Power Generation.” In
J.M. Stellman, ed., Encyclopaedia of Occupational Health and Safety. 4th
ed. Geneva: International Labour Organization.
Morris, S.C., and others. 1980. “Health and Environmental
Effects of the National Energy Plan: A Critical Review of Some Selected
Issues.” Brookhaven National Laboratory, Upton, NY.
Moskowits, P.D., M.D. Rowe, and others. 1977. “Workshop
Report on Quantifying Environmental Damage from Energy Activities.”
Brookhaven National Laboratory, National Center for Analysis of Energy Systems,
Office of Environmental Policy, Upton, NY.
MRC (Medical Research Council). 1996. Electrification and
Health: The Interface between Energy, Development, and Public Health.
Community Health Research Group. Tygerberg, South Africa.
Murray, C., and A. Lopez, eds. 1996. Global Burden of
Disease. World Health Organization, World Bank, and Harvard School of Public
Health. Cambridge, Mass.: Harvard University Press.
Nakicenovic, N., A. Grübler, and A. McDonald, eds. 1998.
Global Energy Perspectives. Cambridge: Cambridge University Press.
NAPAP (National Acid Precipitation Assessment Program). 1998.
Biennial Report to Congress: An Integrated Assessment. National Science and
Technology Council, Committee on Environment and Natural Resources.
Washington, D.C. https://www.nnic.noaa.gov/CENR/NAPAP/NAPAP_96.htm
Nash, L. 1993. “Water Quality and Health.” In P.H.
Gleick, ed., Water in Crisis: A Guide to the World’s Fresh Water
Resources. New York: Oxford University Press.
National Academy of Sciences. 1994. Management and
Disposition of Excess Weapons Plutonium. Washington, D.C.: National Academy
Press.
National Academy of Sciences. 1995. Management and
Disposition of Excess Weapons Plutonium: Reactor-Related Options.
Washington, D.C.: National Academy Press.
National Fuel Cell Research Center. 1999. “What Is a Fuel
Cell?” https://www.nfcrc.uci.edu/fcinfo/what.htm
National Research Council. 1992. Nuclear Power: Technical and
Institutional Options for the Future. Committee on Future Nuclear Power
Development. Washington, D.C.: National Academy Press.
National Research Council. 1998. Research Priorities for
Airborne Particulate Matter. ational Academy of Sciences, Washington, D.C.
Natural Gas Vehicle Coalition. 2000a. “Questions and
Answers about Natural Gas Vehicles.” https://www.ngvc.org/qa.html
Natural Gas Vehicle Coalition. 2000b. “The NGV Message:
Environmental and Health Benefits.” https://www.ngvc.org/ngvmess.html
Neil, D. 1999. “Pump This.” Car and Driver 44
(10): 110-16.
Nriagu, J.O. 1989. “A Global Assessment of Natural Sources
of Atmospheric Trace Metals.” Nature 338 (6210): 47-49.
Nriagu, J.O. 1990. “Global Metal Pollution: Poisoning the
Biosphere.” Environment 32 (7): 6-16.
Office of Science and Technology Policy. 2000. White House
Initiative on Global Climate Change, Washington D.C.
www.whitehouse.gov/Initiatives/Climate/greenhouse.html
Olivier, J.G.J., A.F. Bouwman, K.W. Van der Hoek, and J.J.M.
Berdowski. 1998. “Global Air Emission Inventories for Anthropogenic Sources
of NOx, NH3, and N2O in 1990.”
Environmental Pollution 102: 135-48.
Olivier, J.G.J., A.F. Bouwman, C.W.M. van der Maas, J.J.M.
Berdowski, C. Veldt, J.P.J. Bloos, A.J.H. Visschedijk, P.Y.J. Zandveld, and J.L.
Haverlag. 1996. “Description of EDGAR Version 2.0.” RIVM Report 771060
002. Bilthoven, the Netherlands.
Oppenheimer, M. 1998. “Global Warming and the Stability of
the West Antarctic Ice Sheet.” Nature 393: 325-32.
ORNL and RFF (Oak Ridge National Laboratory and Resources for
the Future). 1992. “U.S.-EC Fuel Cycle Study: Background Document to the
Approach and Issues.” Oak Ridge, Tenn.
ORNL and RFF (Oak Ridge National Laboratory and Resources for
the Future). 1994a. Estimating Externalities of Coal Fuel Cycles. Oak
Ridge, Tenn.
ORNL and RFF (Oak Ridge National Laboratory and Resources for
the Future). 1994b. Estimating Externalities of Hydroelectric Fuel
Cycles. Oak Ridge, Tenn.
ORNL and RFF (Oak Ridge National Laboratory and Resources for
the Future). 1994c. Fuel Cycle Externalities: Analytical Methods and
Issues. Oak Ridge, Tenn.
ORNL and RFF (Oak Ridge National Laboratory and Resources for
the Future). 1995. Estimating Externalities of Nuclear Fuel Cycles. Oak
Ridge, Tenn.
ORNL and RFF (Oak Ridge National Laboratory and Resources for
the Future). 1996. Estimating Externalities of Oil Fuel Cycles. Oak
Ridge, Tenn.
ORNL and RFF (Oak Ridge National Laboratory and Resources for
the Future). 1998a. Estimating Externalities of Biomass Fuel Cycles. Oak
Ridge, Tenn.
ORNL and RFF (Oak Ridge National Laboratory and Resources for
the Future). 1998b. Estimating Externalities of Natural Gas Fuel Cycles.
Oak Ridge, Tenn.
Osepchuk, J.M. 1996. “Health and Safety Issues for
Microwave Power Transmission.” Solar Energy 56 (1): 53-60.
OTA (Office of Technology Assessment). 1992. Fueling
Development: Energy Technologies for Developing Countries. OTA-E516.
Washington, D.C.: U.S. Government Printing Office.
Page, W.P., and others. 1982. “Direct Monetary Losses to
the Agricultural Sector from Coal-fired Electricity Generation and Background: A
Regional Analysis.” Energy 7 (9): 759-68.
PCAST (President’s Committee of Advisors on Science and
Technology). 1997. “Federal Energy Research and Development for the
Challenges of the 21st Century.” Office of Science and Technology Policy,
Panel on Energy Research and Development, Washington, D.C.
PCAST (President’s Committee of Advisors on Science and
Technology). 1999. “Powerful Partnerships: The Federal Role in
International Cooperation on Energy Innovation.” Office of Science and
Technology Policy, Panel on International Cooperation in Energy Research,
Development, Demonstration, and Deployment, Washington, D.C.
Pearce, D., and C. Bann. 1992. “The Social Costs of
Electricity Generation in the U.K.” Paper presented at an International
Energy Agency expert workshop on Life-Cycle Analysis of Energy Systems: Methods
and Experience, Paris.
Penner, J.E., S.J. Ghan, and J.J. Walton. 1991. “The Role
of Biomass Burning in the Budget and Cycle of Carbonaceous Soot Aerosols and
Their Climate Impact.” In J.S. Levine, ed., Global Biomass Burning:
Atmospheric, Climatic, and Biospheric Implications. Cambridge, Mass.: MIT
Press.
Peterson, T.C., K.P. Gallo, J. Lawrimore, T.W. Owen, A. Huang,
and D.A. McKittrick. 1999. “Global Rural Temperature Trends.”
Geophysical Research Letters 26: 329-32.
Petrini, C., and P. Vecchia. 1993. “Health Problems Related
to High-Power Transmission Lines [in Italian].” Aei Automazione Energia
Informazione 80 (4): 430-33.
Piccot, S.D., J.J. Watson, and J.W. Jones. 1992. “A Global
Inventory of Volatile Organic Compound Emissions from Anthropogenic
Sources.” Journal of Geophysical Research 97: 9897-9912.
Poschen, P. 1998. “Forestry.” In J.M. Stellman, ed.,
Encyclopaedia of Occupational Health and Safety. 4th ed. Geneva:
International Labour Organization.
Pottinger, I. 1997. “The Environmental Impacts of Large
Dams.” International Rivers Network.
https://www.irn.org/basics/impacts.shtml Rabl, A. 1998. “Mortality Risks of
Air Pollution: The Role of Exposure-response Functions.” Journal of
Hazardous Materials 61 (1-3): 91-98.
Rabl, A. and J.V. Spadaro. 1999. “Damages and Costs of Air
Pollution: An Analysis of Uncertainties.” Environment International
25 (1): 29-46.
Rabl, A. and J.V. Spadaro. 2000. “Public Health Impact of
Air Pollution and Implications for the Energy System.” Annual Review of
Energy and the Environment 25.
Rabl, A., and others. 1998. “Health Risks of Air Pollution
from Incinerators: A Perspective.” Waste Management & Research
16 (4): 365-88.
Reddy, A.K.N., R.H. Williams, and T.B. Johansson. 1997.
Energy after Rio: Prospects and Challenges. New York: United Nations
Development Programme.
Repetto, R., and D. Austin. 1997. The Costs of Climate
Protection: A Guide for the Perplexed. Washington, D.C.: World Resources
Institute.
Rogner, H.-H. and A. Khan. 1998. “Comparing Energy Options:
The Inter-agency DECADES Project.” IAEA Bulletin 40 (1).
Ross, M., R. Goodwin, R. Watkins, M.Q. Wang, and T. Wenzel.
1995. “Real-World Emissions from Model Year 1993, 2000, and 2010 Passenger
Cars.” Report prepared for Energy Foundation and U.S. Department of Energy
through Lawrence Berkeley Laboratory and Oak Ridge National Laboratory. American
Council for an Energy-Efficient Economy, Berkeley, Calif.
Rowe, M.D. 1981. “Human Exposure to Particulate Emissions
from Power Plants.” Brookhaven National Laboratory, Upton, N.Y.
Rubin, E.S. 1999. “Toxic Releases from Power Plants.”
Environmental Science and Technology 33 (18): 3062-67.
Rudd, J., and others. 1993. “Are Hydroelectric Reservoirs
Significant Sources of Greenhouse Gases?” Ambio 22 (4).
Saez, R.M., and others. 1998. “Assessment of the
Externalities of Biomass Energy, and a Comparison of Its Full Costs with
Coal.” Biomass and Bioenergy 14 (5/6): 469-78.
Saksena, S., and V. Dayal. 1997. “Total Exposures As a
Basis for the Economic Valuation of Air Pollution in India.” Energy
Environment Monitor 13 (2): 93-102.
Schwela, D. 1995. “Public Health Implications of Urban Air
Pollution in Developing Countries.” Paper presented at the Tenth World
Clean Air Congress, 28 May-2 June, Erjos, Finland.
Schwela, D., and O. Zali, eds. 1999. Urban Traffic Pollution.
New York: E & FN Spon.
Segen, J. C. 1992. The Dictionary of Modern Medicine.
Park Ridge, N.J.: Parthenon.
Seigneur, C., and others. 1996. “Multipathway Health Risk
Assessment of Power Plant Water Discharges.” Water Air and Soil
Pollution 90 (1-2): 55-64.
Seip, H., D. Zhao, J. Xiong, D. Zhao, T. Larssen, B. Liao, and
R. Vogt. 1995. “Acidic Deposition and Its Effects in Southwestern
China.” Water, Air and Soil Pollution 85: 2301-06.
Shiklomanov, I. 1998. Assessment of Water Resources and Water
Availability in the World. Report for the Comprehensive Assessment of the
Fresh Water Resources of the World, United Nations, New York.
Sims, J. 1994. Women, Health and Environment: An
Anthology. WHO/EHG/94.11. Geneva: World Health Organization.
Smith, D.R., and A.R. Flegal. 1995. “Lead in the Biosphere:
Recent Trends.” Ambio 24 (1): 21-23.
Smith, K.R. 1990. “Risk Transition and Global
Warming.” Journal of Energy Engineering-Asce 116 (3): 178-88.
Smith, K.R. 1991a. “Allocating Responsibility for Global
Warming: The Natural Debt Index.” Ambio 20 (2): 95-96.
Smith, K.R. 1991b. “Managing the Risk Transition.”
Toxicology and Industrial Health 7 (5-6): 319-27.
Smith, K.R. 1993. “Fuel Combustion, Air Pollution Exposure,
and Health: The Situation in Developing Countries.” Annual Review of
Energy and Environment 18: 529-66.
Smith, K.R. 1997. “Development, Health, and the
Environmental Risk Transition.” In G. Shahi, B.S. Levy, A. Binger, and
others, eds., International Perspectives in Environment, Development, and
Health. New York: Springer Publications.
Smith, K.R. 1998. The National Burden of Disease from Indoor
Air Pollution in India. Mumbai: Indira Gandhi Institute of Development
Research.
Smith, K.R. 2000. “National Burden of Disease in India from
Indoor Air Pollution.” Proceedings of the National Academy of Sciences
97.
Smith, K.R., and S. Akbar. 1999. “Health-damaging Air
Pollution: A Matter of Scale.” In G. McGranahan and G. Murray, eds., Health
and Air Pollution in Rapidly Developing Countries. York, U.K.: Stockholm
Environment Institute of York.
Smith, K.R. J.M. Samet, I. Romieu, and N. Bruce. 2000.
“Indoor Air Pollution in Developing Countries and ALRI in Children.”
Thorax 55: 518-32.
Smith, K.R., J. Weyant, and J.P. Holdren. 1975. “Evaluation
of Conventional Power Systems.” University of California at Berkeley,
Energy and Resources Program.
Smith, K.R., C. Corvalan and T.Kjellstrom. 1999. “How Much
Global Ill-health Is Attributable to Environmental Factors?”
Epidemiology 10.
Smith, K.R. and others. 2000a., “Greenhouse Gases from
Small-scale Combustion Devices in Developing Countries, Phase IIa: Household
Stoves in India.” EPA-600/R-00-052 U.S. Environmetal Protection Agency,
Office of Research and Development, Washington, D.C.
Smith, K.R. and others. 2000b. “Greenhouse Implications of
Household Stoves: An Analysis for India.” Annual Review of Energy and
Environment 25: 741-63.
Smithsonian Institution. 1996. “Ocean Planet: Oil
Pollution.” http://seawifs.
gsfc.nasa.gov/OCEAN_PLANET/HTML/peril_oil_pollution.html
Spadaro, J.V., and A. Rabl. 1998. “External Costs of
Energy: Application of the ExternE Methodology in France.” ARMINES (Ecole
des Mines), Paris.
Spadaro, J.V., and others. 1998. “External Costs of Air
Pollution: Case Study and Results for Transport between Paris and Lyon.”
International Journal of Vehicle Design 20 (1-4): 274-82.
Spinrad, B. 1983. “Nuclear Power and Nuclear Weapons: The
Connection Is Tenuous.” Bulletin of the Atomic Scientists 2.
Steinbugler, M.M., and R.H. Williams. 1998. “Beyond
Combustion: Fuel Cell Cars for the 21st Century.” Forum for Applied
Research and Public Policy 13 (4): 102-07.
Stellman, J.M., ed. 1998. Encyclopaedia of Occupational
Health and Safety. 4th ed. Geneva: International Labour Organization.
Streets, D.G., G.R. Carmichael, M. Amann, and R.L. Arndt. 1999.
“Energy Consumption and Acid Deposition in Northeast Asia.” Ambio
28: 135-43.
Sweet, W. 1984. “The Nuclear Age: Power, Proliferation, and
the Arms Race.” Congressional Quarterly, Washington, D.C.
Thornton, E.W. 1994. “Health Risks of Energy Saving.”
Nature 372 (6504): 327.
UN (United Nations). 1995. Framework Convention on Climate
Change. United Nations Conference of the Parties, First Session, Berlin,
Germany.
UNECE (United Nations Economic Commission for Europe). 1996.
“The State of Transboundary Air Pollution.” Air Pollution Studies
12. Geneva.
UNEP (United Nations Environment Programme). 1998. Protecting
Our Planet, Securing Our Future. United Nations Environment Programme, U.S.
National Aeronautics and Space Administration, and World Bank.
UNEP and WHO (United Nations Environment Programme and World
Health Organization). 1992. Urban Air Pollution in Megacities of the World.
Blackwell Publishers.
USAEC (U.S. Atomic Energy Commission). 1974. “Comparative
Risk-Cost-Benefit Study of Alternative Sources of Electrical Energy.”
Office of Energy Systems Analysis, Washington, D.C.
U.S. Census Bureau. 1996. Statistical Abstract of the US:
National Data Book. Washington D.C.: U.S. Department of Commerce.
USDOE (U.S. Department of Energy). 1980. Nuclear
Proliferation and Civilian Nuclear Power: Report of the Non-Proliferation
Alternative Systems Assessment Program. Washington, D.C.: U.S. Government
Printing Office.
USDOE (U.S. Department of Energy). 1995. “Executive
Summary: Encouraging the Purchase and Use of Electric Motor Vehicles.”
Office of Transportation Technologies, Washington, D.C.
USDOE (U.S. Department of Energy). 1997. Final
Nonproliferation and Arms Control Assessment of Weapons-Usable Fissile Material
Storage and Excess Plutonium Disposition Alternatives. Washington, D.C.
US Energy Information Administration. 2000. International
Energy Annual 1998. US Department of Energy: Washington D.C.
USEPA (U.S. Environmental Protection Agency). 1994. “Motor
Vehicles and the 1990 Clean Air Act.” Office of Mobile Sources, Washington,
D.C.
USEPA (U.S. Environmental Protection Agency). 1996. National
Air Pollution Emission Trends: 1900-1995. Washington, D.C.
USEPA (U.S. Environmental Protection Agency). 1997.
“Regulatory Impact Analyses for the Particulate Matter and Ozone National
Ambient Air Quality Standards and Proposed Regional Haze Rule.” Research
Triangle Park, N.C.
USEPA (U.S. Environmental Protection Agency). 1998a. “Study
of Hazardous Air Pollutant Emissions from Electric Utility Steam Generating
Units.” Final report to Congress, vol. 1. Washington, D.C.
USEPA (U.S. Environmental Protection Agency). 1998b.
“Toyota Prius Hybrid System (THS).” Office of Air and Radiation.
https://www.epa.gov/orcdizux/reports/adv-tech/priustst.pdf
USEPA (U.S. Environmental Protection Agency). 1999.
“Environmental Effects of Acid Rain.”
https://www.epa.gov/docs/acidrain/effects/envben.html
van Aardenne, J.A., G.R. Carmichael, H. Levy, D. Streets, and L.
Hordijk. 1999. “Anthropogenic NOx Emissions in Asia in the
Period 1990-2020.” Atmospheric Environment 33: 633-46.
Wang, W., and T. Wang. 1995. “On the Origin and the Trend
of Acid Precipitation in China.” Water, Air and Soil Pollution 85:
2295-2300.
Wang, X., and K.R. Smith. 1998. “Near-term Health Benefits
of Greenhouse Gas Reductions: A Proposed Method for Assessment and Application
to China.” WHO/EHG/98.12. World Health Organization, Geneva.
WCD (World Commission on Dams). 1999. “Work Programme in
Brief.” Cape Town, South Africa. https://www.dams.org
WEC (World Energy Council). 1993. Energy for Tomorrow’s
World. London: Kogan Page.
WEC (World Energy Council). 1995. Global Transport Sector
Energy Demand towards 2020. London.
Weeks, J.L. 1998. “Health Hazards of Mining and
Quarrying.” In J.M. Stellman, ed., Encyclopaedia of Occupational Health
and Safety. 4th ed. Geneva: International Labour Organization.
Wentz, F.J., and M. Schabel. 1998. “Effects of Orbital
Decay on Satellite-derived Lower-tropospheric Temperature Trends.”
Nature 394: 661-64.
WHO (World Health Organization). 1994. “Ultraviolet
Radiation.” Environmental Health Criteria 160. Geneva.
WHO (World Health Organization). 1996. “Health Effects of
the Chernobyl Accident.” WHO/EHG/96.X. Geneva.
WHO (World Health Organization). 1997. “Health and
Environment in Sustainable Development: Five Years after the Earth Summit.”
WHO/EHG/97.8. Geneva.
WHO (World Health Organization). 1998a. “Chrysotile
Asbestos.” Environmental Health Criteria 190. Geneva.
WHO (World Health Organization). 1998b. Healthy Cities Air
Information Management System 2.0. Geneva.
WHO (World Health Organization). 1999. Provisional Global Air
Quality Guidelines. Geneva.
Wigley, T.M. 1999. The Science of Climate Change: Global and
U.S. Perspectives. Arlington, Va.: Pew Center on Global Climate
Change.
Wigley, T.M., R.L. Smith, and B.D. Santer. 1998.
“Anthropogenic Influence on the Autocorrelation Structure of
Hemispheric-mean Temperatures.” Science 282: 1676-79.
Willrich, M., and T. Taylor. 1974. Nuclear Theft: Risks and
Safeguards. Cambridge, Mass.: Ballinger.
WMO (World Meteorological Organization). 1995. Scientific
Assessment of Ozone Depletion: 1994. Geneva.
WMO (World Meteorological Organization). 1999. Scientific
Assessment of Ozone Depletion: 1998. Geneva.
World Bank. 1992. World Development Report 1992: Development
and the Environment. New York: Oxford University Press.
World Bank. 1993. China: Involuntary Resettlement.
Washington, D.C.
World Bank. 1997. Clear Water, Blue Skies: China’s
Environment in the New Century. China 2020 series. Washington, D.C.
WRI (World Resources Institute). 1998. World Resources Report
1998-99: Environmental Change and Human Health. New York: Oxford University
Press.
Yasukawa, S., and others. 1992. “Life Cycle CO2
Emission from Nuclear Power Reactor and Fuel Cycle System.” Paper presented
at an International Energy Agency expert workshop on Life-Cycle Analysis of
Energy Systems: Methods and Experience, Paris.
Zhao, D., and J. Xiong. 1988. “Acidification in
Southwestern China.” In H. Rodhe and R. Herrera, eds., Acidification in
Tropical Countries. Chichester, U.K.: John Wiley and Sons
Ltd.
Chapter 4. Energy Security
Hisham Khatib (Jordan)
LEAD AUTHORS: Alexander Barnes (France), Isam Chalabi (Iraq),
H. Steeg (Germany), K. Yokobori (Japan, on behalf of Asia-Pacific Economic
Cooperation), and the Planning Department, Organisation of Arab Oil Producing
Countries (Kuwait)
The ideas expressed in the chapter are entirely the
responsibility of the Convening Lead Author.
|
ABSTRACT
Energy security - the continuous availability of energy in
varied forms, in sufficient quantities, and at reasonable prices - has many
aspects. It means limited vulnerability to transient or longer disruptions of
imported supplies. It also means the availability of local and imported
resources to meet, over time and at reasonable prices, the growing demand for
energy. Environmental challenges, liberalisation and deregulation, and the
growing dominance of market forces all have profound implications for energy
security. These forces have introduced new elements into energy security,
affecting the traditionally vital role of government.
In the past, and especially since the early 1970s, energy
security has been narrowly viewed as reduced dependence on oil consumption and
imports, particularly in OECD and other major oil-importing countries. But
changes in oil and other energy markets have altered that view. Suppliers have
increased, as have proven reserves and stocks, and prices have become flexible
and transparent, dictated by market forces rather than by cartel arrangements.
Global tensions as well as regional conflicts are lessening, and trade is
flourishing and becoming freer. Suppliers have not imposed any oil sanctions
since the early 1980s, nor have there been any real shortages anywhere in the
world. Instead, the United Nations and other actors have applied sanctions to
some oil suppliers, but without affecting world oil trade or creating shortages.
All this points to the present availability of abundant oil supplies at all
times, an availability that has been greatly enhanced thanks in large part to
technological advances. Moreover, in today’s market environment energy
security is a shared issue for importing and exporting countries.
Energy security can be ensured through local adequacy -
abundant and varied forms of indigenous energy resources. But for countries that
face local shortages, as most do, energy security can be enhanced through:
· The ability, of
the state or of market players, to draw on foreign energy resources and products
that can be freely imported through ports or other transport channels and
through cross-boundary energy grids (pipelines and electricity networks). This
is increasingly aided by energy treaties and charters and by investment and
trade agreements.
· Adequate national (or
regional) strategic reserves to address any transient interruption, shortages,
or unpredictably high demand.
· Technological and financial
resources and know-how to develop indigenous renewable energy sources and
domestic power generating facilities to meet part of local energy
requirements.
· Adequate attention to
environmental challenges.
· Diversification of import
sources and types of fuels.
Energy security can also be greatly enhanced by energy
conservation and efficiency measures, because reducing energy intensity will
reduce the dependence of the economy on energy consumption and imports.
But while all this is very encouraging, new threats to energy
security have appeared in recent years. Regional shortages are becoming more
acute, and the possibility of insecurity of supplies - due to disruption of
trade and reduction in strategic reserves, as a result of conflicts or sabotage
- still exists, although it is decreasing. All this points to a need to
strengthen global as well as regional and national energy security. This chapter
discusses some means and instruments for doing so. |
The world has generally seen considerable development and
progress in the past 50 years. Living standards have improved, people have
become healthier and longer-lived, and science and technology have considerably
enhanced human welfare. No doubt the availability of abundant and cheap sources
of energy, mainly in the form of crude oil from the Middle East, contributed to
these achievements. Adequate global energy supplies, for the world as a whole as
well as for individual countries, are essential for sustainable development,
proper functioning of the economy, and human well-being. Thus the continuous
availability of energy - in the quantities and forms required by the economy and
society - must be ensured and secured.
Energy security - the continuous availability of energy in
varied forms, in sufficient quantities, and at reasonable prices - has several
aspects. It means limited vulnerability to transient or longer disruptions of
imported supplies. It also means the availability of local and imported
resources to meet growing demand over time and at reasonable prices.
Beginning in the early 1970s energy security was narrowly viewed
as reduced dependence on oil consumption and imports, particularly in OECD and
other major oil-importing countries. Since that time considerable changes in oil
and other energy markets have altered the picture. Suppliers have increased, as
have proven reserves and stocks, and prices have become flexible and
transparent, dictated by market forces rather than by cartel arrangements.
Global tensions and regional conflicts are lessening, and trade is flourishing
and becoming freer. Suppliers have not imposed any oil sanctions since the early
1980s, nor have there been any real shortages anywhere in the world. Instead,
the United Nations and other actors have applied sanctions to some oil
suppliers, but without affecting world oil trade or creating shortages.
All this points to the present abundance of oil supplies.
Moreover, in today’s market environment energy security is a shared issue
for importing and exporting countries. As much as importing countries are
anxious to ensure security by having sustainable sources, exporting countries
are anxious to export to ensure sustainable income (Mitchell, 1997).
However, although all these developments are very encouraging,
they are no cause for complacency. New threats to energy security have emerged
in recent years. Regional shortages are becoming more acute, and the possibility
of insecurity of supplies - due to disruption of trade and reduction in
strategic reserves, as a result of conflicts or sabotage - persists, although it
is decreasing. These situations point to a need to strengthen global as well as
regional and national energy security (some means for doing this are discussed
later in the chapter). There is also a need for a strong plea, under the
auspices of the World Trade Organization (WTO), to refrain from restrictions on
trade in energy products on grounds of competition or differences in
environmental or labour standards.
Environmental challenges to sustainable development are gaining
momentum and have profound implications for energy security, as do the current
trends of liberalisation, deregulation, and the growing dominance of market
forces. These forces have introduced new elements into energy security,
affecting the traditionally vital role of government, as described below. They
also have consequences for medium-size companies and individual consumers, who
may be tempted by cheap competitive prices and lack of information to sacrifice,
sometimes temporarily, supply security.
|
Energy insecurity
and shortages handicap
productive
activities and
undermine consumer
welfare. |
Energy has always been important to humanity. But its importance
is increasing each year. Interruptions of energy supply - even if brief - can
cause serious financial, economic, and social losses. Some energy products and
carriers have become absolutely essential for modern life and business.
Interruption of electricity supply can cause major financial losses and create
havoc in cities and urban centres. The absolute security of the energy supply,
particularly electricity, is therefore critical. With the widespread use of
computers and other voltage- and frequency-sensitive electronic equipment, the
quality of supply has also become vital. In the electricity supply industry, a
significant share of investment goes into reserve generating plants, standby
equipment, and other redundant facilities needed to protect the continuity and
quality of supply.
Energy insecurity and shortages affect countries in two ways:
they handicap productive activities, and they undermine consumer welfare. Energy
insecurity discourages investors by threatening production and increasing costs.
Shortages in electricity supplies (as in many developing countries) require more
investment for on-site electricity production or standby supplies. For small
investors, the cost of operation is increased, since electricity from private
small-scale generation is more expensive than public national supplies.
Electricity interruptions at home cause consumers great inconvenience,
frustration, and loss of productivity, sometimes threatening their well-being.
For any economy, an unreliable energy supply results in both
short- and long-term costs. The costs are measured in terms of loss of welfare
and production, and the adjustments that consumers (such as firms) facing
unreliable fuel and electric power supplies undertake to mitigate their losses.
Interruptions in supply may trigger loss of production, costs related to product
spoilage, and damage to equipment. The extent of these direct economic costs
depends on a host of factors, such as advance notification, duration of the
interruption, and timing of the interruption, which relates to the time of day
or season and to the prevailing market conditions and demand for the firm’s
output. These direct costs can be very high. In addition, the economy is
affected indirectly because of the secondary costs that arise from the
interdependence between one firm’s output and another firm’s
input.
New dimensions and challenges to energy security
Energy security needs to be investigated at several levels:
globally, to ensure adequacy of resources; regionally, to ensure that networking
and trade can take place; at the country level, to ensure national security of
supply; and at the consumer level, to ensure that consumer demand can be
satisfied. At the country level, energy security is based on the availability of
all energy consumption requirements at all times from indigenous sources or
imports and from stocks. Normally in most countries, this is a state
responsibility. However, markets in some OECD countries are increasingly
shouldering part of this responsibility. To ensure energy security, projections,
plans, and supply arrangements should look beyond short-term requirements to
medium- and long-term demand as well.
With the increasing deregulation and competition among private
and independent suppliers, supply security at the consumer level can become more
vulnerable and correspondingly more important in some cases. Consumer demand for
energy services can be met by different suppliers competing to deliver different
forms of energy at different prices, while the consumer remains unaware of the
degree of supply security.
As explained above, environmental challenges, deregulation, and
market forces have introduced new players to the energy security scene. This
chapter considers energy security at the national (and regional) level as well
as consumer security in terms of energy services. In most countries these two
levels of security are one and the same. But in some OECD countries, with
markets and competition emerging at the consumer level, the two may diverge. The
chapter also covers the geopolitical aspects of energy security as well as the
limitations of the resource base and other factors that may affect long-term
energy security.
Of all energy sources, crude oil and its products are the most
versatile, capable of meeting every requirement for energy use and services,
particularly in transport. The other fossil fuels, coal and natural gas, are
well suited for electricity production and such stationary uses as generation of
heat and steam. Coal, increasingly used for electricity production, requires
relatively expensive clean technologies, and treatment for liquefaction and
gasification to make it more versatile. Natural gas also requires expensive
infrastructure, and special treatment to make it useful for transport.
Hydropower, newer renewable resources such as wind and photovoltaics, and
nuclear energy have limited use beyond electricity production.
Given the versatility of crude oil and its products and the
limitations of other energy sources, energy security depends more than anything
else on the availability of crude oil in the required amounts (by ship or
pipeline) to any importing country in the world. Thus, although energy security
has to be interpreted more broadly than in the past, the uninterrupted supply of
crude oil in the required amounts and at reasonable prices will continue to be
the most important determinant of energy security. Uninterrupted supply - of oil
and other forms of energy - includes uninterrupted transit through third
countries. As the chapter details later, work is under way, through the Energy
Charter Treaty, to improve security for exporters and importers and to promote a
favourable climate for investments in upgrading and building new and diversified
pipeline routes.
|
Reducing energy intensity
will reduce the dependence
of
the economy on
energy consumption
and imports. |
Security of electric power supply
Chronic energy shortages and poor security of the electric power
supply trigger long-term adjustments. If firms expect shortages and unreliable
service to persist, they will respond in one or more ways. The most common
long-term adjustment by commercial consumers and small industrial firms is to
install back-up diesel generator sets. It has been estimated that in many
developing countries such standby generation on customer premises accounts for
20 percent or more of the total installed generating capacity (USAID, 1988).
The shortages and inadequate maintenance of the grid also add to
poor security. In some developing countries half the public electricity supply
is inoperable at any given time. Many manufacturing firms have had to purchase
their own generators to meet their demand for electricity. In Nigeria about 92
percent of firms surveyed in the mid-1990s had their own generators. This
purchase added to their fixed costs, raised production costs, and tended to
discourage new investments. For small firms, the investment in generating
capacity represented almost a quarter of their total investment, and for large
firms, a tenth (ADB, 1999). Moreover, in many developing countries the electric
power system losses (technical and non-technical) are very high, exceeding a
quarter of generation in some and as much as half in a few.
Shortages of electric power and supply interruptions are not
uncommon, particularly in many developing countries. They occur for two main
reasons:
· System
inadequacy - shortfalls of delivered electricity under even the best
conditions in the electric power system. Such shortfalls, most common in
developing countries, usually occur because of an inadequate number of
generating facilities capable of meeting peak demand and limitations in the
transmission and distribution system, particularly to rural areas.
· Supply insecurity -
unreliability of supply due to non-availability of generating plants or
breakdowns in the transmission and distribution system. This can occur in
varying degrees in any power system in the world.
To ensure system adequacy - the ability of a power system to
meet demand and deliver adequate electricity to consumers - requires investment.
Most investments in electric power security are meant to reduce the likelihood
of shortages and maintain and improve reliability. Most shortages occur as a
result of growth in demand, which necessitates expanding generation capacity and
strengthening networks. But even with large investments, interruptions are
inevitable. And the costs of improving continuity of supply can become very high
once a certain level of reliability has been reached.
The function of the electric power system is to provide
electricity as economically as possible and with an acceptable degree of
security and quality. The economics of electric power security (reliability)
involve striking a reasonable balance between cost and quality of service. This
balance varies from country to country, and from one category of consumers to
another.
To improve supply security, countries invest in redundant
facilities. These investments, in reserve generating capacity and other network
facilities, normally amount to at least a third of the investments by the
electricity supply industry. Low-income developing countries cannot afford such
huge investments, leading to supply insecurity. Thus in many developing
countries, electricity supplies are enhanced by standby plants on consumer
premises. Many industries and commercial outlets have to spend heavily on
in-house generation or standby plants to attain a reasonable standard of
continuity. This greatly increases the cost of attaining supply security and
places an added burden on the limited economic resources of these countries.
Supply interruptions occur not only because of shortages in
generating plants or limitations in the grid. They are also attributed to
inadequate maintenance due to lack of skilled staff or shortage of spare parts.
Attaining a reasonable standard of performance in developing countries’
public systems is essential not only to improve electricity supply security but
also to limit the wasted resources in standby plants and reserve generating
capacity. This can be achieved through proper planning of the system and by
investing in training and maintenance rather than only in system expansion.
The cost of insecurity of the electricity system in developing
countries varies by country depending on the extent of electrification and
quality of the supply. However, in industrialised countries the costs of supply
insecurity for non-deferrable economic activities are huge. In the United States
it was estimated that these costs might exceed $5 billion a year (Newton-Evans
Research Company, 1998). Most of these costs are borne by industrial and
commercial consumers (box
4.1).
Routes to enhanced energy security
Energy security can be ensured by local adequacy - abundant and
varied forms of indigenous energy resources. In the case of local shortages,
which occur in most countries, energy security can be enhanced through:
· The ability, of
the state or of market players, to draw on foreign energy resources and products
that can be freely imported through ports or other transport channels and
through cross-boundary energy grids (pipelines and electricity networks).
· Adequate national (or
regional) strategic reserves to address any transient interruption, shortages,
or unpredictable surge in demand.
· Technological and financial
resources and know-how to develop indigenous renewable sources and power
generating facilities to meet part of local energy requirements.
· Adequate attention to
environmental challenges.
Energy security can also be enhanced through energy conservation
and efficiency measures. Reducing energy intensity will reduce the dependence of
the economy on energy consumption and imports.
To achieve energy security requires first of all ensuring global
energy adequacy - the existence of enough energy resources, or other prospects,
to meet long-term world energy
needs.
Energy adequacy
Although energy resources are examined in detail elsewhere in
this report (see chapter 5), a quick review is provided here because energy
security depends, to a great extent, on the availability of an adequate resource
base. The resource base is the sum of reserves and resources. Reserves are
occurrences (of all types and forms of hydrocarbon deposits, natural uranium,
and thorium) that are known and economically recoverable with present
technologies. Resources are less certain, are not economically recoverable with
present technologies, or are both. In the future, with advances in technology
and geophysics, many of today’s resources are likely to become reserves
(McKelvey, 1972).
Most of the world’s future energy requirements, at least
until the middle of the 21st century, will have to be met by fossil fuels
(figure 4.1). Many attempts have been made to assess the global fossil fuel
resource base. Table 4.1 shows the results of two.
|
BOX 4.1 VALUING THE COST OF ELECTRICITY SUPPLY SECURITY
The cost of electricity to a consumer - the consumer’s
valuation of the electricity supply (ignoring consumer surplus) - equals
payments for electricity consumed plus the economic (social) cost of
interruptions.
Supply insecurity causes disutility and inconvenience, in
varying degrees and in different ways, to different classes of consumers -
domestic, commercial, and industrial. The costs and losses (L) for the average
consumer from supply interruptions are a function of the following:
· Dependence of the
consumer on the supply (C).
·
Duration of the interruptions (D).
· Frequency of their occurrence during the year
(F).
· Time of day in which
they occur (T).
That is, L = C (Dd × Ff,
Tt), where d, f, and t are constants that
vary from one consumer category to another.
The table shows estimates of the annual cost of electricity
supply interruptions for the U.S. economy. |
|
Economic cost of electricity supply interruptions for
non-deferrable economic activities the United States, 1997 |
|
Consumer class and average duration of interruption
|
Cost to consumer per outage (U.S. dollars) |
Cost to consumer per lengthy outage (U.S. dollars)
|
Estimated total annual losses (billions of U.S.
dollars) |
|
Residential
(20 minutes) |
0 - 20 |
50 - 250 |
0.9 - 2.7 |
|
Commercial
(10 minutes) |
25 - 500 |
5 - 20
(per minute) |
2.9 - 11.7 |
|
Industrial
(less than 30 seconds) |
200 - 500
(small plant)
1,000 - 10,000
(large plant)
|
5,000 - 50,000
(per 8-hour day) |
1.1 - 13.5 |
Note: Assumes nine outages a year for each class of
consumer.
Source: Newton-Evans Research Company, 1998.
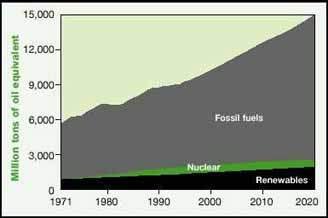
FIGURE 4.1. SHARE OF FUELS IN
GLOBAL ENERGY SUPPLY, 1971 - 2020
Source: IEA, 1998.
In 1998 world consumption of primary energy totalled almost 355
exajoules, or 8,460 million tonnes of oil equivalent (Mtoe) - 7,630 Mtoe of
fossil fuels, 620 Mtoe of nuclear energy, and 210 Mtoe of hydropower. To this
should be added around 47 exajoules (1,120 Mtoe) of biomass and other
renewables, for a total of 402 exajoules (9,580 Mtoe). The huge resource base of
fossil and nuclear fuels will be adequate to meet such global requirements for
decades to
come.
Crude oil
Proven oil reserves have increased steadily over the past 20
years, mainly because oil companies have expanded their estimates of the
reserves in already discovered fields. This optimism stems from better knowledge
of the fields, increased productivity, and advances in technology. New
technologies have led to more accurate estimates of reserves through better
seismic (three- and four-dimensional) exploration, have improved drilling
techniques (such as horizontal and offshore drilling), and have increased
recovery factors - the share of oil that can be recovered - from 30 percent to
40 - 50 percent (Campbell and Laherrere, 1998).
Huge amounts of untapped unconventional oil also exist,
augmenting conventional oil reserves. Some 1.2 trillion barrels of heavy oil are
found in the Orinoco oil belt in Venezuela. And the tar sands of Canada and oil
shale deposits of the Russian Federation may contain 300 billion barrels of oil.
The U.S. Geological Survey assessed ultimate oil and gas reserves at the
beginning of 1993 (IEA 1998; WEC, 1998). The results, which tally with the World
Energy Council (WEC) and International Energy Agency (IEA) figures (see table
4.1), point to ultimate conventional oil reserves of 2,300 billion barrels, with
cumulative production until 1993 amounting to 700 billion barrels and
unidentified reserves to 470 billion. No shortage of conventional liquid fuels
is foreseen before 2020. Any deficiencies after that can be met by the ample
reserves of unconventional
oil.
Natural gas
The U.S. Geological Survey also assessed ultimate natural gas
reserves in 1993 (Masters, 1994). It estimated ultimate reserves at 11,448
trillion cubic feet (11,214 exajoules, or 267 gigatonnes of oil equivalent
[Gtoe]), with cumulative production until 1993 amounting to 1,750 trillion cubic
feet (1,722 exajoules, or 41 Gtoe). Cumulative world gas production through the
end of 1995 was only 17.1 percent of the U.S. Geological Survey’s estimate
of conventional gas reserves.
Natural gas consumption is projected to grow 2.6 percent a year,
mostly as a result of growth in electricity generation in non-OECD countries.
Despite this growth, cumulative production is expected to be no more than 41
percent of the U.S. Geological Survey’s estimate of conventional gas
reserves by 2020. This points to a resource base large enough to serve global
requirements for natural gas well into the second half of the 21st century.
TABLE 4.1. GLOBAL ENERGY RESOURCE BASE (EXAJOULES EXCEPT
WHERE OTHERWISE INDICATED)
|
Term |
World Energy Council estimates |
Institute for Applied Systems Analysis estimates |
Consumption |
|
Proven reserves |
Ultimately recoverable |
Reserves |
Resources |
Resource base |
1998 |
|
Conventional oil |
6,300 (150) |
8,400 (200) |
6,300 (150) |
6,090 (145) |
12,390 (295) |
142.8 (3.4) |
|
Unconventional oil |
- |
23,100 (550) |
8,190 (195) |
13,944 (332) |
22,050 (525) |
n.a. |
|
Conventional gas |
5,586 (133) |
9,240 (220) |
5,922 (141) |
11,718 (279) |
17,640 (420) |
85 (2.0) |
|
Unconventional gas |
- |
- |
8,064 (192) |
10,836 (258) |
18,900 (450) |
n.a. |
|
Coal and lignite |
18,060 (430) |
142,800 (3,400) |
25,452 (606) |
117,348 (2,794) |
142,800 (3,400) |
93 (2.2) |
|
Uranium |
3.4 × 10⁹ tonnes |
17 × 109 tonnes |
(57) |
(203) |
(260) |
64,000 tonnes |
- Not available; n.a. Not applicable.
Note: Numbers in parentheses are in gigatonnes of oil
equivalent. For definitions of conventional and unconventional resources, see
chapter 5. a. Because of uncertainties about the method of conversion,
quantities of uranium have been left in the units reported by the sources.
Source: WEC, 1998; IIASA,
1998.
Coal
Coal is the world’s most abundant fossil fuel, with
reserves estimated at almost 1,000 billion tonnes, equivalent to 27,300
exajoules, or 650,000 Mtoe (WEC, 1998). At the present rate of production, these
reserves should last for more than 220 years. Thus the resource base of coal is
much larger than that of oil and gas. In addition, coal reserves are more evenly
distributed across the world. And coal is cheap. Efforts are being made to
reduce production costs and to apply clean coal technologies to reduce the
environmental impact.
Coal demand is forecast to grow at a rate slightly higher than
global energy growth. Most of this growth will be for power generation in
non-OECD countries, mostly in Asia. Although trade in coal is still low, it is
likely to increase slowly over time. Long-term trends in direct coal utilisation
are difficult to predict because of the potential impact of climate change
policies. Coal gasification and liquefaction will augment global oil and gas
resources in the
future.
Nuclear energy
Although nuclear energy is sometimes grouped with fossil fuels,
it relies on a different resource base. In 1998 nuclear energy production
amounted to 2,350 terawatt-hours of electricity, replacing 620 Mtoe of other
fuels. Uranium requirements amounted to 63,700 tonnes in 1997, against
reasonably assured resources (reserves) of 3.4 million tonnes. Ultimately
recoverable reserves amount to almost 17 million tonnes. Considering the
relative stagnation in the growth of nuclear power, the enormous occurrences of
low-grade uranium, and the prospects for recycling nuclear fuels, such reserves
will suffice for many
decades.
Renewables
Renewable energy sources - especially hydroelectric power,
biomass, wind power, and geothermal energy - account for a growing share of
world energy consumption. Today hydropower and biomass together contribute
around 15 percent.
Hydroelectric power contributes around 2,500 terawatt-hours of
electricity a year, slightly more than nuclear power does. It replaces almost
675 Mtoe of fuels a year, although its direct contribution to primary energy
consumption is only a third of this. But it has still more potential.
Technically exploitable hydro resources could potentially produce more than
14,000 terawatt-hours of electricity a year, equivalent to the world’s
total electricity requirements in 1998 (WEC, 1998). For environmental and
economic reasons, however, most of these resources will not be exploited.
Still, hydropower will continue to develop. Hydropower is the
most important among renewable energy sources. It is a clean, cheap source of
energy, requiring only minimal running costs and with a conversion efficiency of
almost 100 percent. Thus its annual growth could exceed the growth of global
energy demand, slightly improving hydropower’s modest contribution towards
meeting world requirements.
|
Techniques for gasification,
fermentation, and anaerobic
digestion
are all increasing the potential
of biomass as a
sustainable
energy source. |
Renewable energy sources other than hydro are substantial. These
take the form mainly of biomass. Traditional biomass includes fuelwood - the
main source of biomass energy - dung, and crop and forest residues. Lack of
statistics makes it difficult to accurately estimate the contribution of
renewables to the world’s primary energy consumption. But it is estimated
that the world consumed around 1.20 Gtoe in 1998. About two-thirds of this was
from fuelwood, and the remainder from crop residues and dung. Much of this
contribution is sustainable from a supply standpoint. But the resulting energy
services could be substantially increased by improving conversion efficiencies,
which are typically very low.
The contribution of biomass to world energy consumption is
expected to increase slightly. It is mainly used as an energy source in
developing countries. While energy demand in these countries is steadily
increasing, some of the demand is being met by switching from traditional to
commercial energy sources.
Biomass energy technology is rapidly advancing. Besides direct
combustion, techniques for gasification, fermentation, and anaerobic digestion
are all increasing the potential of biomass as a sustainable energy source. The
viability of wind energy is increasing as well. Some 2,100 megawatts of new
capacity was commissioned in 1998, pushing global wind generating capacity to
9,600 megawatts. Wind power accounted for an estimated 21 terawatt-hours of
electricity production in 1999. While that still amounts to only 0.15 percent of
global electricity production, the competitiveness of wind power is improving
and its growth potential is substantial. Use of geothermal energy for
electricity generation is also increasing, with a present generating capacity of
more than 8,300
megawatts.
The resource outlook
To summarise, no serious global shortage of energy resources is
likely during at least the first half of the 21st century. Reserves of
traditional commercial fuels - oil, gas, and coal - will suffice for decades to
come. When conventional oil resources are depleted, the huge unconventional oil
and gas reserves will be tapped as new extraction and clean generating
technologies mature. Coal reserves are also huge: the resource base is more than
twice that of conventional and unconventional oil and gas. Clean technologies
for coal will allow greater exploitation of this huge resource base, mainly in
electricity production, but also through conversion into oil and gas, minimising
environmentally harmful emissions.
The uranium resource base is also immense, and it is unlikely,
at least in the short term, to be tapped in increasing amounts. The ultimately
recoverable uranium reserves will easily meet any nuclear power requirements
during this century.
The renewable resource base is also promising. Only part of the
global hydro potential has been tapped. Hydropower plants will continue to be
built as demand for electricity grows and the economics of long-distance,
extra-high-voltage transmission improve. Biomass has substantial potential and
will continue to be used not only as a traditional fuel but also in increasingly
sophisticated ways, through thermochemical and biochemical applications. New
renewable sources, particularly wind power, will gradually increase the
contribution of renewables to global energy supplies as the economies and
technologies of these environmentally attractive sources continue to improve.

FIGURE 4.2. SHIFTING CONCENTRATION
OF WORLD ENERGY DEMAND, 1995 - 2020
Source: IEA, 1998.
In short, the world’s energy supplies offer good prospects
for energy security in the 21st century. The fossil fuel reserves amount to
1,300 Gtoe and the fossil fuel resource base to around 5,000 Gtoe (see table
4.1), amounts sufficient to cover global requirements throughout this century,
even with a high-growth scenario. That does not mean there will be no temporary
or structural energy shortages, but as long as the energy resources are being
explored and exploited, these shortages will not be due to resource
inadequacy.
Supply security
Energy resources are not evenly distributed across the world.
Oil in particular, and natural gas to a lesser extent, are concentrated in a few
regions. The concentration of oil reserves in the Persian Gulf region has always
caused concerns about continuity of supply. Most countries, particularly OECD
countries, experienced oil shortages and high prices in the 1970s and early
1980s, with physical disruption in supply leading to economic disruption. Energy
importers are anxious not to repeat such experiences.
The oil supply situation has improved significantly since then.
OECD countries’ share of the energy market is decreasing, while that of
developing countries is increasing (figure 4.2). This adds to the security of
oil supplies because many developing countries are oil producers or have supply
arrangements with producers. OECD countries, which accounted for 70 percent of
the energy market in the 1970s, will see their market share fall to less than
half by 2010. Technological advance has allowed the discovery and development of
new energy reserves and reduced the cost of supplies. It has also helped
increase efficiency in energy use, loosening the historically tight link between
economic development and energy consumption.
Another major favourable development is the reduction in the
sources of conflict that can affect global energy security. The cold war is
over, and stability in the Middle East, although still precarious, is improving,
with the Arab-Israeli conflict moving towards resolution.
However, some other global developments present both
opportunities and new challenges to the energy sector. The policy emphasis on
environmentally sustainable development, particularly in OECD countries, has
important long-term implications for energy security. And the market
liberalisation taking place in most industrialised countries has reduced the
state’s role in energy security - and increased that of consumers.
Energy security is also important for energy producers and
exporters. History shows that oil supply disruptions have negative effects on
oil-exporting economies. As consumers in importing economies shift away from
oil, the lower demand causes severe economic damage to the exporters. In
addition, many oil-exporting countries have recently obtained stakes in
downstream operations in importing countries. This involvement in OECD economies
will contribute towards energy security, as supply disruptions could mean a loss
of business opportunities for both oil exporters and importers.
Causes of supply disruption are not limited to disturbances in
production facilities. Disruptions can also occur in the long supply chains,
such as serious tanker accidents in the most heavily travelled zones - the
Strait of Malacca, for example. Vulnerability to disruption may grow as energy
supplies are increasingly delivered through grids (gas pipelines and
extra-high-voltage transmission networks). Some of these cross national
boundaries and are at least theoretically vulnerable to damage through sabotage
and other political disturbances. Terrorist actions could damage liquefied
natural gas (LNG) conversion and receiving stations and tankers. But such
possibilities are remote. Most energy supplies are delivered under long-term
contracts that commit governments to ensuring safe transit and security.
Despite the favourable developments in the energy market, energy
security continues to concern planners and strategists in most importing
countries. Long-term energy security can be enhanced in several ways:
· Increasing energy
independence by fostering and developing local resources (although some may not
be economical). Supply security should not be measured solely by energy
independence, however. An intelligent supply policy that includes external
energy sources can offset many of the drawbacks of dependence and be more
economical than a policy that precludes energy imports.
· Diversifying sources of supply
and forms of energy used (box 4.2).
· Encouraging international
cooperation and agreements among energy-importing countries and between consumer
and supplier countries, whether between governments or between companies.
· Investing in and transferring
technology to developing countries. Enabling developing countries to develop
more energy supplies will enhance the availability of global supplies. Helping
these countries increase the efficiency of energy use and improve environmental
management will have a similar effect.
· Enhancing and increasing
national and regional strategic reserves of crude oil and its
products.
|
No serious global
shortage of energy resources
is likely
during at least
the first half of the
21st century. |
Of all the forms of energy, crude oil and its products are still
the most important for energy security, because of oil’s versatility and
because it is the optimal form of energy for the transport sector. Natural gas,
because of its affordability and cleanliness, is gaining in importance. Nuclear
energy, despite its past promise, faces many difficulties. The security of all
these energy forms, as well as coal, is discussed below. Energy intensity is
also discussed, because improvements in this area could yield a wider range of
benefits for energy security than could providing new sources of
energy.
Security of crude oil supply
Over the past 20 years many changes in the oil market have
improved the overall security of the energy market. The world economy has become
less dependent on oil, as most regions have diversified their energy sources.
Oil constituted almost 46 percent of world commercial energy sources in 1973,
compared with 40 percent now. There has also been diversification of supply. In
the early 1970s the Organization of Petroleum Exporting Countries (OPEC)
accounted for more than half the world’s oil; today it provides only 42
percent. The world now has 80 oil-producing countries (although very few have
the surge capacity needed in emergencies). The oil markets have become more like
traditional commodity markets (with futures markets), transparent and able to
respond quickly to changing circumstances.
|
BOX 4.2. FRANCE’S EFFORTS TO ENHANCE ENERGY
SECURITY
France has few energy resources and yet is highly industrialised
and thus heavily dependent on adequate and reliable energy supplies. Its total
energy consumption is estimated at 240 million tonnes of oil equivalent (Mtoe) a
year, while domestic primary energy production of oil, gas, and coal amounts to
only 8 Mtoe and is declining.
France, which produced half its total energy requirements in the
early 1960s, saw its energy self-sufficiency decline sharply by the 1970s, when
it produced only 22 percent of its requirements. But through intensive effort
and ambitious energy planning, France reversed this trend of increasing
dependence on imported energy. Thanks to its advanced technological skills,
France was able to undertake an ambitious nuclear energy programme that helped
it regain its 50 percent energy self-sufficiency in the late 1980s and to
maintain it since.
To enhance its energy security, France pursued the following
actions, which take into account its high standard of living, extensive
industrialisation, and limited indigenous sources of primary energy:
· Diversification of
energy sources and structure of energy use. France significantly reduced its
dependence on imported oil from the Middle East, increased its dependence on
gas, mainly from European and Algerian sources, and considerably increased its
dependence on domestic electricity produced by nuclear power stations (see the
table below).
· Participation in regional
cooperation and joint actions, including the International Energy Agency and the
Energy Charter Treaty.
· Reduction and rationalisation
of demand by improving energy efficiency and encouraging conservation through
pricing and taxation, particularly of petroleum products.
· Regional interconnection of
gas and electricity networks, helping to mitigate temporary problems in the
supply chain.
· Substitution of natural gas
and nuclear electricity for petroleum products wherever possible.
By focusing on nuclear energy, France no doubt enhanced its
energy security. But it also introduced a new vulnerability into its system.
Nuclear power is a viable link in the energy chain as long as it is safe and
publicly accepted. With the accidents at U.S., Russian, and Japanese nuclear
plants and the growing strength of anti-nuclear parties in Europe, there is no
guarantee that it will remain publicly accepted over the long term. |
|
Energy supply structure in France, 1973 and 1997
(percent) |
|
Cost |
1973 |
1997 |
|
Primary energy |
|
|
|
Coal |
14.5 |
5.6 |
|
Oil |
66.3 |
39.7 |
|
Gas |
7.0 |
13.1 |
|
Primary electricitya |
7.0 |
36.6 |
|
Renewablesb |
5.2 |
5.0 |
|
Final energy |
|
|
|
Coal |
11.0 |
4.0 |
|
Oil |
56.4 |
37.1 |
|
Gas |
5.5 |
13.9 |
|
Electricity |
20.9 |
39.1 |
|
Renewablesb |
6.2 |
5.9 |
a. Most primary electricity is from nuclear fuels.
b. Excluding hydroelectricity but including non-commercial uses.
Source: Maillard, 1999.
Big strides have been made in energy efficiency, gradually
reducing the dependence of economic growth on increased oil consumption.
Advances in technology have led to discoveries of more oil, reduced the cost of
discoveries, and significantly improved the recovery rate, increasing the oil
resource base to an estimated 2,300 trillion barrels. World trade has flourished
in recent years. In 1998 it was three times that in 1980, and now accounts for
44 percent of global GDP, compared with 39 percent in 1980. Both energy
exporters and importers benefit from trade. Most exporters are low-income
countries that badly need oil income for development.
Even with the increase in oil-producing countries, the fact
remains that almost two-thirds of the world’s oil resources are in the
Middle East, mostly in the Gulf region (the Islamic Republic of Iran, Iraq,
Kuwait, Qatar, Saudi Arabia, and the United Arab Emirates). Although these six
countries now account for only 27 percent of global crude oil supplies, they are
expected to double their share to 52 percent in 2010. The Middle East,
particularly the Gulf region, has not been historically known for political
stability and security. But as mentioned, the situation is improving.
OECD countries, which account for almost 80 percent of the
world’s economic activity and 63 percent of global oil consumption, are
particularly dependent on oil imports. All OECD countries are expected to
increase their dependence on oil imports over the next few years. Their oil
imports, 56 percent of their energy requirements in 1996, are expected to rise
to 76 percent in 2020 (table 4.2).
Asia-Pacific countries’ crude oil imports are expected to
increase to 72 percent of their requirements in 2005 (up from 56 percent in
1993). The Middle East is expected to account for 92 percent of the
region’s imports, with the Gulf countries the main source of supply. The
Gulf region is expected to supply 18 million barrels a day to Asia-Pacific
countries in 2010 (figure 4.3), far more than its expected total supplies to
Europe and the United States of 12 million barrels a day. That is why oil
security, particularly for the major oil-importing countries, and the stability
of the Gulf region have such importance to overall energy security and the world
economy. This importance will only increase in the future.
TABLE 4.2. OIL IMPORTS AS A SHARE OF TOTAL ENERGY
REQUIREMENTS IN OECD COUNTRIES (PERCENT)
|
OECD country group |
1996 |
2010 |
2020 |
|
North America |
45 |
63 |
63 |
|
Europe |
53 |
74 |
85 |
|
Pacific |
90 |
96 |
96 |
|
Total OECD |
56 |
72 |
76 |
Source: IEA, 1998.
|
Despite the favourable developments
in the energy market,
energy security
continues to concern planners
and strategists in
most
importing countries. |
Differences between regional requirements and regional supplies
will be accentuated in the future. Nowhere will this be more serious than in
Asia, particularly among the large oil-consuming countries - China, India,
Japan, and the Republic of Korea. Competition for supplies may intensify during
emergencies, creating a potential for severe strains among Asian powers.
Shortages may tempt some of these countries to project political and even
military power to ensure adequate oil supplies. Already some of them - as well
as the United States - have increased their naval presence in the Asian and
Indian oceans (Jaffe, 1998). And U.S efforts for cooperation and conflict
resolution are linked to its military planning and presence in the Gulf region
and key oil export sea routes (Kemp and Harkavy, 1997).
Threats to security in oil-exporting countries can be both
internal and external. Continued supply from Saudi Arabia is the most important
element of energy security. Saudi supplies, now more than 9 million barrels a
day, will have to increase to 13 - 15 million barrels a day in 2010 to meet
growing world demand and offset resource depletion in non-OPEC suppliers. By
that time the United States will be importing more than 60 percent of its oil.
Saudi Arabia has both the potential and the reserves to meet projected demand,
but the expansion will call for investment resources from that country as well
as the world financial community. For a healthy oil sector, the availability of
such financing should be no problem. Over the past few decades the Gulf
countries have proved to be stable; continued internal and external stability is
crucial to energy security. Disruption of the Gulf oil flow would lead to a deep
world-wide recession. This has been presented as one of the gravest threats
imaginable to U.S. interests, short of physical attack (David, 1999).
The cost of energy security goes beyond investing in redundant
facilities and building pipelines, grids, and strategic reserves. Tremendous
military expenditures - both visible and invisible - are required to head off
any threats to the flow of oil, particularly from the Gulf countries. These
costs cannot be easily computed or ascertained. The enormous expenditures on the
1990 - 91 Gulf War, totalling several hundred billion dollars, were meant to
ensure energy security for major oil importers and the world oil markets in
general. The six Gulf Cooperation Council (GCC) states, which control nearly 45
percent of the world’s recoverable oil resources, contributed more than $60
billion to the U.S.-led allied offensive to eject Iraqi forces from Kuwait in
1991 (AFP, 1998). The GCC countries’ contribution in 1991 exceeded their
oil export income in 1998 or 1999. The United States maintains a costly military
and naval presence in strategic locations to ensure the uninterrupted flow of
GCC oil exports to world markets. At the beginning of 1998, along with the
United Kingdom, it assembled large air and naval forces to address perceived
threats to the security of oil supply from the Gulf.
Although short-term disruptions in energy supply due to regional
conflicts cannot be ruled out, means to overcome such disruptions already exist.
The best illustration of this is the minimal effect on oil markets from the
Iraqi invasion of Kuwait in 1990. Although 4 million barrels of oil a day
dropped out of the market, Saudi Arabia increased its production and restored
stability to the oil market and to prices within a few weeks. Instruments for
stabilising the oil market are improving year after year - strategic stocks held
by oil companies and major importing countries, development and liberalisation
of markets, and regional and global energy agreements. And once transport and
transit issues are resolved, the Caspian Sea countries’ hydrocarbon
resources, as a supplement to the North Sea resources, can be added to this
list.

FIGURE 4.3. FLOW OF GULF OIL
SUPPLIES, 2010
Source: Kemp and Harkavy, 1997.
Oil stocks: cushioning against supply disruptions. Oil
stocks are usually held by oil companies for operational purposes, and by
countries and state utilities to provide a cushion against unexpected surges in
demand and possible disruptions in imports. Oil companies usually hold stocks
that account for 55 - 65 days of consumption. International Energy Agency
members are required to hold emergency oil stocks equivalent to at least 90 days
of net imports. The European Union requires its members - also IEA members - to
hold stocks equivalent to at least 90 days of consumption. It is not easy to
estimate oil stocks held by developing countries. Because of the cost, their
stocks are relatively smaller than those of OECD countries, but can amount to 25
- 55 days of consumption, which is also typical for oil companies in these
countries. Correspondingly, world oil stocks in 1997 were about 5,500 million
barrels, equal to 70 - 80 days of average global consumption. This, at present,
is adequate for unexpected transient shortages or temporary interruptions.
With the continued growth of non-OECD oil consumption, oil
stocks will function less effectively. Their size relative to the global oil
market will decline, since most developing countries do not maintain emergency
oil stocks (many cannot afford them). If this trend continues, vulnerability to
sudden and substantial oil supply disruptions will increase.
Liberalisation of markets: easing the flow of oil.
Another aspect of security is the liberalisation of energy markets in importing
countries. Liberalisation and deregulation, coupled with the development of oil
futures and forwards markets, mean an easier and more secure flow of oil from
exporting to importing countries. Most oil producers are now inviting foreign
companies to participate in oil development, which will significantly enhance
the security of the oil market. And the strengthening of the World Trade
Organization will add further to the security of the energy market.
Although security in terms of flows of oil and gas to importing
countries is improving, the security of supply to consumers faces new
challenges. Liberalisation, the withdrawal of government responsibility for
supply, and competition among private suppliers are creating challenges in
securing reliable supply to individual consumers. These are discussed later in
detail.
Energy treaties and agreements: enhancing energy security
through cooperation. In response to insecurity after the first oil shocks,
OECD countries convened a conference in Washington, D.C., in 1974 that led to
the establishment of the International Energy Programme (IEP), the founding
charter of the International Energy Agency(IEA). To improve energy security, the
participating countries pledged to hold oil stocks equivalent to 90 days of net
imports. They also developed an integrated set of emergency response measures
that included demand restraint, fuel switching, and surge oil production. These
measures also included the important provision of stock draw-down and sharing of
available supplies in the event of oil supply disruptions involving a loss of 7
percent or more for any member country or for the group (Martin, Imai, and
Steeg, 1996).
In 1977 the IEA developed another set of coordinated emergency
response measures that allow for a rapid and flexible response to an impending
oil security crisis. Also in that year, IEA countries agreed to long-term energy
policies and programmes aimed at diversifying resources, employing energy
efficiency measures, and developing new energy technologies. And in response to
changing circumstances, the IEA updated its policies in a statement of shared
goals at its ministerial meeting in 1993.
In 1991, 51 countries signed the European Energy Charter to
enhance energy security throughout the Eurasian continent and promote the
creation of an open and non-discriminatory energy market. The signatories
included the European Communities and their member states, the countries of
Central and Eastern Europe, all the members of the Commonwealth of Independent
States (CIS), and Australia, Canada, Japan, and the United States. By applying
the principles of non-discrimination and market-oriented policies, the charter
was aimed at improving energy security, increasing the efficiency of all links
in the energy chain, enhancing safety, and minimising environmental impacts.
Three years later, in 1994, all the signatories to the European
Energy Charter (except Canada and the United States) signed the Energy Charter
Treaty, along with a protocol on Energy Efficiency and Related Environmental
Aspects, which entered into force in 1998. Japan and the Central Asian states
have since signed the Charter Treaty and China is showing increasing interest in
it, enhancing its geopolitical scope. The treaty applies to all economic
activities related to a broadly defined energy sector. Its main purpose is to
promote the creation of an open and non-discriminatory energy market throughout
the Eurasian continent (Schuetterle, 1999). The Charter Treaty obligates
signatories to encourage and create stable, equitable, and transparent
conditions for foreign investors in their countries, stipulates that General
Agreement on Tariffs and Trade (GATT) provisions will govern trade in energy
materials and products, ensures the transit of energy exports through third
countries, and sets out procedures for settling disputes relating to the
treaty’s provisions.
|
OECD countries, which account for
almost 80 percent of the
world's
economic activity and 63 percent
of global oil consumption,
are
particularly dependent on
oil imports. |
Also serving to enhance energy security are interregional and
intraregional agreements established to foster economic cooperation between
member countries, such as Asia-Pacific Economic Cooperation (APEC), which
involves 21 economies of Asia, Oceania, and the Americas (box 4.3). Enhancing
energy security is one of the aims of APEC, which set up its own Energy Work
Group and the Asia Pacific Energy Research Centre (APERC) for this purpose.
No doubt the above-mentioned treaties and arrangements helped to
foster energy investments and improve energy security - not only for their
members, but also globally - by encouraging sustainable energy policies.
Oil in transport: a special point of vulnerability. The
transport sector accounts for half of global oil demand, with heating,
electricity generation, industrial processes, and petrochemicals accounting for
the rest. Demand for oil in transport is growing rapidly, particularly in
aviation. Over the next 20 years demand for oil in transport is expected to grow
by 2.3 percent a year, compared with growth in total demand for oil of around
1.9 percent a year. Most of this growth will occur in non-OECD countries, where
it is expected to average 3.6 percent a year, with the highest growth projected
for China and East and South Asia. Demand in OECD countries, which are already
witnessing some saturation in vehicle ownership, is expected to grow at
one-third that rate.
In the near term there is no cheap and viable alternative to oil
in transport, particularly in private vehicles and aviation (Douaud, 1999). Use
of oil for mobility will increase in all countries, as the transport fleet grows
and uses exceed improvements in transport efficiency. An interruption in oil
supply, however temporary, could cause major disruption to the transport sector
and to the world economy.
Oil prices: a source of insecurity. The severe volatility
of oil prices in the 1970s and early 1980s contributed to the insecurity in
energy markets. The price of oil is the market leader for energy pricing. Gas
and coal, because of competition, are priced accordingly.
OPEC has the power to influence oil prices by allocating supply
and monitoring and restricting production by its members. With the growing
discipline in its ranks, this influence may increase in the future. Moreover,
the depletion of non-OPEC oil and future growth in its marginal cost will
increase oil prices in the medium and long term. Prices will be further
increased by the development of the more expensive non-conventional oil, once
crude oil supply peaks around 2010. Although short-term price volatility, like
that in 1998 - 2000, cannot be ruled out because of the many factors explained
above, oil prices are not expected to be as volatile as in the past. After 2010
gradual, moderate price increases are expected. Many recent predictions have
been made of future oil prices. Two of these are given in table 4.3.
|
BOX 4.3. ASIA-PACIFIC ECONOMIC COOPERATION’S EFFORTS
TO ENHANCE ENERGY SECURITY
Asia-Pacific Economic Cooperation (APEC) includes the following
member economies in six ‘sub-regions’:
· The United
States.
· Other Americas - Canada, Chile, and
Mexico.
· China.
· Other Asia - Hong Kong (China), Japan, Republic of
Korea, and Taiwan (China).
· Oceania -
Australia, New Zealand, and Papua New Guinea.
· Southeast Asia - Brunei Darussalam, Indonesia,
Malaysia, Philippines, Singapore, and Thailand.
In addition, Peru, the Russian Federation, and Viet Nam joined
APEC in November 1998.
APEC was formed to foster economic cooperation among its member
economies, one aspect of which is energy cooperation and security. APEC
economies’ energy requirements account for more than half of the
world’s primary energy supply. The group has rich coal resources, and gas
resources almost adequate for its requirements. But it is very short in crude
oil resources. By 2010 APEC economies will have to import an estimated 55
percent of their energy requirements. The recent incorporation of Russia, with
its enormous gas resources and its oil, has helped alleviate APEC’s serious
energy security problem. Nevertheless, APEC’s significant crude oil
shortages are expected to continue. APEC tries to enhance its energy security
through the following actions:
· Encouraging expansion of
energy production. The entry into APEC of Russia, with 40 percent of global
gas reserves and 9 percent of oil reserves, should facilitate the development of
energy resources in the Asian part of Russia and enhance the supply potential to
the growing Asian energy market. The need for expanded production will lead to
more energy development and greater cooperation between APEC economies and other
energy-producing economies outside the traditional APEC region. The
participation of firms from Asian oil-importing economies in upstream
hydrocarbon resource activities will enhance efforts to expand oil and gas
production. Similarly, the participation of firms from oil-exporting countries
in downstream operations in Asian markets will contribute to the security of
energy supply.
· Allowing more flexible fuel
choices. As a group, APEC economies are heavily biased towards coal use. The
main reason is that China, which accounts for a fifth of APEC’s
requirements, uses coal to meet more than 70 percent of energy demand.
Institutional and technological changes to support more flexible choices that
are compatible with sustainable development are being considered. Within APEC,
nuclear options have been and will be pursued in the Americas and East Asia. In
the Americas, however, nuclear power is expected to play a reduced role, while
in East Asia nuclear power is expected to expand. In Southeast Asia there is no
likelihood that nuclear power will be introduced before 2010.
· Preparing for energy supply
disruptions. Emergency oil stocks, like those held by members of the
International Energy Agency (IEA), are a key element of energy security. With
the growth of non-IEA oil consumption, IEA emergency oil reserves will function
less effectively, as their size relative to the global market will decline and
most non-IEA countries do not maintain emergency oil stocks. If this situation
persists, vulnerability to sudden and substantial oil supply disruptions will
grow. The issue of emergency preparedness therefore needs to be examined in a
broader context. For this reason the Asia Pacific Energy Research Centre is
conducting a study to assess the value of emergency oil stocks in APEC
economies.
· Promoting energy reforms.
The increased competition resulting from regulatory reforms in energy
markets promotes energy security in many ways. Yet despite the global trend
towards energy sector liberalisation, some APEC economies in Asia still believe
that energy security requires maintaining a regulated energy market. Attitudes
towards deregulation are gradually softening, however, as long as it does not
preclude the state from continuing to play a role when needed to enhance
security.
· Developing transborder
energy delivery infrastructure. APEC economies are examining the feasibility
of developing transborder infrastructure. Members of the Association of
Southeast Asian Nations (ASEAN) have studied the creation of both gas pipeline
networks and electricity grids linking producer and consumer members. In
Northeast Asia the concept of a gas pipeline network linking former Soviet
economies (Russia and Turkmenistan, for example) with China, the Republic of
Korea, and Japan has been discussed. Finally, Russia is promoting the idea of
linking electricity grids with neighbouring economies. Besides economic
viability, there are many other considerations in such projects: improved
regional political stability through cooperation, better use of untapped
resources, and increased capacity utilisation, energy supply, and demand
diversity. |
Such moderate price increases, along with continuous improvement
in energy efficiency, mean that oil prices are unlikely to place a more serious
burden on the global economy than they do now. Moreover, the expected
improvements in the real price of oil will spur producing countries to enhance
and expand their production and provide them with the badly needed financial
resources to do so.
Income security for oil-exporting countries. Some
countries depend - for income and for development - on energy exports,
particularly oil. This group is not limited to the Middle East; it includes a
few countries in Sub-Saharan Africa and Latin America. Nor is this dependence on
oil export income restricted to exporting countries; the benefits of oil export
income spread to other countries in the region through wage remittances and
financial assistance.
In the Gulf countries three-quarters of government revenue is
derived from oil exports. Energy exports account for almost two-thirds of
government revenue for other countries in the region, such as Algeria, the
Islamic Republic of Iran, and Yemen. The dramatic drop in oil prices in 1998 and
early 1999 led not only to budgetary problems in many energy-exporting
countries, but also to unemployment and significant drops in incomes. Such
economic problems were not only restricted to the oil exporters but were also
experienced by their neighbours, which depend on revenues from exports of goods
and services to the oil-rich countries and on remittances from workers in these
countries. For energy-exporting countries, export security is becoming as
important as energy import security is to resource-short countries. All this is
enhancing the prospects for global energy security.
TABLE 4.3. OIL PRICE PROJECTIONS (1997 U.S. DOLLARS PER
BARREL)
|
Source of projections |
1997 |
1998 - 2010 |
2015 - 2020 |
|
International Energy Agency |
18.50 |
24.50 |
26.20 |
|
U.S. Department of Energy |
18.55 |
21.30 |
22.73 |
Source: IEA, 1998; USDOE, 1998.
Dependence on oil exports has an additional implication for
exporting countries. These countries, particularly OPEC members, are worried
about the possible long-term impact on export demand of policies to mitigate
environmental impacts, promote energy efficiency, and increase use of renewable
energy sources. Although exaggerated in the short term, the potential impact
could pose long-term problems for the countries, adversely affecting their
economic and social development. Having met the needs of the global energy
sector satisfactorily over the past 25 years, oil-exporting countries are asking
for compensation if mitigation actions start to bite. This request is being
reviewed in international negotiations. It may be many years before exporting
countries’ income is affected. Meantime, it is hoped that with
international assistance and compensation, they will be able to diversify their
income sources and reduce their dependence on oil
exports.
Security of natural gas supply
Natural gas is slowly gaining importance in the energy market.
Between 1987 and 1997 gas consumption increased from 1,756 giga cubic metres to
2,197, for an annual growth rate of 2.27 percent, compared with 1.47 percent for
total primary commercial energy consumption. Over the period until 2020 natural
gas demand is expected to grow still faster - at an annual rate of 2.6 percent,
compared with 1.9 percent for oil. And natural gas supply, since it is starting
from a much lower base than oil supply, is not expected to peak until well
beyond 2020 (IEA, 1998).
Internationally traded natural gas accounted for 19 percent of
gas consumption in 1997, compared with 44 percent for oil. So, just as for oil,
though to a lesser extent, there is a mismatch between the location of gas
supply and its consumption. Security of supply is therefore critical. But the
physical characteristics of natural gas make ensuring security of supply for gas
more complicated than for oil. Crude oil is an eminently fungible commodity,
portable by ship, pipeline, road tanker, or even barrel. In contrast, gas
requires expensive pipelines or LNG infrastructure. These delivery systems are
relatively inflexible: pipelines cannot be moved or built overnight, and LNG,
although somewhat portable, still requires an expensive receiving terminal.
Crude oil and, more important, refined oil products can be transported to any
location that can receive a ship or road tanker. Moreover, gas is difficult to
store in significant quantities. The energy content per unit of volume is much
lower for gas than for oil. Gas is simply more difficult to handle than liquid.
Its storage often depends on the suitability of geological structures, while oil
tank farms can be built relatively easily and cheaply. All these factors mean
that the solutions used to ensure security of oil supply (storage,
diversification of supplies) do not apply as easily to gas.
At its simplest level, gas supply security can mean operational
reliability - in other words, that gas flows to the consumer when it is
required. In particular, this means meeting consumer needs on days of peak
demand, usually in winter. The gas supply system must be configured to give the
required flexibility.
Security of supply also involves reducing strategic risk,
namely, the risk of a major disruption to supplies caused by, for example,
political factors or major technical failure, such as the failure of a
high-pressure pipeline. This is an extension of operational security, but of a
different order of magnitude. Strategic risk is growing in parallel with the
growing share of gas in meeting countries’ primary energy requirements. It
can be reduced through:
· Interconnectivity,
the degree of physical interconnection with other gas systems, an important
factor in ensuring strategic security of supply. Interconnectivity is more than
simply a guard against potential failure; it also encourages diversity of
supply.
· Diversity of supply, which is
fundamental to security of supply because it spreads risk. All sources of supply
are unlikely to fail at the same time. Countries have often explicitly
diversified supply by contracting with several countries. France, for example,
buys gas from Algeria, the Netherlands, Norway, and Russia. In recent years
there have been a number of spot LNG sales into Europe from LNG suppliers using
spare capacity.
Security of supply also entails guarding against long-term risk
- ensuring that consuming countries can secure future and additional supplies as
their existing supplies are depleted. This represents a challenge, as the bulk
of the world’s gas reserves are in areas that are far from current markets
and also often have a high level of country risk.
Some gas-importing countries, such as France, use long-term
strategic storage to guard against significant disruption of supply. Such
storage can be in depleted oil or gas fields, aquifers, salt caverns, or other
geological structures.
Political risks to gas supplies and security of interregional
grids. With the increase in internationally traded natural gas and LNG,
political risk to gas supplies and cross-boundary networks will increase. One of
the measures taken to reduce political risk is the Energy Charter Treaty, which
attempts to provide a legal framework for the transit of hydrocarbons and
electricity through pipelines and grids. The treaty prohibits contracting
parties from imposing unreasonable charges for the transit of energy or taking
unreasonable or discriminatory actions. Most important, in the event of a
dispute over transit, transit states may not interrupt or reduce existing
transit until the parties have had an opportunity to resolve the dispute using
the treaty’s dispute resolution mechanisms. As a further aid to
international gas trade, the treaty prohibits countries from refusing new
transit or new capacity to other treaty signatories solely on the basis of the
origin, destination, or ownership of the energy being transported.
Political risk is also an issue for investment in the gas
industry. Because of the capital intensity of the industry, a sound investment
environment is needed to encourage companies to invest. This requires clear
legal, fiscal, and contractual frameworks; transparent regulatory processes; and
regulatory certainty. To improve the international investment environment for
projects involving the transit of gas as well as oil and electricity across
national boundaries, the Energy Charter Conference, an intergovernmental body
made up of the 51 states that have signed the Energy Charter Treaty, began in
1999 to elaborate the Multilateral Transit Framework Agreement. The aim is to
strengthen the international rule of law on transit issues by further developing
the treaty’s transit provisions.
With increasing utilisation of gas, lengthy gas pipeline grids
across countries and boundaries are becoming familiar. This raises concerns
about political and security problems relating to the integrity of the pipeline
and continuity of supply - because of possible regional disputes, disagreements
among firms, or accidents or sabotage. One of the principal aims of the Energy
Charter Treaty is to provide for such contingencies. But not all countries are
signatories to the treaty, though the numbers are increasing. However, the
treaty provides guidelines (explained above) that non-member countries can
incorporate in agreements relating to cross-boundary pipelines. Moreover, the
increasing strength of markets, the World Trade Organization regulations, and
the increasing interdependence of markets and countries enhance the security of
supply from regional gas grids.
Natural gas is an ideal fuel for electricity generation. It is
environmentally benign compared with coal and offers the potential for very high
efficiencies in combined cycle plants. Like oil, natural gas resources are
unevenly distributed across the world, but unlike oil, gas is not easily
transportable or tradable. Expensive interregional gas grids are a solution as
long as security is guaranteed, an aim of the Multilateral Transit Framework
Agreement. Interregional grids provide benefits to all - suppliers, consumers,
and transit countries. In addition, the increased security inherent in pipeline
systems enhances cooperation among the countries involved.
Satisfying the increasing energy demand in India and South and
East Asia may require building a very large interregional pipeline from the
Islamic Republic of Iran or the Gulf. This would require not only a huge
investment but also a coordinated regional arrangement and guarantees. Such a
pipeline could sustainably meet the increasing demand for electrification in
parts of Asia that account for more than a third of the world’s population
and where electricity demand is growing at twice the world average.
Risks to internal security of supply. In addition to the
external risks, internal security risks are on the increase. These include the
risk of electricity shortages due to increasing dependence on gas in electricity
production. This increasing reliance on gas also raises supply security issues
because of the possible domino effect in the event of gas supply problems. As a
result of an interruption in gas supply to gas-fired power stations, a national
grid could find itself short of capacity just as demand is peaking. Such
security risks can be reduced, however, through coordination between the gas
grid and the electric utilities, by switching combined cycle gas turbines (CCGT)
to other fuels in the event of gas shortages, and by diversifying the energy
sources for power generation (coal, nuclear, oil, gas, and hydro).
|
Tremendous military
expenditures - both visible
and
invisible - are required to head
off any threats to the
flow of
oil. |
Diversity is more important than origin of supply. The
mechanisms for securing diversity can be based on market instruments (payments
for reserve capacity) or regulation (requirements for storing a certain number
of days’ worth of backup fuel supply). The U.S. gas market has shown how
the price mechanism can enhance security of supply during less severe shortages.
Many power stations burn both fuel oil and natural gas. As gas prices rise and
the supply-demand balance tightens, the generators switch to the cheaper fuel,
freeing up supply for gas consumers who cannot switch.
Development of national gas markets. Traditionally,
international gas trade has been conducted on the basis of long-term
(several-year) take-or-pay contracts. Under these contracts, designed to manage
risk, the buyer agrees to take a certain volume over a period of time and to pay
for that volume regardless of whether it is actually used. In effect, the buyer
takes all the volume risk (the risk as to how much gas the end-use market will
actually consume). The seller agrees to sell a certain quantity at a price
indexed to such factors as the price of competing fuels, the price of
electricity, and producer inflation. The seller therefore takes the risk that
this price will cover its costs of production and provide a return on its
investment. This is completely different from a commodity market, where supply
and demand balance at whatever is the market-clearing price.
The ‘traditional’ take-or-pay system also frequently
involved either monopsony or oligopoly buyers such as the European utilities
(including the old British Gas and Gaz de France) and the Japanese utilities
(Tepco). It has been argued that such a system was the only way to match supply
and demand, ensure orderly development of the market, and allow all parties to
recoup their investments. The approach has evidently worked: the record on gas
supply security in Europe and Japan has been exemplary.
Recently, however, attention has focused on the implications of
the liberalisation of gas markets for security of supply. In the United States
the natural monopoly aspect of gas supply, gas transport by pipeline, has been
separated from the other functions - production, wholesale, and retail.
Regulated third-party access has given any gas producer the ability to transport
its product to the end market, and any customer the ability to buy gas from any
producer or wholesaler. In short, the approach has enhanced U.S. supply
security. But the U.S. experience cannot necessarily be applied to other
countries.
Long-term take-or-pay contracts do not completely eliminate
political or commercial risks. If a country is unable or unwilling to export its
gas reserves for whatever reason, who has legal title to them is irrelevant.
What such contracts can do, and have done in the past, is to give the parties a
degree of confidence in the viability of a project and help secure financing.
By separating transport from supply, liberalisation, over the
long term, will encourage the producers able to supply the market at lowest cost
to meet consumers’ demand. Moreover, the U.S. experience suggests that as
pricing of gas supply and associated services becomes more transparent and
explicit, market participants will search for the most cost-effective way of
ensuring gas supply. In the United States this has led to greater and more
innovative use of storage. The results depend, however, on how the industry
structure and regulations evolve - whether dominant players effectively keep out
new entrants, for example, or a more level playing field develops.
In summary, while the physical characteristics of gas make
supply security problematic, it can nevertheless be enhanced by a variety of
mechanisms, enabling gas to continue to play its part in the world’s energy
balance. Liberalisation of energy markets is not incompatible with supply
security, and can arguably enhance
it.
Security of coal supply
Coal presents fewer challenges - other than environmental ones -
to energy security than do oil and gas. It is abundant and more evenly
distributed around the world than oil or gas. It is cheap, and costs are
continuously being reduced by competition. The many suppliers and the
possibility of switching from one to another mean supply security. The global
ratio of coal reserves to production is 225 years; for OECD countries, it is
even higher. Coal is still a local fuel, however. International trade in coal is
limited, amounting to only 13 percent of production, a smaller share than for
gas.
The huge reserves of coal and their even distribution contribute
to global energy security. Coal will continue to play a major part in ensuring
the energy security of large energy consumers, particularly China (the largest
coal consumer), the United States, and South Asia. Over the next few decades the
growth in demand for coal is expected to continue to be healthy, exceeding the
growth in overall energy demand.
Most of that growth will be for electricity generation, with
coal consumption in the electricity sector expected to grow in all regions. But
this is also the area where the main security challenge arises, because of the
environmental effects of coal use - locally, regionally, and also possibly
globally. Coal utilisation is very inefficient, particularly in power
generation, where its efficiency is less than 25 percent (Ecoal, 1998). The
efficiency of oil and gas in electricity generation is at least 50 percent
higher.
For coal to play its deserved role in global energy security,
its many detrimental environmental impacts must be addressed. This will require
not only clean coal technologies for new plants, but also rehabilitation and
refurbishment of existing inefficient plants. And this must happen not only in
industrialised countries, but also in developing countries, which are expected
to account for most coal use. All this calls for technology transfer and huge
investments, which many developing countries will be unable to afford. Thus
technical assistance to developing countries will be
essential.
Nuclear energy and energy security
Nuclear energy could continue to add to the energy security of
countries short of hydropower and indigenous fossil fuel resources, for several
reasons. Uranium resources are widely distributed and abundant world-wide (see
chapter 5). Nuclear fuel is cheap: at the price of present long-term uranium
supply contracts, the cost of natural uranium per kilowatt-hour is equivalent to
an oil price of $0.35 per barrel, so several years’ supply could be kept in
reserve against possible future supply disruption at a low cost. And the cost of
uranium contributes only about 2 percent to the cost of nuclear electricity
generation, compared with 40 - 70 percent for fossil fuels in electricity
generation,1 making the cost of nuclear electricity relatively
insensitive to possible future increases in the uranium price.
These considerations played a key part in the decisions of such
economies as France, the Republic of Korea, Japan, and Taiwan (China) to launch
major nuclear power programmes. In all likelihood, such considerations will also
be important determinants in similar decisions by countries with a shortage of
indigenous resources and a heavy reliance on imports. Moreover, the fact that
nuclear power releases virtually no environmentally damaging emissions of carbon
dioxide, sulphur dioxide, and nitrogen oxide could make it an attractive option
for many countries seeking technologies leading to reduced greenhouse gas
emissions or abatement of local and regional pollution.
In the 1960s and 1970s, particularly after the first oil shock,
nuclear power promised to be a viable solution for industrialised countries
looking for energy security and cheap power. Largely as a result of investment
decisions made in that period, nuclear power has grown to the point where it
dominates electricity generation in several industrialised countries, providing
about a sixth of global electricity in 1998. But the outlook for nuclear power
is not bright. Most of the promise of nuclear energy has evaporated as a result
of loss of investor and public confidence in the technology. There is likely to
be growth in nuclear power in some Asian countries in the period to 2020 and
modest expansion at the global level until 2010. But most projections show
nuclear power accounting for a smaller share of global electricity generation in
2020 than today, and many show its absolute contribution staying the same or
even shrinking.
The loss of investor and public confidence in nuclear technology
is due to concerns about costs, nuclear safety, radioactive waste disposal, and
proliferation or diversion (see chapter 8). Until these concerns are adequately
dealt with, nuclear energy is unlikely to play an expanding role in enhancing
global energy security. The energy security benefits provided by nuclear power
might even be diminished if there is another reactor accident involving
substantial releases of radioactivity or a proliferation or diversion incident
that could be plausibly linked in the public mind to nuclear power.
Recognition that another major accident might not only diminish
prospects for nuclear expansion but also trigger demands to shut down existing
nuclear plants has catalysed private sector-led efforts, under the auspices of
the World Association of Nuclear Operators, to instil a culture of safety in the
world's nuclear industry. This situation has also prompted an international
effort, led by the International Atomic Energy Agency, to bolster national
nuclear regulatory regimes. This effort is embodied in the Convention on Nuclear
Safety, adopted by the organisation’s members. (For discussion of
technological strategies for improving the safety of future reactors, see
chapter 8.)
The Nuclear Non-Proliferation Treaty and associated
international safeguards and nuclear supplier agreements have been implemented
to minimise the nuclear weapons link to nuclear power (Murray, 1995). To date,
all but a few states (apart from the five nuclear weapons states recognised in
the 1968 Non-Proliferation Treaty, these are India, Israel, and Pakistan) have
committed themselves to putting all nuclear material, including the material
used for uranium enrichment and reprocessing, indefinitely under safeguard of
the International Atomic Energy Agency.
Recent events and concerns about the limitations of existing
policies have led various experts to call for further efforts to weaken the
nuclear weapons link to nuclear power. But because the risk of proliferation and
diversion is not at the forefront of public concerns about nuclear power (and
may not be until there is an incident), because national policies in this area
differ widely, and because there is much disagreement in the technical community
about the best approaches for minimising this risk, there has been less action
in this area than there has been in improving reactor safety. Increasing the
authority and resources of the International Atomic Energy Agency for monitoring
enrichment plants and spent fuel is the principal way immediately available to
reduce the proliferation risks associated with existing uranium enrichment and
fuel reprocessing capabilities. (For a discussion of institutional strategies
for further weakening the nuclear weapons link, see Walker, 1998. For a
discussion of future options for weakening this link with advanced technologies,
see chapter 8.)
In summary, for the next couple of decades the prospects for
enhancing energy security through expansion of nuclear power are not bright at
the global level, although they are somewhat better in some Asian countries. In
the longer term whether nuclear power can contribute to energy security depends
not only on technical and economic considerations to be sorted out by the
market, but also on the extent to which the public can be convinced that nuclear
power is safe and that wastes can be disposed of safely. It also depends on
whether the industry can avoid major accidents and proliferation and diversion
incidents, and whether national and international policy-makers and the
technical community can reach consensus on what needs to be done to make nuclear
energy technology widely acceptable.
|
If the world economy continues
to grow at the expected
average rate
of 2.7 percent, in 2020 global
energy demand will be
45-51
percent higher than
in 1998. |
Energy intensity
One way to improve energy security in any country is by reducing
its energy intensity - the amount of energy required to produce one unit of GDP.
The rate of change in energy intensity reflects the overall improvement in
energy efficiency as well as structural changes in the economy. Declining rates
of energy intensity indicate that economic growth is less tightly linked to
increases in energy use.
Energy intensity has improved considerably in industrialised
countries. In the United States over the past two centuries it has declined 1
percent a year on average. One unit of GDP now requires only a fifth of the
primary energy required 200 years ago (IIASA and WEC, 1998). In the past 15
years energy intensity in the United States has improved 20 percent.
Energy intensity differs depending on the level of economic
development. OECD countries generally have an energy intensity that is a
fraction of that in developing countries. In 1996 the commercial energy
intensity of middle-income developing countries was three times that of
high-income countries. This finding remains whether GDP is measured in market
dollars or in purchasing power parity (PPP) terms. In most developing countries
energy intensity is stagnant or even increasing because these countries are in
the early take-off stages of industrialisation, when energy-intensive industries
and infrastructure are being established. Moreover, low-income developing
countries usually show increasing commercial energy intensity because commercial
energy sources are replacing non-commercial fuels.
The prospects for lowering energy intensity are reduced in many
developing countries by the proliferation of energy price subsidies and by the
use of inefficient and outdated plants and equipment. Generally, however, energy
intensity in developing countries is similar to that in industrialised countries
when they were at an earlier stage of development.
Economic growth in developing countries has been relatively high
in recent years, averaging 2.8 percent a year in the 1990s, compared with 2.1
percent for industrialised countries and 2.3 percent for the world. This trend
is likely to continue. If this growth is matched by measures to conserve energy
- such as phasing out subsidies and improving environmental awareness - energy
security in developing countries is likely to continue to improve as well.
Predicting the future of energy intensity is difficult,
particularly for developing countries. In low-income countries energy intensity
may increase in the next few years as these countries substitute commercial
energy for traditional fuels. But for the world as a whole, energy intensity is
likely to improve. Average improvements will range from 0.8 percent to 1.0
percent a year, depending on such factors as environmental awareness and energy
prices (IIASA and WEC, 1998). If the world economy continues to grow at the
expected average rate of 2.7 percent, energy demand growth will average 1.7 -
1.9 percent a year. That means that in 2020 global energy demand will be 45 - 51
percent higher than in 1998. This is a substantial increase. But without the
expected efficiency improvements in global energy utilisation, the demand could
grow as much as 80 percent.
The potential for efficiency improvements is high in many energy
applications (see chapter 6). Some of the most important progress in energy
efficiency is that taking place in the conversion of energy to electricity.
Modern combined cycle gas turbines burning natural gas have efficiencies
approaching 60 percent, and efficiencies of 70 percent are within reach in the
foreseeable future. Such efficiencies are more than double the average of 31
percent for the world stock of existing generating plants. As old plants are
phased out and new, CCGT-type plants - or the traditional thermal generating
plant firing coal at more than 40 percent efficiency - take over, considerable
improvements in energy utilisation will gradually occur. In addition, the
increased use of electricity as an energy carrier world-wide will further
improve energy efficiency. In some applications electricity is more efficient
than other forms of energy, and its use is now growing 2.8 - 3.2 percent a year,
a rate more than 50 percent higher than that for primary energy overall (Khatib,
1997). All this will significantly lower energy intensity and thus improve
prospects for global energy
security.
The environment and energy security
The idea of sustainable development is gaining acceptance on the
official level as well as among the public. Sustainable development demands
environmental preservation. Energy production and utilisation, particularly in
the case of fossil fuels, can be major sources of environmental degradation.
These detrimental environmental impacts have a direct bearing on the future of
energy - in terms of fuels and the extent of their use - and on energy security.
(For a discussion of the environmental impacts of energy use, see chapter 3.)
The United Nations Framework Convention on Climate Change,
adopted at the Rio Earth Summit in 1992, and the Kyoto Protocol, signed by more
than 160 countries in 1997, call for major reductions of greenhouse gas
emissions, which are caused mainly by energy use. Fulfilling the commitments as
agreed and at the schedules approved would greatly affect the use of energy
resources and could compromise global economic progress. There is a large gap
between the commitments and the means for implementation. Targets agreed upon by
negotiators were not necessarily implemented by legislators or other
policy-makers. Implementation of such targets is hindered not only by cost but
also by the need to maintain energy security.
All indications are that fossil fuels will continue to dominate
global energy resources for at least the first decades of the 21st century.
Moreover, the demand for energy services will continue to increase. Most of the
growth will be in developing countries, which can ill afford the high cost of
containment measures. It is therefore essential to find means to contain
energy-related emissions without compromising energy security.
The environmental effects of energy use occur at the local,
regional, and global levels. Local effects consist primarily of heavy
hydrocarbons and particulate matter (including sulphur flakes) that are
deposited within hours and can travel up to 100 kilometres from the source.
Regional effects include emissions and effluents, the most important of which
are sulphur and nitrogen oxides, which are converted into acids; these acids,
which last for a few days in the atmosphere, may travel up to a few thousand
kilometres before being deposited, often after crossing boundaries. Global
environmental impacts are exemplified by emissions of carbon dioxide and other
gases (mainly methane) that have long residence times in the atmosphere.
|
The increased use of
electricity as an energy
carrier
world-wide will further
improve energy
efficiency. |
Local and regional impacts can be addressed by technologies.
However, some of these technologies are expensive for developing countries,
where growth in the use of low-quality coal will be particularly high. There are
no easy answers in dealing with greenhouse gas emissions. Mitigation and
sequestration measures are still to be developed. The most practical solution is
to reduce the growth in fossil fuel use by increasing efficiency in energy
utilisation.
Enhancing efficiency in energy use not only helps greatly to
mitigate emissions; it also improves energy security. But for greater benefits
for energy security, energy use should also be made more compatible with the
aims of sustainable development through better containment of emissions. Such
simple measures as washing coal will rid it of 20 - 50 percent of its sulphur.
Advanced burners and scrubbers remove pollutants and effluent gases from smoke
stacks and chimneys. Fuel substitution is another effective measure. A modern
CCGT power station, firing gas, will emit only 40 percent as much carbon dioxide
as a traditional coal-fired thermal power station. The slow but persistent
growth in the use of electricity as an energy carrier will also contribute
towards energy security. Besides offering greater efficiency than other forms of
energy in many applications, electricity concentrates emissions in a single
remote location - the site of the power station - making them easier and cheaper
to deal
with.
Markets and energy security
Approaches to ensuring energy supply security in the 21st
century should differ from past approaches that concentrated on oil
substitution. Besides sustainable growth challenges, new approaches need to
tackle the new energy security issues raised by market liberalisation.
The enhanced role of markets is tied closely to the process of
globalisation. Globalisation, which is still gaining momentum, has encouraged
competition and strengthened markets and regional and international trade,
particularly for crude oil and oil products, natural gas, and energy services.
Globalisation is bringing new opportunities for energy security, such as better
access to markets and services and the transfer of technologies that are helping
to reduce the cost of energy exploration and expand proven reserves.
International trade in energy resources and services is vital
for energy security. The creation of the World Trade Organization in 1995, built
on the GATT, is the latest multilateral step towards creating an environment
conducive to the exchange of goods and services. It will assist in trade
liberalisation and allow countries greater recourse to trade dispute settlement
mechanisms. Foreign trade has grown more quickly than the world economy in
recent years, a trend that is likely to continue. For developing countries,
trade is growing faster than national income, reaching 50 percent of GDP, and a
good share of that trade is in energy. The flow of information has become much
easier and more transparent, increasing the resources and services available for
trade and reducing prices. All this aids greatly in enhancing energy security.
The introduction of a single market in Europe will lead to more
competition in energy services and supply of cheaper electricity. Improvements
in transport networks and technology are reducing the cost of energy trade. The
liberalisation of European gas and electricity markets will initiate major
structural changes in European energy enterprises, increasing competition,
improving economic performance, and contributing towards fuel diversification
and greater energy security (EC, 1999).
In studying the influence of markets, there is a need to
distinguish between OECD countries, where free markets prevail, and developing
countries, where market liberalisation is still at a very early stage. Security
of supply is a public policy objective. But in free markets decisions are made
by market players rather than by governments. Markets allow even small and
medium-size consumers - as well as suppliers - a say in energy decisions. That
requires redefining the political dimension of energy security.
Markets clearly produce benefits for consumers: trade,
innovation, cost reduction, technological advances, and better allocation of
resources. Moreover, unbundling the supply chain enhances transparency and
allows tariffs to reflect real costs. Markets have also taught us a few lessons:
they have proven that they can adjust more easily than governments to changing
circumstances in the energy market and that it is costly to intervene against
the market for an extended period.
Market liberalisation is leaving much of the decision-making to
consumers. Are the consumers capable of making the right choices? Or would they
choose cheaper options (such as interruptible supply) even if that compromises
their energy supply security? This possibility suggests a need for a government
role. Moreover, liberalisation will not necessarily cover the entire supply
chain. Certain monopolies will remain in transmission and distribution.
Governments therefore have a duty to protect consumers at the very end of the
supply chain (retail consumers). In addition, the energy market may ignore the
interests of other consumer classes, such as remote and isolated consumers. All
this necessitates that government continue to be involved in the energy market
to a certain extent in almost every country.
The argument applies particularly to the supply side. Energy
development entails long-term, capital-intensive investments. Private investors
may demand a higher rate of return in a liberalised market than in a
government-controlled energy industry. In addition, markets usually look for
short-term profits and may therefore forgo diversification of supplies, which is
associated with high up-front investment and risk but long-term benefits. How
will markets respond to the long-term requirements of sustainable development,
which demands heavy investments in research and development? How can they meet
societies’ long-term interest in secure supplies at reasonable prices when
their interest is mainly in the short term? How can markets respond to an
emergency disruption of supply in exporting countries? The division between the
production and supply functions does not allow full integration of the security
function. Will the energy markets be able to internalise all the costs of
security, including political risk?
Having said all that, there are several reasons to believe that
regulatory reforms in the energy market that are aimed at enhancing competition
would promote energy security. First, as discussed, reforms can lead to
increased investment and trade in energy resources, which will, in turn,
facilitate expansion of energy production, increase inter-fuel competition, and
encourage the construction of trans-boundary energy delivery infrastructure,
such as oil and gas pipelines.
Second, also as discussed, the participation in downstream
operations by firms from oil-exporting economies, and the participation in
upstream operations by firms from oil-importing economies (all of which is
facilitated by market liberalisation), will be mutually beneficial and thus
increase both exporters’ and importers’ interest in energy security.
In Asia deregulation and other energy sector liberalisation will also promote
accelerated growth in energy supplies and a greater sense of energy security.
Third, regulatory reforms will enhance efficiency and
effectiveness, even in the area of energy supply emergency response. The
IEA’s oil supply emergency systems place growing emphasis on drawdowns of
oil stocks compared with such measures as demand restraint. The release of oil
stocks into the market is more market-oriented than government intervention to
restrain demand.
Thus energy sector regulatory reforms could be compatible with
or even enhance energy supply security. Governments, while withdrawing from
energy investments themselves, need to create a positive climate for trade and
investment. With increasing market liberalisation, there is a growing need for
governments to monitor private sector actors and deal with market failures.
Certain investors might be looking for concentration through mergers and joint
ventures, for example, which might conflict with government policy of promoting
liberalisation and fostering competition.
In considering the role of markets, the following questions are
increasingly asked: Can the important issue of energy security be left entirely
to markets? What is the role of the state in ensuring energy security in a
liberalised market
environment?
The role of the state
Markets are playing an increasingly progressive role in energy.
This role is prominent in most OECD countries, modest in some developing
countries, and absent in others, where the state remains almost solely
responsible for the energy market and the security of supplies and services.
In a globalised market economy, energy security becomes a matter
of prices, economic growth rates, and wealth transfers. In an energy (oil)
crisis it cannot be assumed that free market conditions will prevail throughout
the crisis (Jaffe, 1998). Thus the state still has an important role to play in
almost in every country:
· Sending clear
signals to markets so that they can be guided by the state’s long-term
energy policy.
· Continuing to act as a
regulator to ensure fair play in the market.
· Ensuring long-term security by
making the bold or costly decisions that the market cannot make on its own, such
as diversifying fuels and encouraging renewables.
· Preserving the environment and
enforcing environmental policies.
· Holding oil stocks for supply
security and coordinating with other governments in such arrangements.
· Collecting and disseminating
accurate energy market information in the event of emergencies. Left on their
own, markets may respond nervously to rumours or distorted information, adding
to the confusion and insecurity. Official information systems greatly helped to
calm the markets in 1991 following the Gulf war and restored market stability.
· Financing and investing in
research and development of new energy technologies and in improving efficiency,
and encouraging markets to invest in research and development by offering tax
and other incentives.
· Trying to incorporate the
‘externalities’ (such as long-term assurance of supply, environmental
protection, and protection against possible disruptions) in a market-oriented
setting.
Structural reforms are helping to foster competition by
liberalising markets, but such competition and cost cutting should not be
allowed to threaten long-term security of supplies to final consumers. That
remains a government
responsibility.
Regional cooperation and the growing importance of regional electricity grids and network energies
Use of electricity is growing more rapidly than use of all
energy services. Over the next 20 years electricity production is expected to
increase by about 3 percent a year, compared with average growth in total energy
use of less than 2 percent a year. With this will come growth of electricity
grids and regional interconnections. National and regional natural gas networks
are also growing as reliance on gas increases because of its price and its
environmental attractiveness. All this reflects consumers’ growing
preference for network energy. Energy security for consumers is thus no longer
limited to the availability of resources and geo-political considerations. It is
becoming increasingly dependent on markets and competition and on the security
of regional networks, a vitally important issue.
Interconnection of neighbouring national grids (electricity and
gas networks) into regional grids greatly enhances energy security. It also
reduces the cost of supply by taking advantage of differences in peak demand and
by allowing a reduction in standby power and reserve generating capacity and the
use of cheaper resources. Today regional electricity grids exist not only in
Europe but also in many other parts of the world. While the increasing
interconnections across borders are providing great benefits to consumers,
supply interruptions still occur, mainly because of problems in the local
distribution system.
|
Markets usually
look for short-term
profits and may
therefore
forgo diversification
of supplies. |
Conclusion
· All indications
point to a gradual but steady improvement in energy security in all parts of the
world, thanks to technological advances, adequacy of resources, and regional
cooperation, energy agencies and treaties, and international trade
organisations.
· Present energy security aims
go beyond merely ensuring the availability of abundant oil supplies at
affordable prices. They also include ensuring long-term energy adequacy in a new
economic environment of deregulated and liberalised markets and fostering
sustainable development.
· The resource base of fossil
fuels is clearly adequate for meeting global energy service requirements well
into the second half of the 21st century. But the resources - particularly crude
oil and, to a lesser extent, gas - are mismatched between regions and between
consuming and producing countries, raising geopolitical questions. Oil resources
are heavily concentrated in the Gulf region, a part of the world that has
experienced security problems. However, recent trends in energy utilisation and
oil technologies are contributing greatly towards stability of supplies and
prices in the oil market.
· The world will continue to
depend on fossil fuels for decades to come. But these fuels have detrimental
impacts on the environment that must be dealt with to achieve sustainable
development. This requires promoting clean energy technologies, pursuing energy
efficiency, developing renewable forms of energy, and providing technical
assistance to developing countries, where most growth in energy use will take
place.
· Deregulation and market
liberalisation pose questions for energy security and for the future role of the
state with respect to energy security. Markets lead to innovation, reduce costs,
increase trade, improve allocation of resources, and spur technological
development, all of which enhance energy security. Markets also normally pursue
short-term objectives, while energy security demands long-term planning,
investment, and political will. The state therefore needs to continue to play a
role in ensuring national long-term security of supplies and protecting
consumers.
· Consumers are gradually opting
for energy supplied by grid (electricity and gas). This greatly enhances
security of supply, reduces costs, and fosters regional cooperation.
· With energy services
increasingly being supplied by electricity, the security of the electric power
supply, in terms of both continuity and quality, is becoming paramount.
Interruptions, even transient ones, cause serious income and welfare losses for
consumers. In many developing countries the security and availability of the
electricity supply leave much to be desired, pointing to a need for capital
investments. The steady expansion of regional electricity grids, however, is
helping to improve the security of electricity supply.
Note
1. The total nuclear fuel cycle cost, including enrichment and
other fuel processing services, contributes 15 - 20 percent to the cost of
nuclear electricity, but the cost of uranium presently accounts for only about
10 percent of the nuclear fuel cycle cost.
References
ADB (African Development Bank). 1999. Infrastructure
Development in Africa. Abidjan.
AFP (Agence France-Presse). 1998. "Gulf States Cannot Afford to
Finance Another War." Jordan Times, 16 February, p. 10.
Campbell, C.J., and J.H. Laherrere. 1998. "The End of Cheap
Oil." Scientific American 278: 60 - 65.
David, S.R. 1999. "Saving America from the Coming Civil Wars."
Foreign Affairs 78: 103 - 16.
Douaud, A. 1999. "Automotive Fuels." Oxford Energy Forum
(36): 18 - 19.
EC (European Commission). 1999. "Economic Foundations for Energy
Policy." Energy in Europe (special issue, December): 1 - 170.
Ecoal. 1998. World Coal Institute 28(1).
IEA (International Energy Agency). 1998. World Energy
Outlook. Paris.
IIASA (International Institute for Applied Systems Analysis) and
WEC (World Energy Council). 1998. Global Energy Perspectives. Edited by
Nebojsa Nakicenovic, Arnulf Grübler, and Alan McDonald. Cambridge: Cambridge
University Press.
Jaffe, A. 1998. "The Political, Economic, Social, Cultural and
Religious Trends in the Middle East and the Gulf and Their Impact on Energy
Supply, Security and Pricing - Energy Security." Rice University, Baker
Institute, Houston, Tex.
Kemp, G., and R. Harkavy. 1997. Strategic Geography and the
Changing Middle East. Washington, D.C.: Brookings Institution Press.
Khatib, H. 1997. Financial and Economic Evaluation of
Projects. London: Institution of Electrical Engineers.
Maillard, D. 1999. "Energy Security." Ministry of Economy,
Finance, and Industry, Paris.
Martin, W., R. Imai, and H. Steeg. 1996. Maintaining Energy
Security in a Global Context. New York: Trilateral Commission.
Masters, C.D. 1994. World Petroleum Assessment and
Analysis. Proceedings of the 14th World Petroleum Congress. New York: John
Wiley & Sons.
McKelvey, V.E. 1972. "Mineral Resource Estimates and Public
Policy." American Scientist 60: 32 - 40.
Mitchell, J.V. 1997. Will Western Europe Face an Energy
Shortage? Strasbourg: Energy Council of France.
Murray, J. 1995. "Nuclear Non-proliferation: Challenges for the
Future." Speech to the Australian Institute of International Affairs, Melbourne,
December.
Newton-Evans Research Company. 1998. Market Trend Digest
(summer). Baltimore.
Schuetterle, P. 1999. Secretary-General of the Energy Charter.
Personal correspondence. January.
USAID (U.S. Agency for International Development). 1988.
Power Shortages in Developing Countries: Magnitude, Impacts, Solutions, and
the Role of the Private Sector. Report to U.S. Congress. March. Washington,
D.C.
USDOE (U.S. Department of Energy). 1998. Annual Energy
Outlook 1999. Washington, D.C.
Walker, W. 1998. "Nuclear Power and Nonproliferation." In M.
Poireau and A. Zurita, eds., Nuclear in a Changing World: Proceedings of the
European Seminar. Vol. 2. XII/0318/98.EN. Brussels: European Commission,
Directorate-General XII, Science, Research and Development.
WEC (World Energy Council). 1998. Survey of Energy Resources.
London.
World Bank. 1999. World Development Report 1999/2000:
Entering the 21st Century. New York: Oxford University
Press.